Monday, April 14, 2025 · After Close
Explosive Up Setups38
 click to enlarge
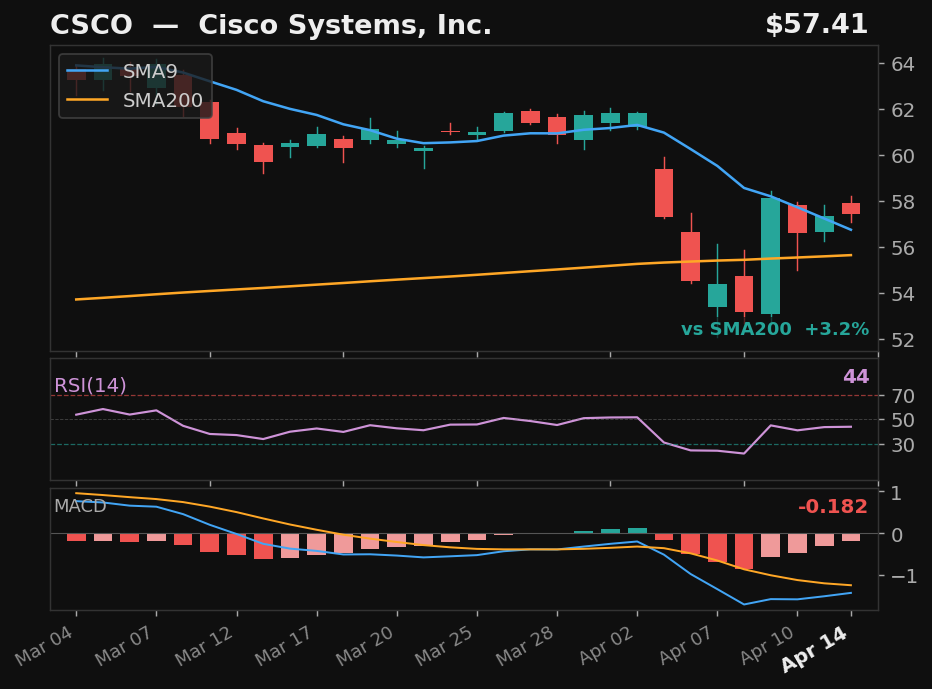
CSCO
Cisco Systems, Inc.
NASDAQ
- 14.0% pullback — 6 days below SMA9
- Prior rally: 16%
- Above SMA200 (3%)
- MACD histogram rising from negative — early momentum signal
ExplosiveUp
Exp Score75Days Below6Pullback%14.0
Returns
StockMktDiff
1D-0.4%-0.3%-0.1%
2D-2.9%-2.5%-0.4%
3D-2.9%-2.4%-0.5%
5D-4.1%-2.2%-1.9%
10D-0.1%+2.8%-2.9%
 click to enlarge
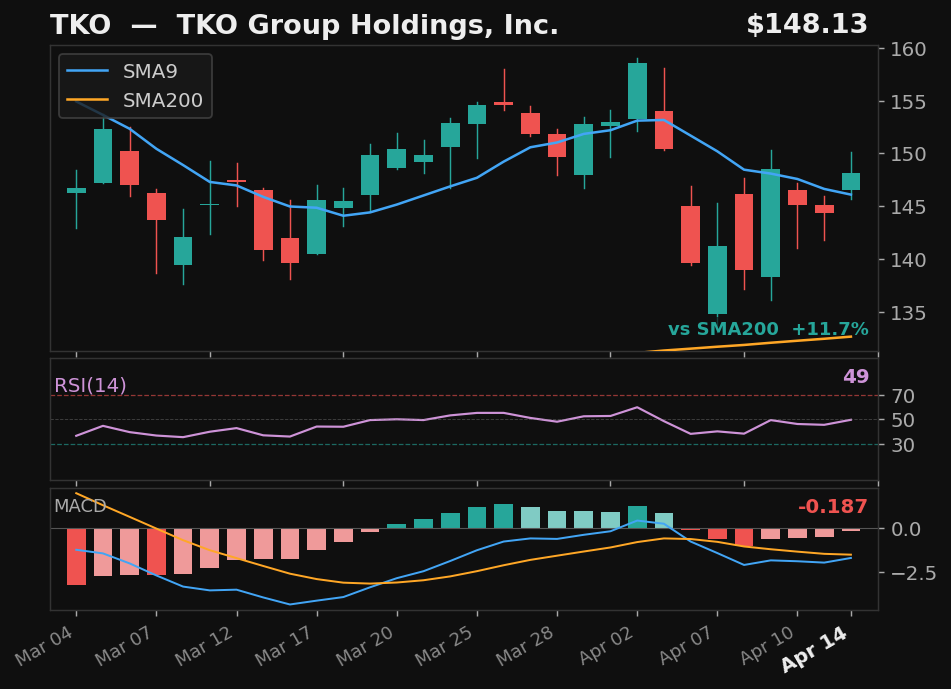
TKO
TKO Group Holdings, Inc.
NYSE
- 12.4% pullback — 6 days below SMA9
- Prior rally: 14%
- Above SMA200 (12%)
- MACD histogram rising from negative — early momentum signal
ExplosiveUp
Exp Score72Days Below6Pullback%12.4
Returns
StockMktDiff
1D+1.0%-0.3%+1.3%
2D-0.1%-2.5%+2.4%
3D+0.7%-2.4%+3.1%
5D+0.0%-2.2%+2.2%
10D+10.0%+2.8%+7.2%
 click to enlarge
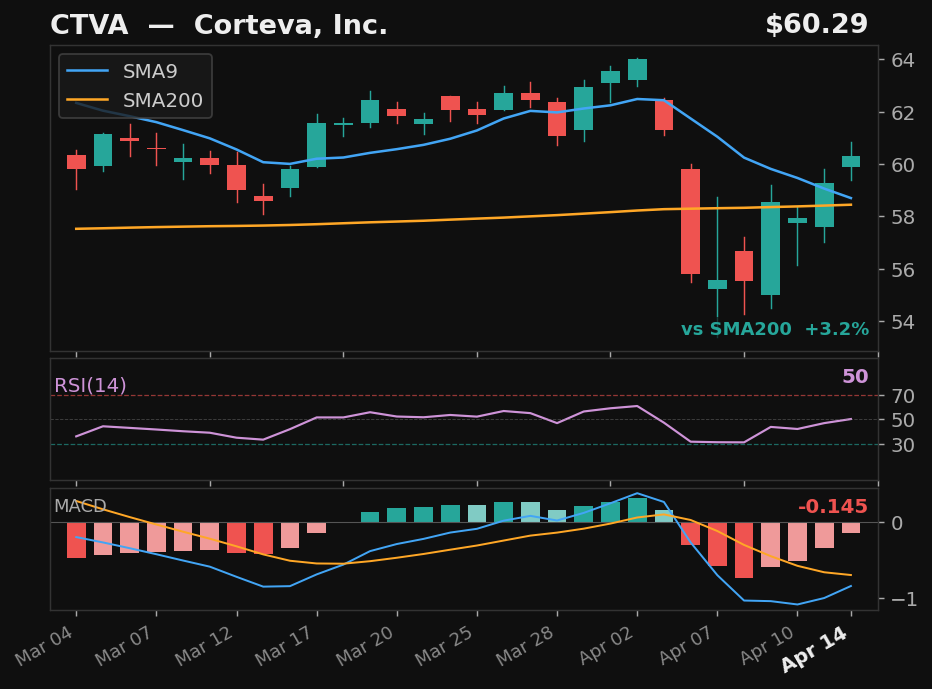
CTVA
Corteva, Inc.
NYSE
- 13.2% pullback — 6 days below SMA9
- Prior rally: 15%
- Above SMA200 (3%)
- MACD histogram rising from negative — early momentum signal
ExplosiveUp
Exp Score72Days Below6Pullback%13.2
Returns
StockMktDiff
1D-1.0%-0.3%-0.7%
2D-1.8%-2.5%+0.7%
3D-0.9%-2.4%+1.4%
5D+0.6%-2.2%+2.8%
10D+2.5%+2.8%-0.3%
 click to enlarge
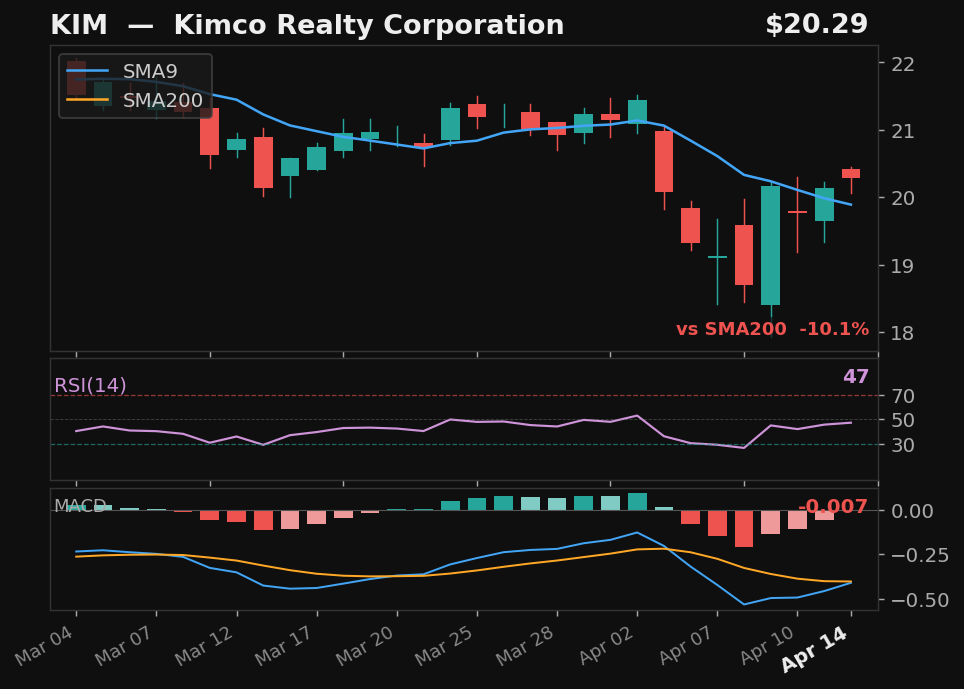
KIM
Kimco Realty Corporation
NYSE
- 12.8% pullback — 6 days below SMA9
- Prior rally: 15%
- MACD histogram rising from negative — early momentum signal
ExplosiveUp
Exp Score71Days Below6Pullback%12.8
Returns
StockMktDiff
1D+0.0%-0.3%+0.3%
2D-0.6%-2.5%+1.9%
3D+1.5%-2.4%+3.8%
5D+0.8%-2.2%+3.0%
10D-1.0%+2.8%-3.9%
 click to enlarge
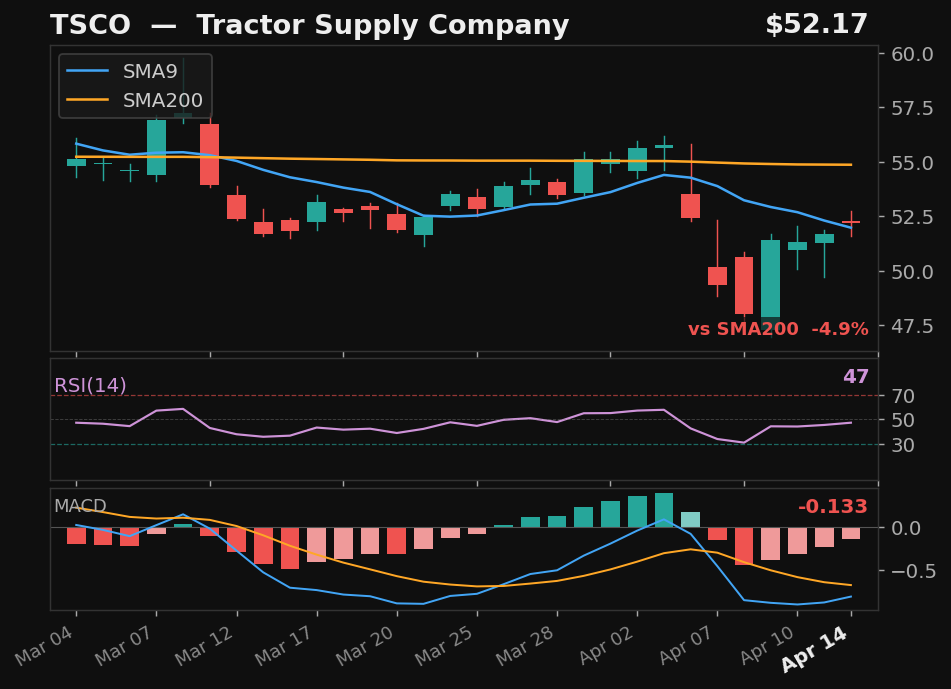
TSCO
Tractor Supply Company
NASDAQ
- 13.9% pullback — 6 days below SMA9
- Prior rally: 16%
- MACD histogram rising from negative — early momentum signal
ExplosiveUp
Exp Score71Days Below6Pullback%13.9
Returns
StockMktDiff
1D-2.2%-0.3%-2.0%
2D-5.4%-2.5%-2.9%
3D-3.9%-2.4%-1.5%
5D-3.6%-2.2%-1.4%
10D-4.4%+2.8%-7.2%
 click to enlarge
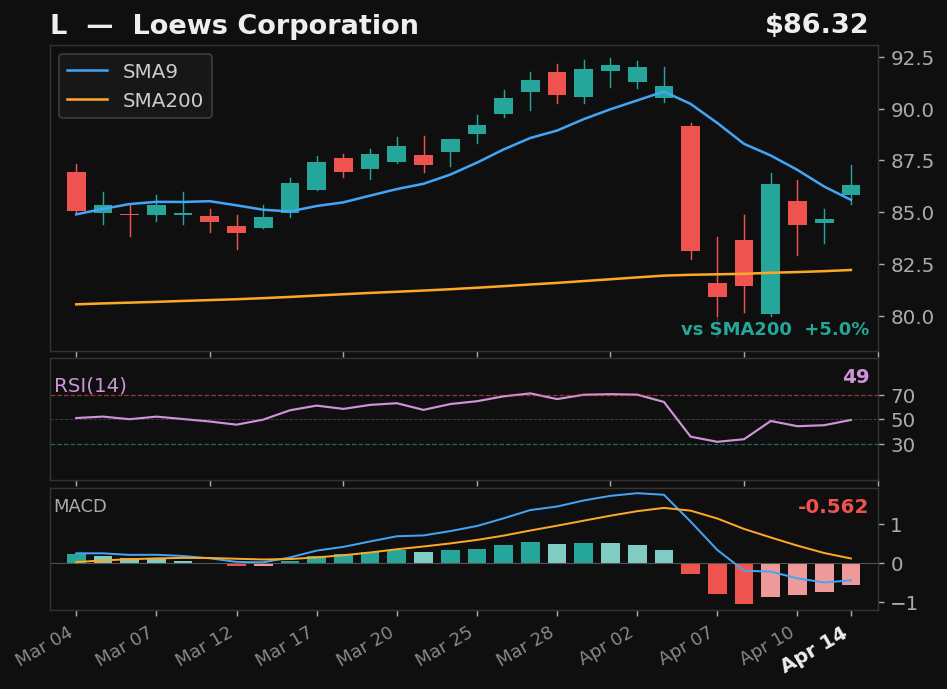
L
Loews Corporation
NYSE
- 12.1% pullback — 6 days below SMA9
- Prior rally: 14%
- Above SMA200 (5%)
- MACD histogram rising from negative — early momentum signal
ExplosiveUp
Exp Score69Days Below6Pullback%12.1
Returns
StockMktDiff
1D-0.2%-0.3%+0.1%
2D-1.3%-2.5%+1.2%
3D-1.2%-2.4%+1.2%
5D-0.7%-2.2%+1.5%
10D+0.4%+2.8%-2.4%
 click to enlarge
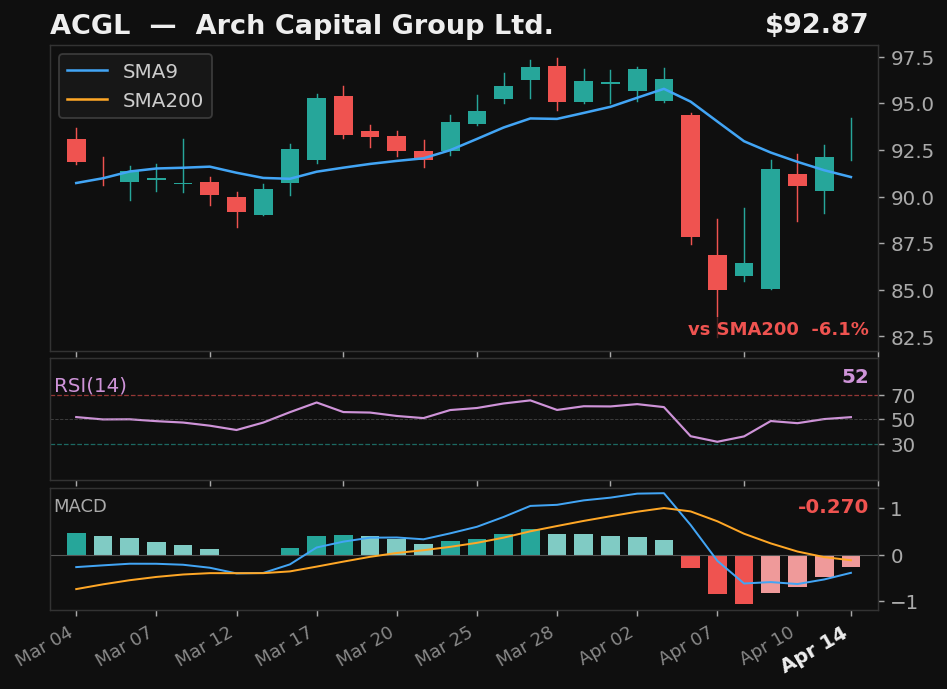
ACGL
Arch Capital Group Ltd.
NASDAQ
- 12.2% pullback — 5 days below SMA9
- Prior rally: 14%
- MACD histogram rising from negative — early momentum signal
ExplosiveUp
Exp Score68Days Below5Pullback%12.2
Returns
StockMktDiff
1D-0.4%-0.3%-0.2%
2D-0.5%-2.5%+2.0%
3D-0.3%-2.4%+2.0%
5D+0.1%-2.2%+2.3%
10D-0.5%+2.8%-3.3%
 click to enlarge
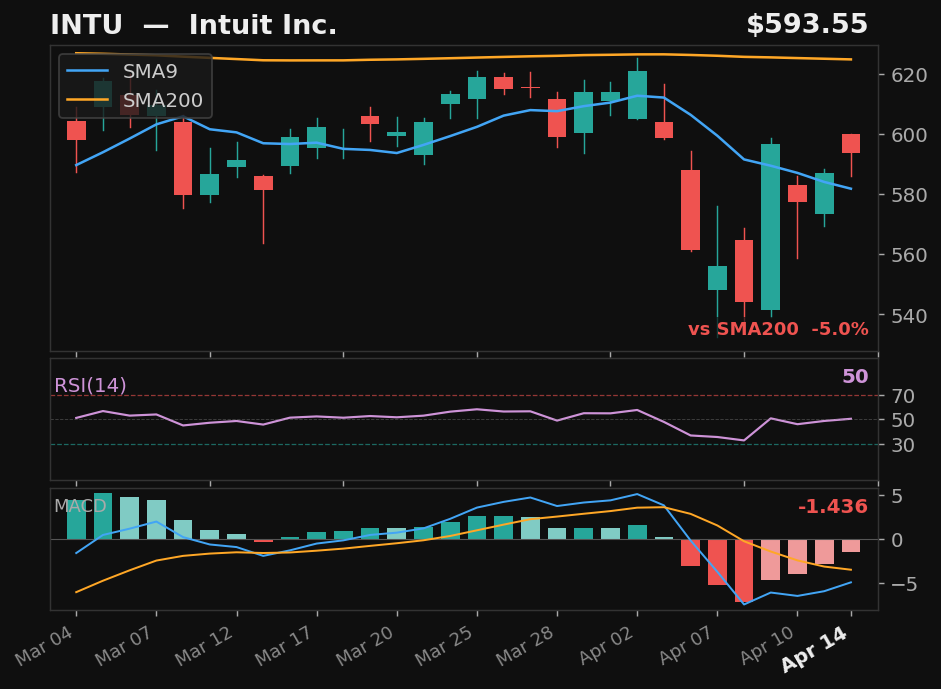
INTU
Intuit Inc.
NASDAQ
- 12.4% pullback — 5 days below SMA9
- Prior rally: 14%
- MACD histogram rising from negative — early momentum signal
ExplosiveUp
Exp Score68Days Below5Pullback%12.4
Returns
StockMktDiff
1D+0.1%-0.3%+0.4%
2D-0.9%-2.5%+1.6%
3D-1.4%-2.4%+1.0%
5D-1.7%-2.2%+0.5%
10D+5.0%+2.8%+2.2%
 click to enlarge
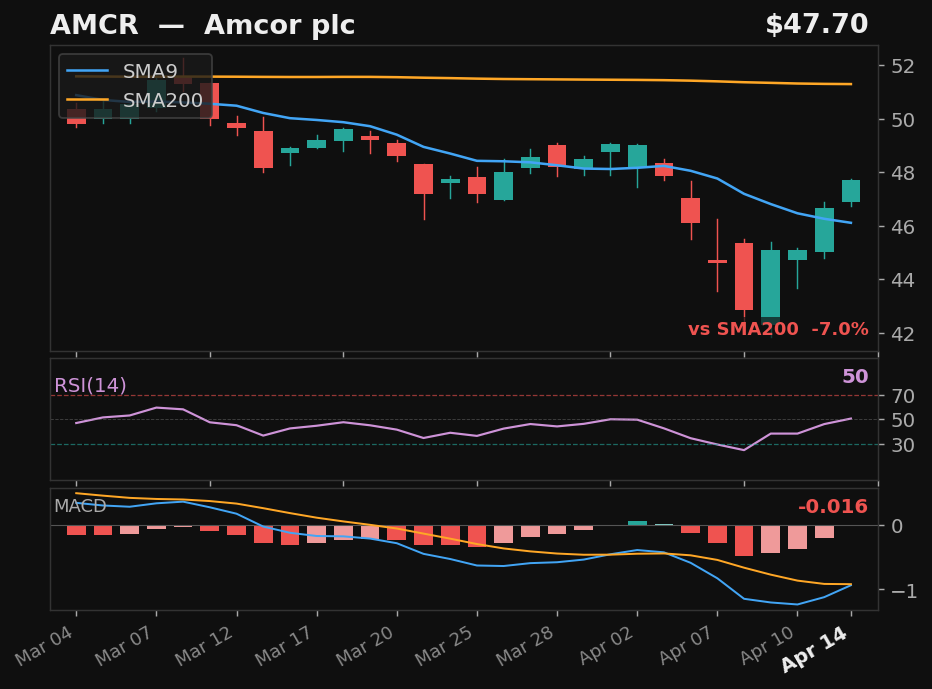
AMCR
Amcor plc
NYSE
- 12.6% pullback — 6 days below SMA9
- Prior rally: 14%
- MACD histogram rising from negative — early momentum signal
ExplosiveUp
Exp Score68Days Below6Pullback%12.6
Returns
StockMktDiff
1D-1.9%-0.3%-1.6%
2D-3.0%-2.5%-0.5%
3D-1.6%-2.4%+0.8%
5D+0.2%-2.2%+2.4%
10D-2.2%+2.8%-5.0%
 click to enlarge
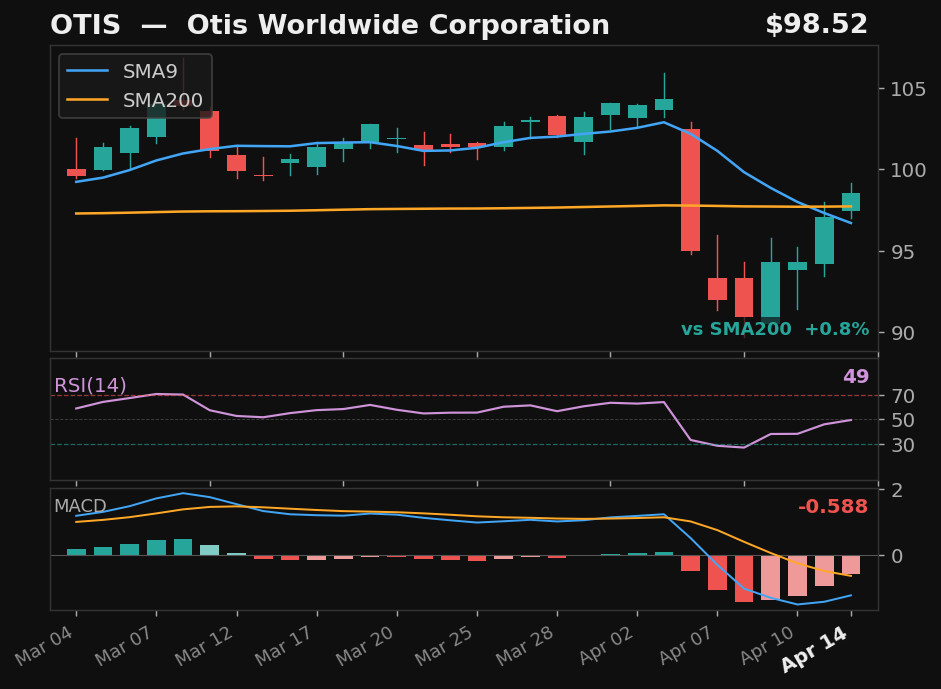
OTIS
Otis Worldwide Corporation
NYSE
- 12.9% pullback — 6 days below SMA9
- Prior rally: 15%
- Above SMA200 (1%)
- MACD histogram rising from negative — early momentum signal
ExplosiveUp
Exp Score67Days Below6Pullback%12.9
Returns
StockMktDiff
1D+0.3%-0.3%+0.6%
2D-1.8%-2.5%+0.7%
3D-0.0%-2.4%+2.4%
5D+0.4%-2.2%+2.6%
10D-3.7%+2.8%-6.5%
 click to enlarge
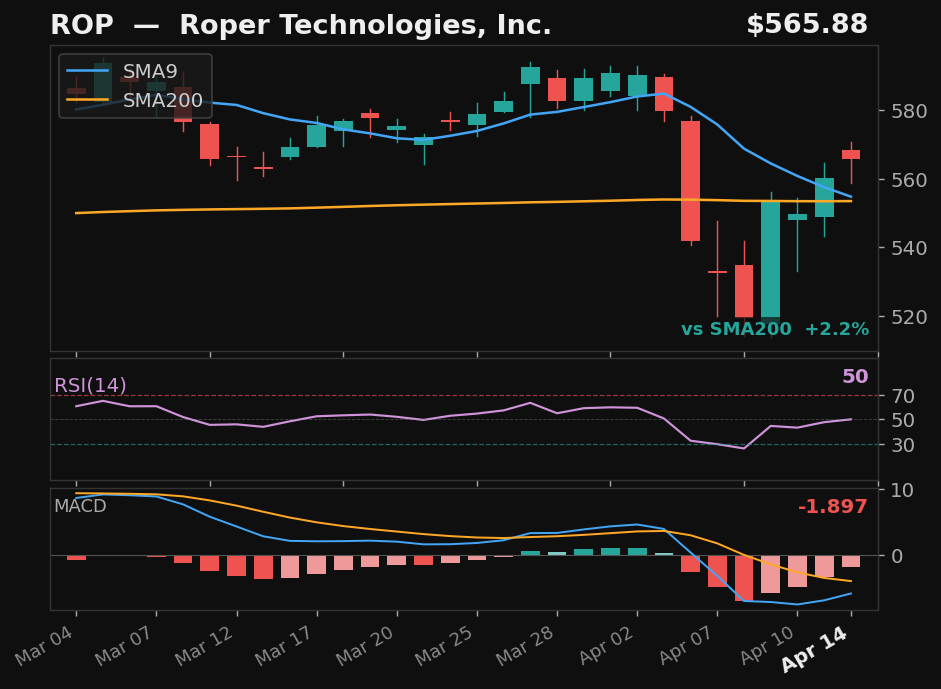
ROP
Roper Technologies, Inc.
NASDAQ
- 12.1% pullback — 6 days below SMA9
- Prior rally: 14%
- Above SMA200 (2%)
- MACD histogram rising from negative — early momentum signal
ExplosiveUp
Exp Score67Days Below6Pullback%12.1
Returns
StockMktDiff
1D+0.2%-0.3%+0.5%
2D-1.7%-2.5%+0.8%
3D-1.5%-2.4%+0.8%
5D-2.6%-2.2%-0.4%
10D-1.7%+2.8%-4.5%
 click to enlarge
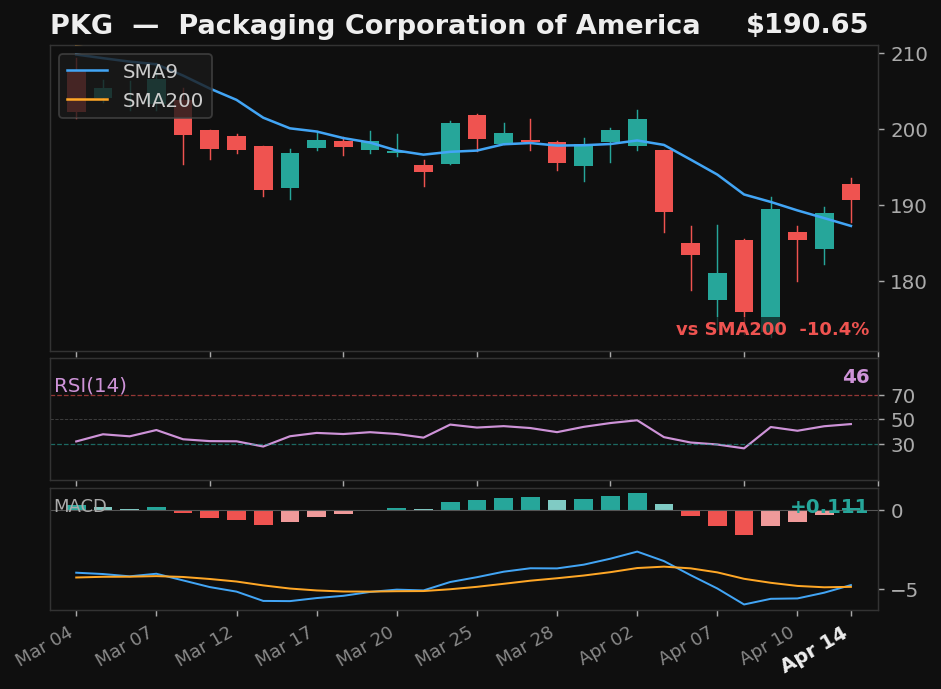
PKG
Packaging Corporation of America
NYSE
- 12.6% pullback — 6 days below SMA9
- Prior rally: 14%
- MACD momentum building
ExplosiveUp
Exp Score66Days Below6Pullback%12.6
Returns
StockMktDiff
1D-1.0%-0.3%-0.7%
2D-2.1%-2.5%+0.4%
3D-1.8%-2.4%+0.5%
5D-2.2%-2.2%-0.0%
10D-2.4%+2.8%-5.3%
 click to enlarge
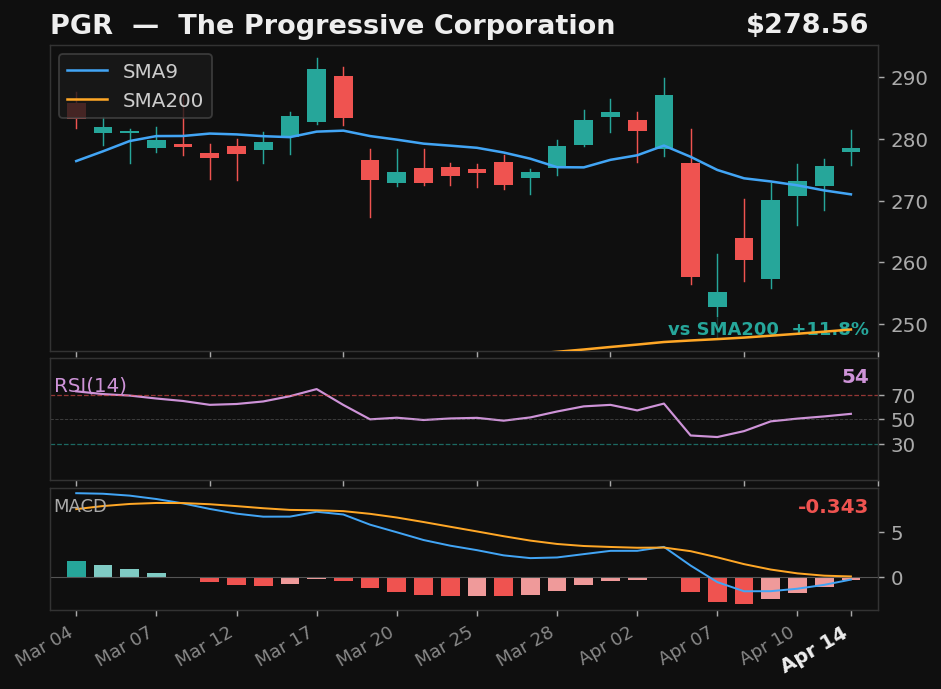
PGR
The Progressive Corporation
NYSE
- 11.1% pullback — 4 days below SMA9
- Prior rally: 12%
- Above SMA200 (12%)
- MACD histogram rising from negative — early momentum signal
ExplosiveUp
Exp Score60Days Below4Pullback%11.1
Returns
StockMktDiff
1D-0.9%-0.3%-0.6%
2D-1.2%-2.5%+1.3%
3D-4.7%-2.4%-2.3%
5D-4.8%-2.2%-2.6%
10D-0.8%+2.8%-3.6%
 click to enlarge
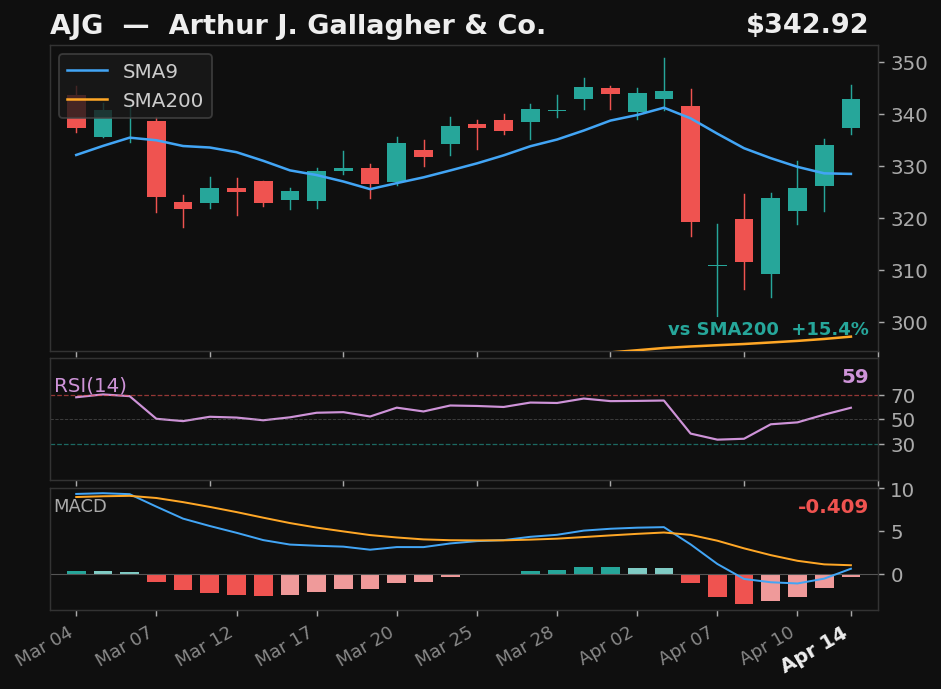
AJG
Arthur J. Gallagher & Co.
NYSE
- 9.7% pullback — 5 days below SMA9
- Prior rally: 11%
- Above SMA200 (15%)
- MACD histogram rising from negative — early momentum signal
ExplosiveUp
Exp Score55Days Below5Pullback%9.7
Returns
StockMktDiff
1D-2.1%-0.3%-1.9%
2D-3.0%-2.5%-0.5%
3D-4.0%-2.4%-1.6%
5D-3.5%-2.2%-1.3%
10D-7.5%+2.8%-10.3%
 click to enlarge
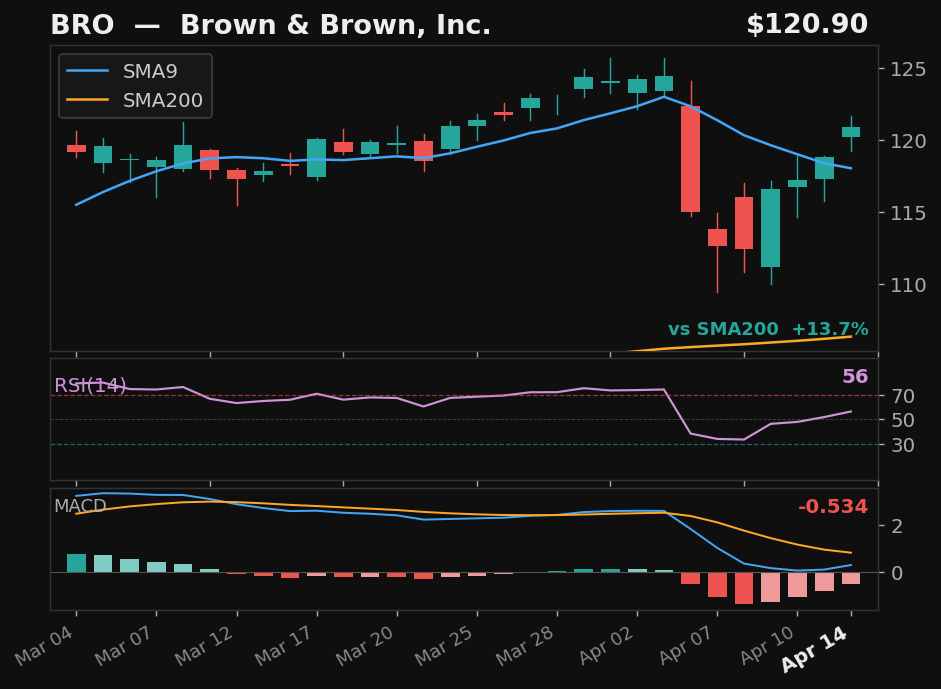
BRO
Brown & Brown, Inc.
NYSE
- 9.7% pullback — 5 days below SMA9
- Prior rally: 11%
- Above SMA200 (14%)
- MACD histogram rising from negative — early momentum signal
ExplosiveUp
Exp Score55Days Below5Pullback%9.7
Returns
StockMktDiff
1D-1.1%-0.3%-0.9%
2D-1.7%-2.5%+0.8%
3D-3.0%-2.4%-0.7%
5D-2.8%-2.2%-0.6%
10D-10.7%+2.8%-13.5%
 click to enlarge
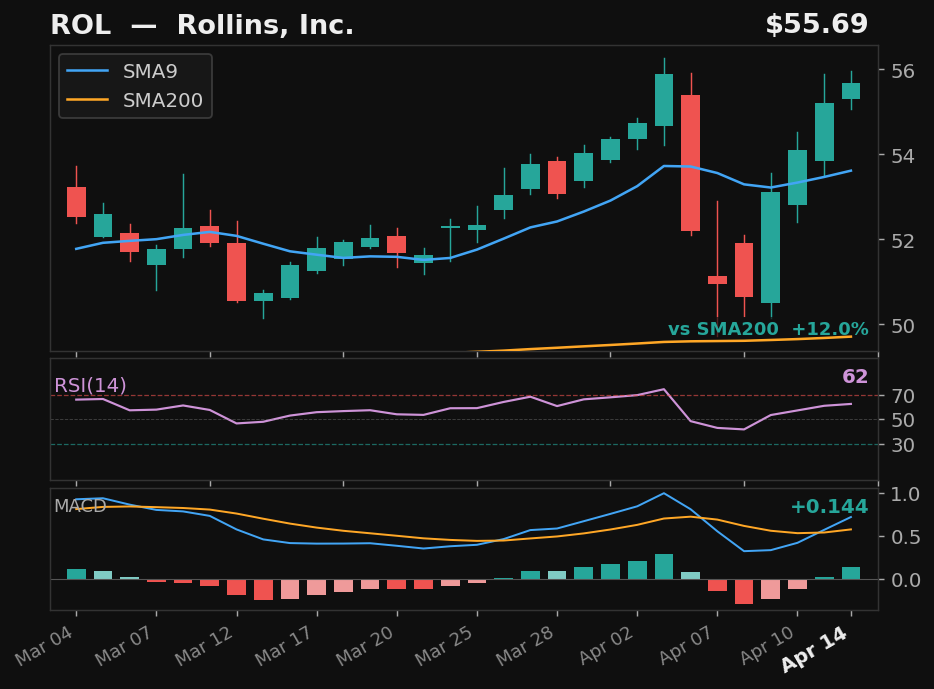
ROL
Rollins, Inc.
NYSE
- 9.4% pullback — 4 days below SMA9
- Prior rally: 10%
- Above SMA200 (12%)
- MACD momentum building
ExplosiveUp
Exp Score55Days Below4Pullback%9.4
Returns
StockMktDiff
1D-0.6%-0.3%-0.3%
2D-1.2%-2.5%+1.3%
3D+0.2%-2.4%+2.5%
5D-0.1%-2.2%+2.1%
10D+1.2%+2.8%-1.7%
 click to enlarge
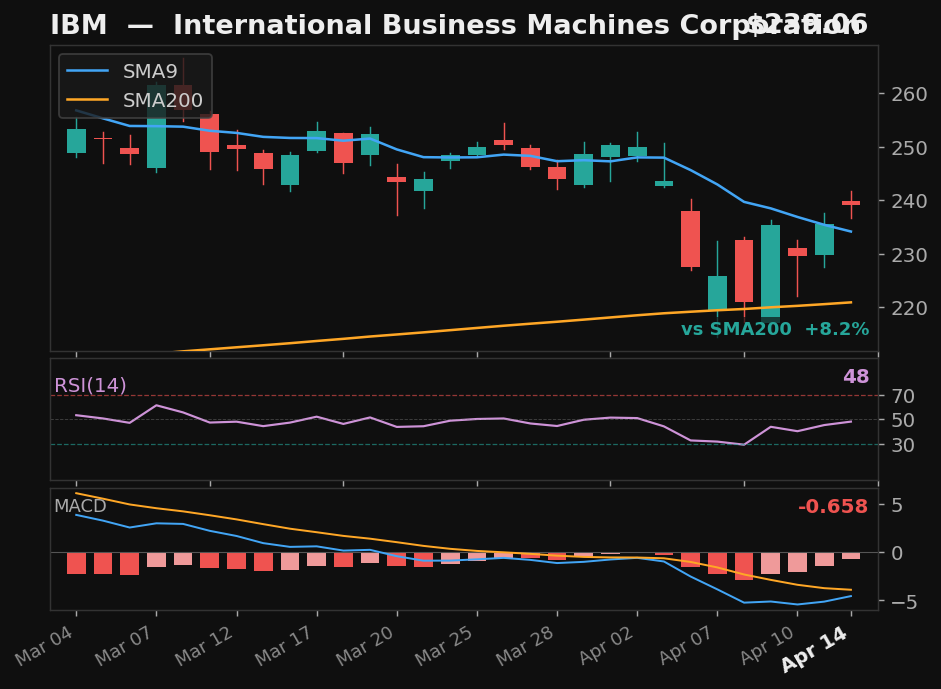
IBM
International Business Machines Corporation
NYSE
- 11.6% pullback — 6 days below SMA9
- Prior rally: 13%
- Above SMA200 (8%)
- MACD histogram rising from negative — early momentum signal
ExplosiveUp
Exp Score52Days Below6Pullback%11.6
Returns
StockMktDiff
1D+0.7%-0.3%+1.0%
2D-0.2%-2.5%+2.3%
3D-0.1%-2.4%+2.3%
5D+0.8%-2.2%+3.0%
10D+0.1%+2.8%-2.7%
 click to enlarge
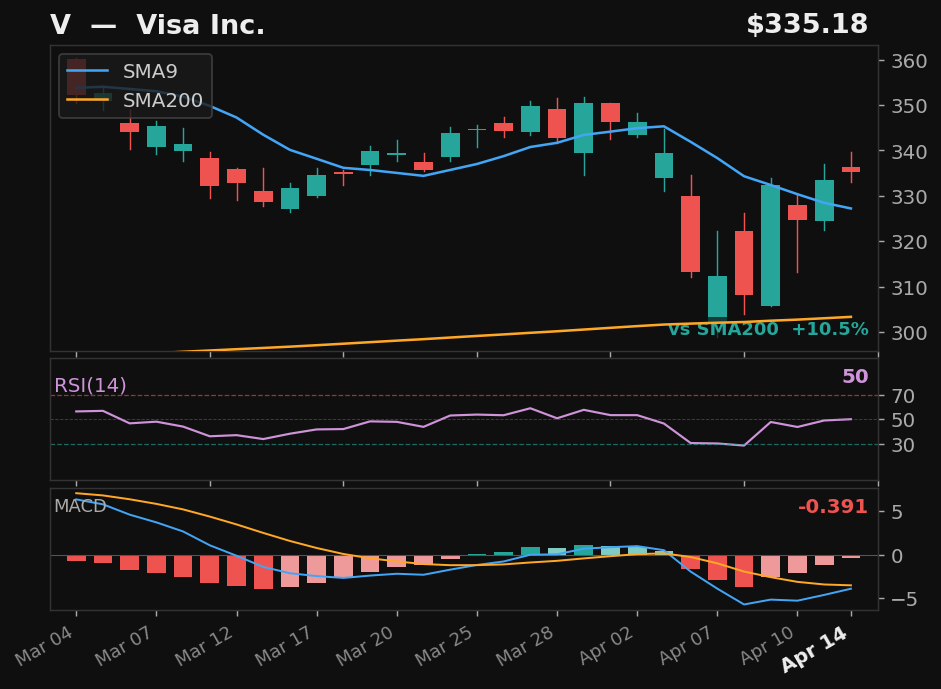
V
Visa Inc.
NYSE
- 11.0% pullback — 5 days below SMA9
- Prior rally: 12%
- Above SMA200 (10%)
- MACD histogram rising from negative — early momentum signal
ExplosiveUp
Exp Score52Days Below5Pullback%11.0
Returns
StockMktDiff
1D+0.2%-0.3%+0.5%
2D-1.1%-2.5%+1.3%
3D-1.7%-2.4%+0.7%
5D-1.1%-2.2%+1.1%
10D+1.9%+2.8%-0.9%
 click to enlarge
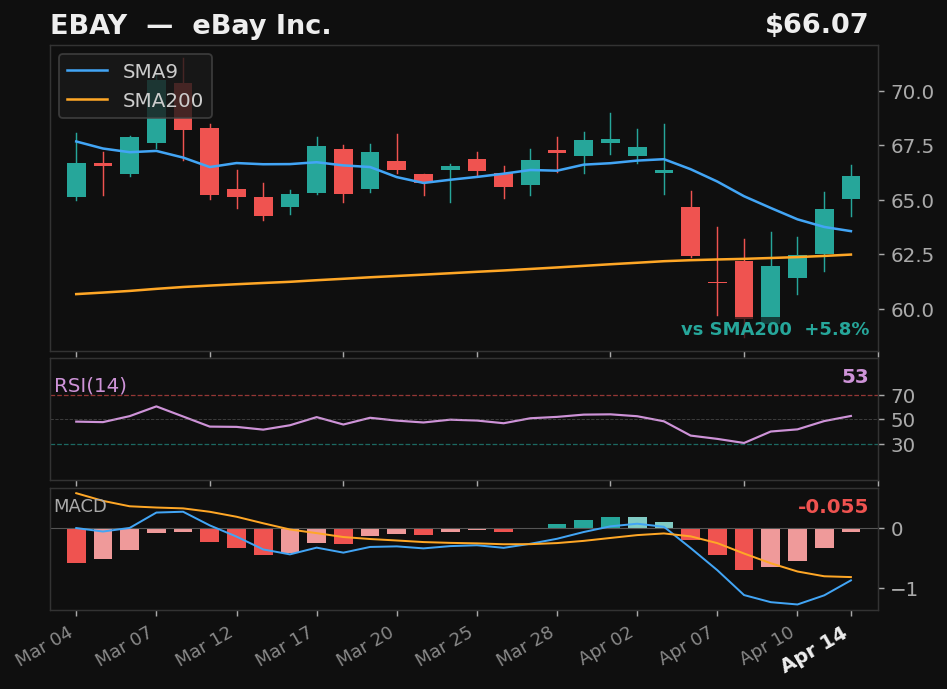
EBAY
eBay Inc.
NASDAQ
- 11.7% pullback — 6 days below SMA9
- Prior rally: 13%
- Above SMA200 (6%)
- MACD histogram rising from negative — early momentum signal
ExplosiveUp
Exp Score52Days Below6Pullback%11.7
Returns
StockMktDiff
1D-0.9%-0.3%-0.6%
2D-0.9%-2.5%+1.6%
3D+0.3%-2.4%+2.6%
5D+1.5%-2.2%+3.7%
10D+1.7%+2.8%-1.1%
 click to enlarge
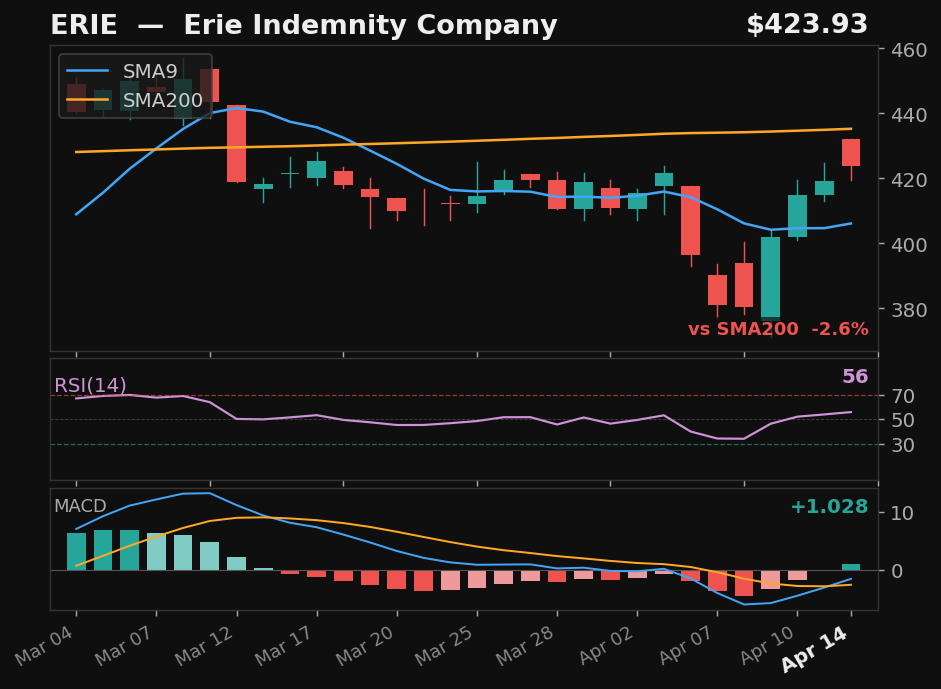
ERIE
Erie Indemnity Company
NASDAQ
- 9.7% pullback — 4 days below SMA9
- Prior rally: 11%
- MACD momentum building
ExplosiveUp
Exp Score50Days Below4Pullback%9.7
Returns
StockMktDiff
1D-1.0%-0.3%-0.7%
2D-2.8%-2.5%-0.3%
3D-3.1%-2.4%-0.7%
5D-4.4%-2.2%-2.2%
10D-16.1%+2.8%-18.9%
 click to enlarge
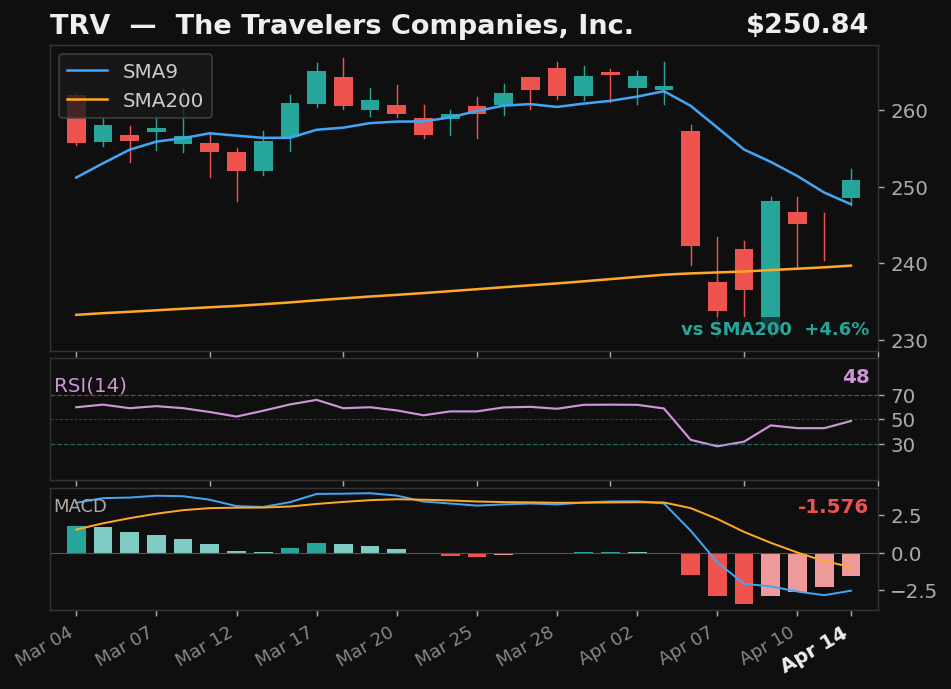
TRV
The Travelers Companies, Inc.
NYSE
- 11.1% pullback — 6 days below SMA9
- Prior rally: 13%
- Above SMA200 (5%)
- MACD histogram rising from negative — early momentum signal
ExplosiveUp
Exp Score49Days Below6Pullback%11.1
Returns
StockMktDiff
1D-0.5%-0.3%-0.2%
2D+0.7%-2.5%+3.2%
3D+2.0%-2.4%+4.4%
5D+4.2%-2.2%+6.4%
10D+5.3%+2.8%+2.4%
 click to enlarge
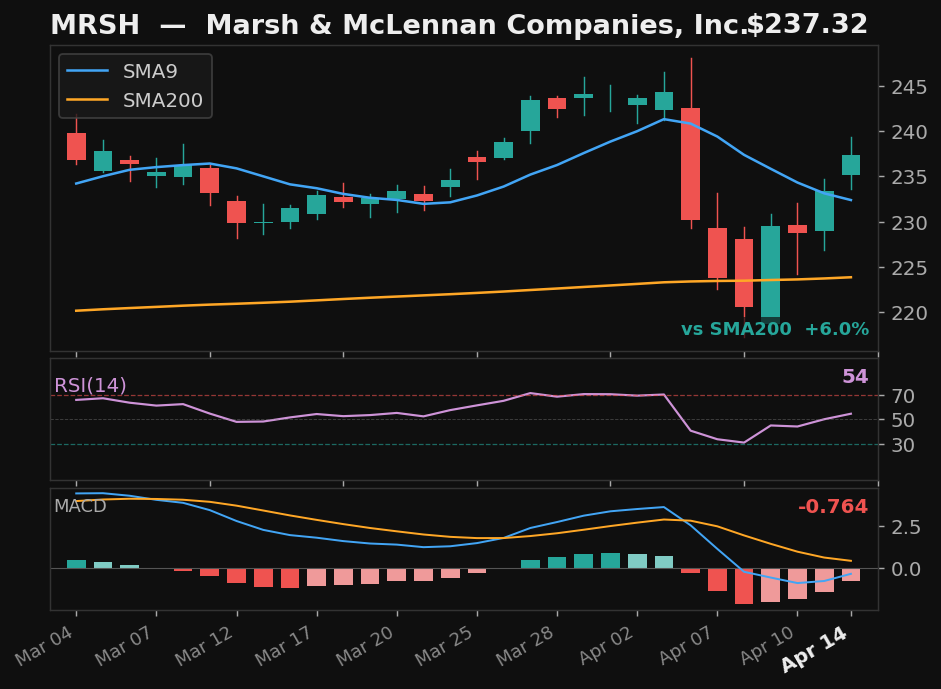
MRSH
Marsh & McLennan Companies, Inc.
NYSE
- 9.7% pullback — 5 days below SMA9
- Prior rally: 11%
- Above SMA200 (6%)
- MACD histogram rising from negative — early momentum signal
ExplosiveUp
Exp Score49Days Below5Pullback%9.7
Returns
StockMktDiff
1D-2.1%-0.3%-1.8%
2D-2.5%-2.5%-0.0%
3D-7.3%-2.4%-4.9%
5D-7.5%-2.2%-5.3%
10D-6.5%+2.8%-9.3%
 click to enlarge
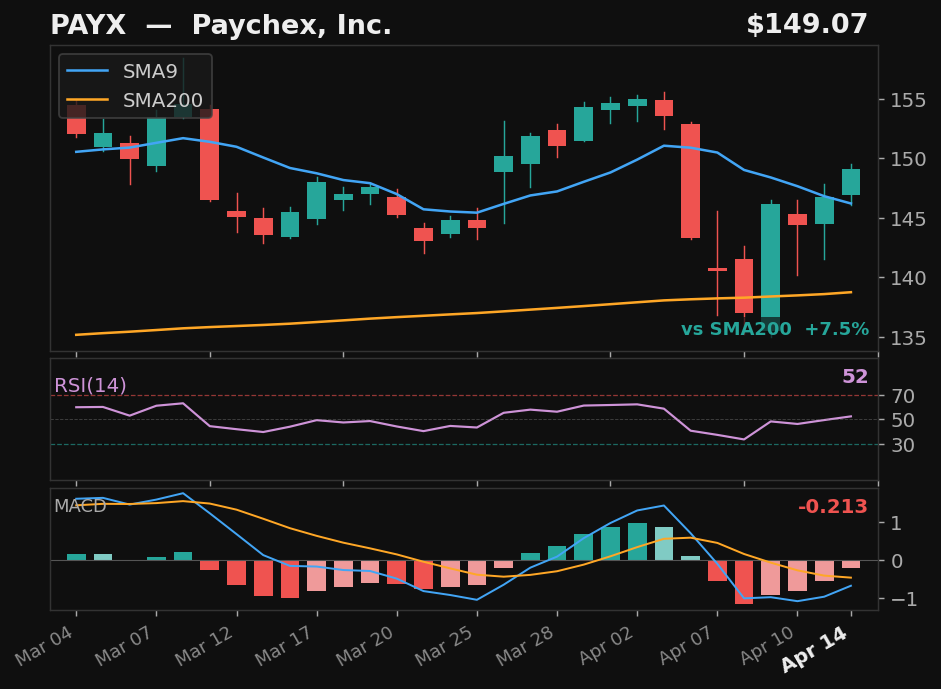
PAYX
Paychex, Inc.
NASDAQ
- 10.8% pullback — 6 days below SMA9
- Prior rally: 12%
- Above SMA200 (7%)
- MACD histogram rising from negative — early momentum signal
ExplosiveUp
Exp Score49Days Below6Pullback%10.8
Returns
StockMktDiff
1D-1.0%-0.3%-0.7%
2D-2.3%-2.5%+0.1%
3D-2.8%-2.4%-0.4%
5D-3.9%-2.2%-1.7%
10D-1.8%+2.8%-4.6%
 click to enlarge
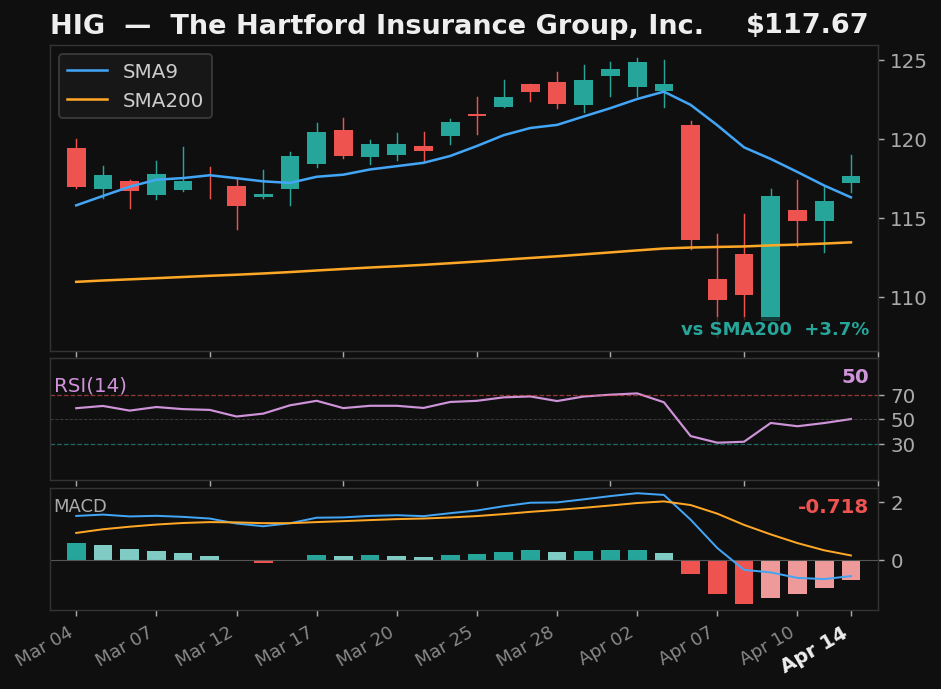
HIG
The Hartford Insurance Group, Inc.
NYSE
- 11.0% pullback — 6 days below SMA9
- Prior rally: 12%
- Above SMA200 (4%)
- MACD histogram rising from negative — early momentum signal
ExplosiveUp
Exp Score49Days Below6Pullback%11.0
Returns
StockMktDiff
1D-0.4%-0.3%-0.2%
2D-0.4%-2.5%+2.1%
3D+0.1%-2.4%+2.5%
5D+0.9%-2.2%+3.1%
10D+3.9%+2.8%+1.0%
 click to enlarge
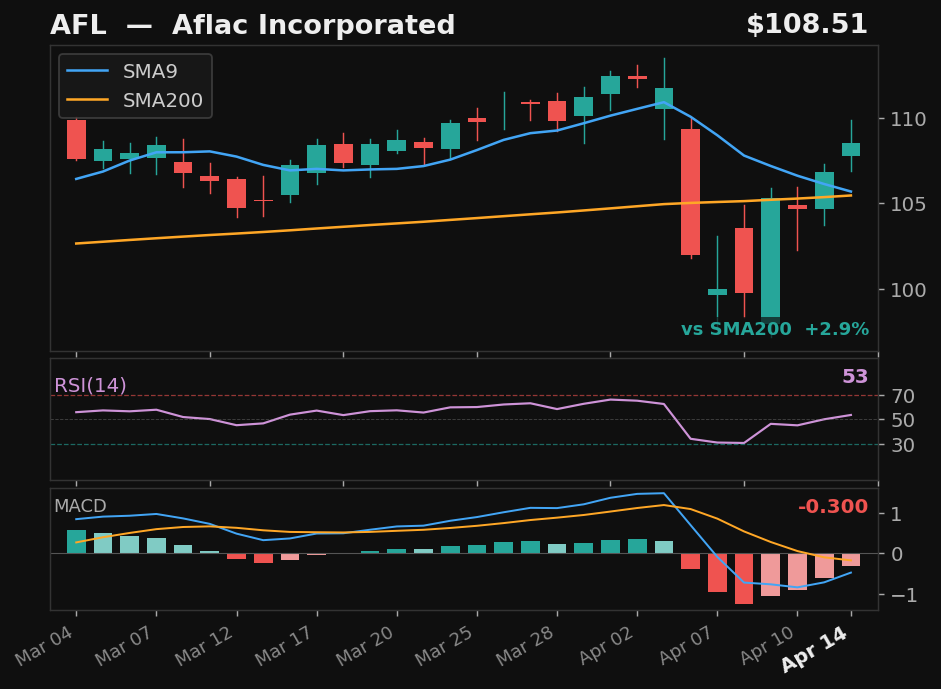
AFL
Aflac Incorporated
NYSE
- 11.1% pullback — 5 days below SMA9
- Prior rally: 13%
- Above SMA200 (3%)
- MACD histogram rising from negative — early momentum signal
ExplosiveUp
Exp Score49Days Below5Pullback%11.1
Returns
StockMktDiff
1D-0.4%-0.3%-0.2%
2D-1.1%-2.5%+1.4%
3D-1.0%-2.4%+1.4%
5D-0.2%-2.2%+2.0%
10D+0.1%+2.8%-2.7%
 click to enlarge
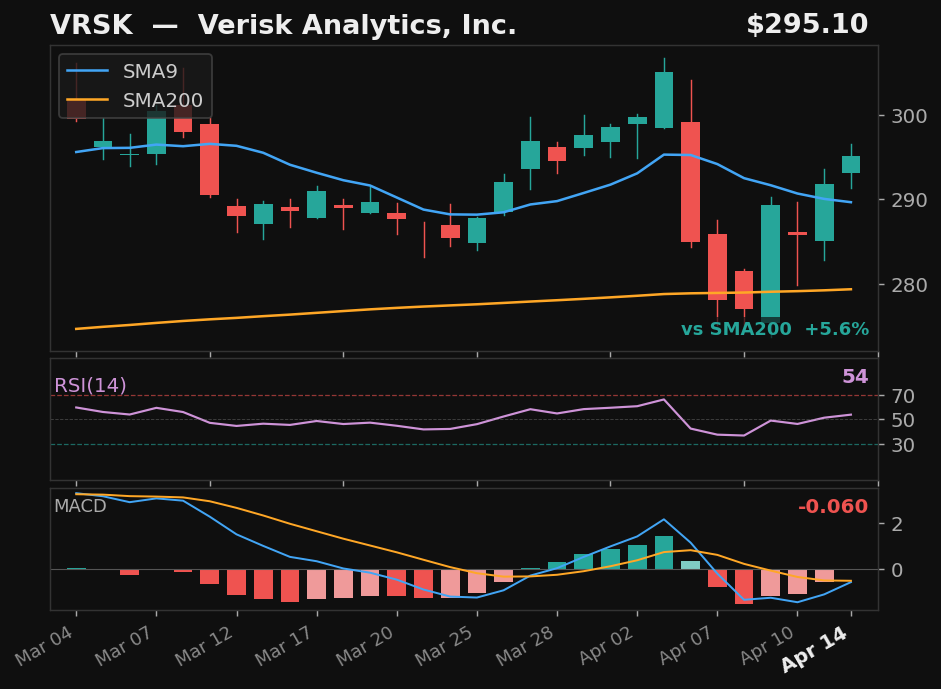
VRSK
Verisk Analytics, Inc.
NASDAQ
- 9.2% pullback — 5 days below SMA9
- Prior rally: 10%
- Above SMA200 (6%)
- MACD histogram rising from negative — early momentum signal
ExplosiveUp
Exp Score49Days Below5Pullback%9.2
Returns
StockMktDiff
1D-0.0%-0.3%+0.3%
2D-1.0%-2.5%+1.5%
3D-0.7%-2.4%+1.7%
5D-0.8%-2.2%+1.4%
10D-0.9%+2.8%-3.7%
 click to enlarge
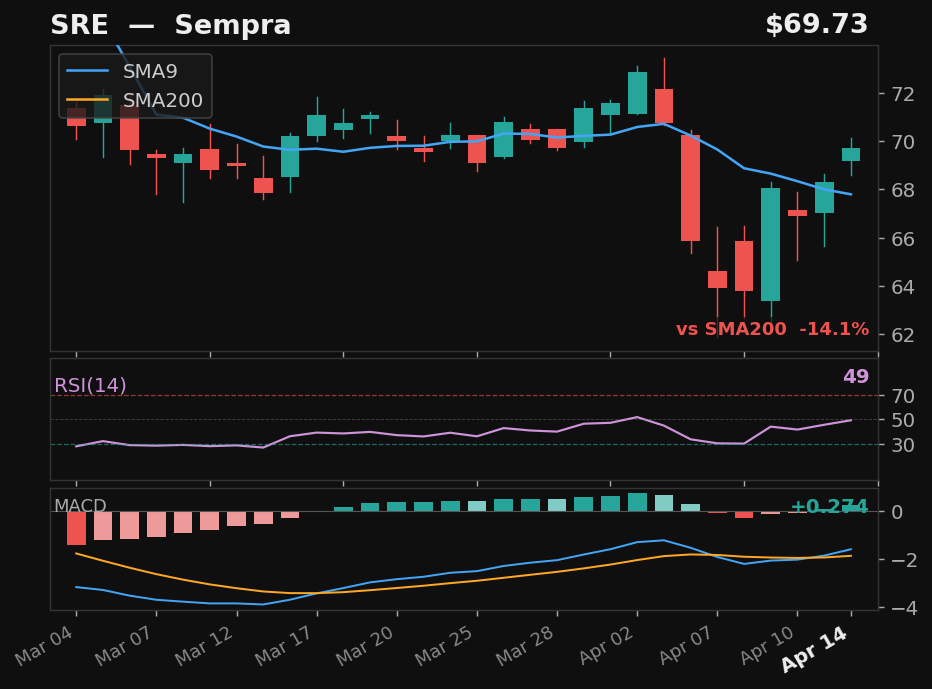
SRE
Sempra
NYSE
- 9.8% pullback — 5 days below SMA9
- Prior rally: 11%
- MACD momentum building
ExplosiveUp
Exp Score48Days Below5Pullback%9.8
Returns
StockMktDiff
1D+0.7%-0.3%+1.0%
2D+0.9%-2.5%+3.4%
3D+2.0%-2.4%+4.4%
5D+3.7%-2.2%+5.9%
10D+8.1%+2.8%+5.2%
 click to enlarge
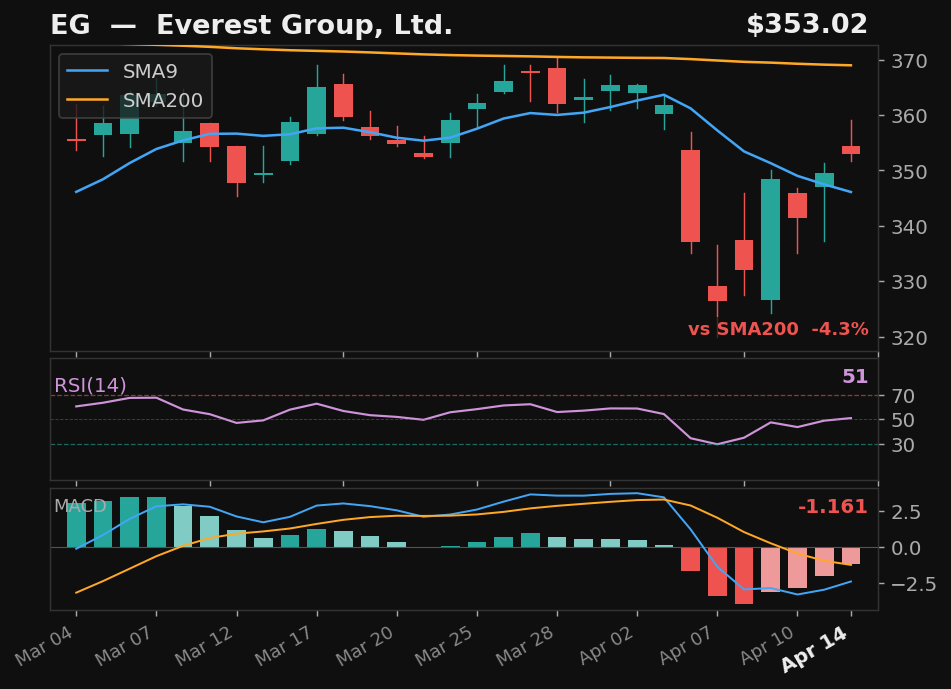
EG
Everest Group, Ltd.
NYSE
- 10.6% pullback — 6 days below SMA9
- Prior rally: 12%
- MACD histogram rising from negative — early momentum signal
ExplosiveUp
Exp Score48Days Below6Pullback%10.6
Returns
StockMktDiff
1D-0.9%-0.3%-0.6%
2D-1.5%-2.5%+1.0%
3D-0.9%-2.4%+1.5%
5D+1.2%-2.2%+3.4%
10D+1.8%+2.8%-1.0%
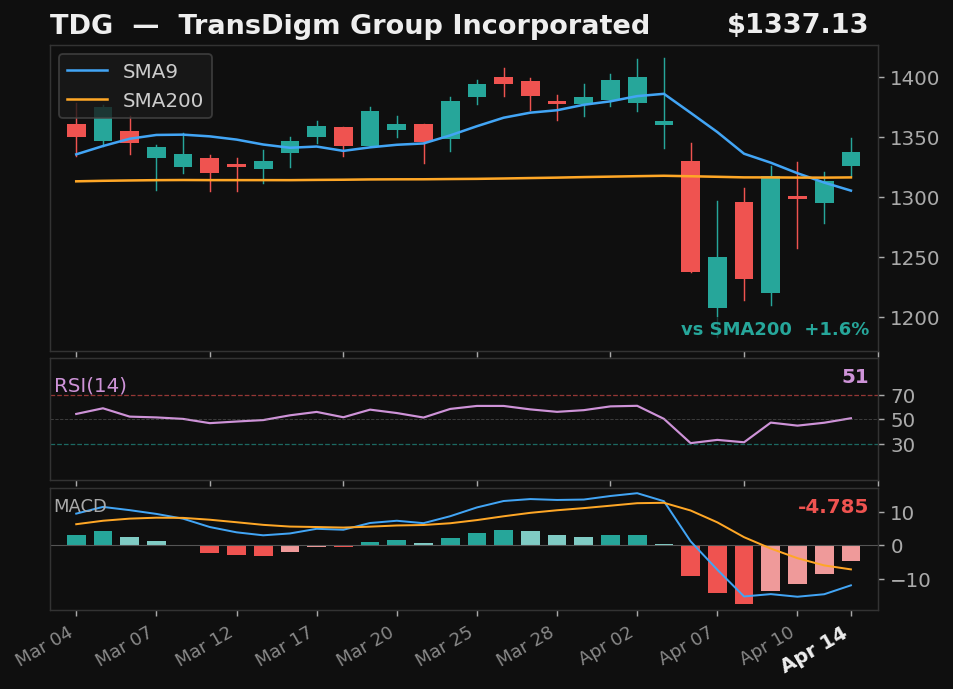 click to enlarge
TDG
TransDigm Group Incorporated
NYSE
- 12.0% pullback — 6 days below SMA9
- Prior rally: 14%
- Above SMA200 (2%)
- MACD histogram rising from negative — early momentum signal
ExplosiveUp
Exp Score47Days Below6Pullback%12.0
Returns
StockMktDiff
1D+1.8%-0.3%+2.1%
2D-0.1%-2.5%+2.4%
3D+0.0%-2.4%+2.4%
5D-2.2%-2.2%+0.0%
10D+5.3%+2.8%+2.5%
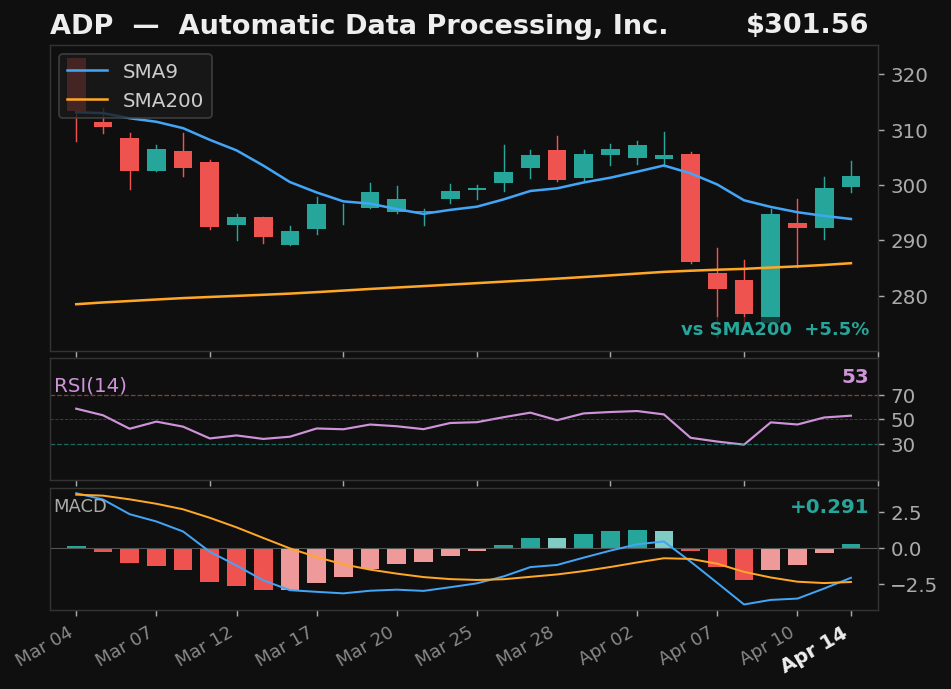 click to enlarge
ADP
Automatic Data Processing, Inc.
NASDAQ
- 9.4% pullback — 5 days below SMA9
- Prior rally: 10%
- Above SMA200 (5%)
- MACD momentum building
ExplosiveUp
Exp Score47Days Below5Pullback%9.4
Returns
StockMktDiff
1D-1.2%-0.3%-0.9%
2D-2.5%-2.5%+0.0%
3D-2.7%-2.4%-0.4%
5D-2.9%-2.2%-0.7%
10D-1.9%+2.8%-4.7%
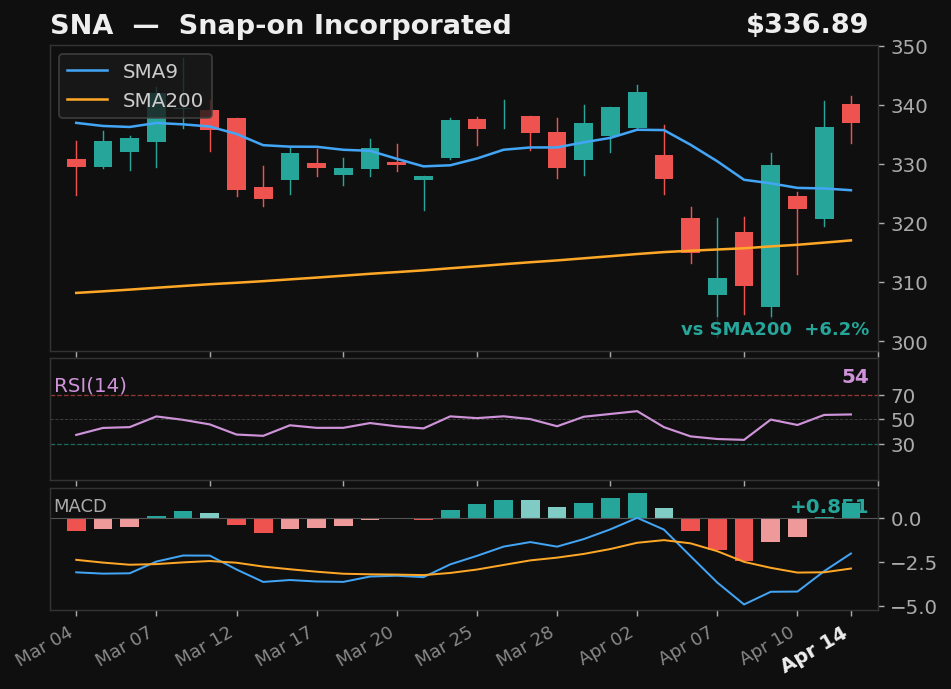 click to enlarge
SNA
Snap-on Incorporated
NYSE
- 9.6% pullback — 5 days below SMA9
- Prior rally: 11%
- Above SMA200 (6%)
- MACD momentum building
ExplosiveUp
Exp Score47Days Below5Pullback%9.6
Returns
StockMktDiff
1D+0.1%-0.3%+0.3%
2D-1.5%-2.5%+1.0%
3D-9.3%-2.4%-7.0%
5D-10.6%-2.2%-8.4%
10D-8.1%+2.8%-10.9%
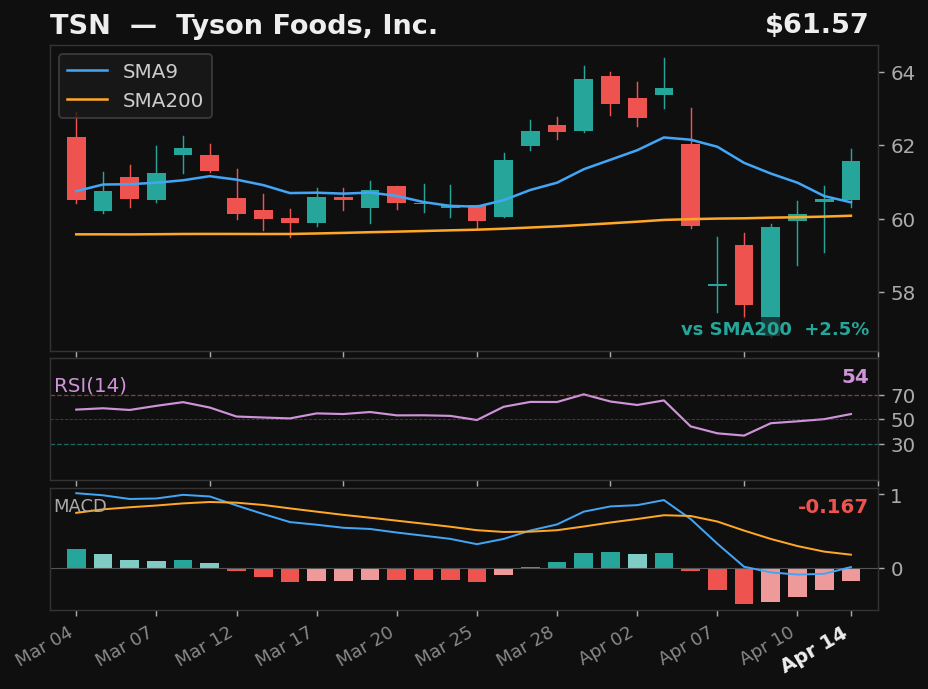 click to enlarge
TSN
Tyson Foods, Inc.
NYSE
- 9.3% pullback — 6 days below SMA9
- Prior rally: 10%
- Above SMA200 (2%)
- MACD histogram rising from negative — early momentum signal
ExplosiveUp
Exp Score47Days Below6Pullback%9.3
Returns
StockMktDiff
1D-0.9%-0.3%-0.7%
2D-1.5%-2.5%+1.0%
3D-0.6%-2.4%+1.8%
5D-0.3%-2.2%+1.9%
10D-1.6%+2.8%-4.4%
 click to enlarge
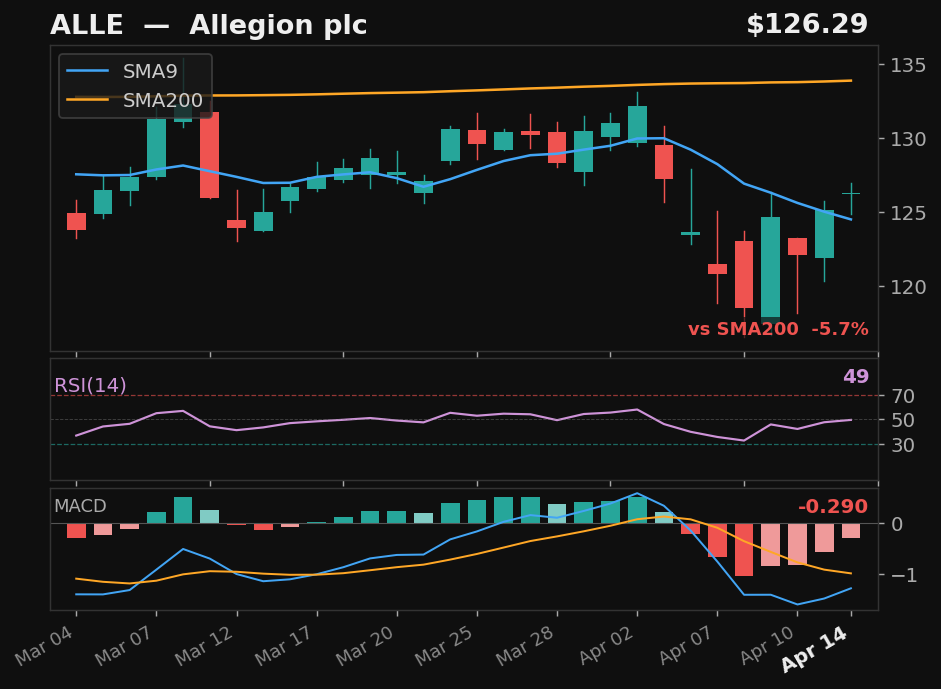
ALLE
Allegion plc
NYSE
- 10.3% pullback — 6 days below SMA9
- Prior rally: 12%
- MACD histogram rising from negative — early momentum signal
ExplosiveUp
Exp Score44Days Below6Pullback%10.3
Returns
StockMktDiff
1D+0.5%-0.3%+0.8%
2D-0.9%-2.5%+1.6%
3D+0.0%-2.4%+2.4%
5D+0.4%-2.2%+2.6%
10D+9.4%+2.8%+6.6%
 click to enlarge
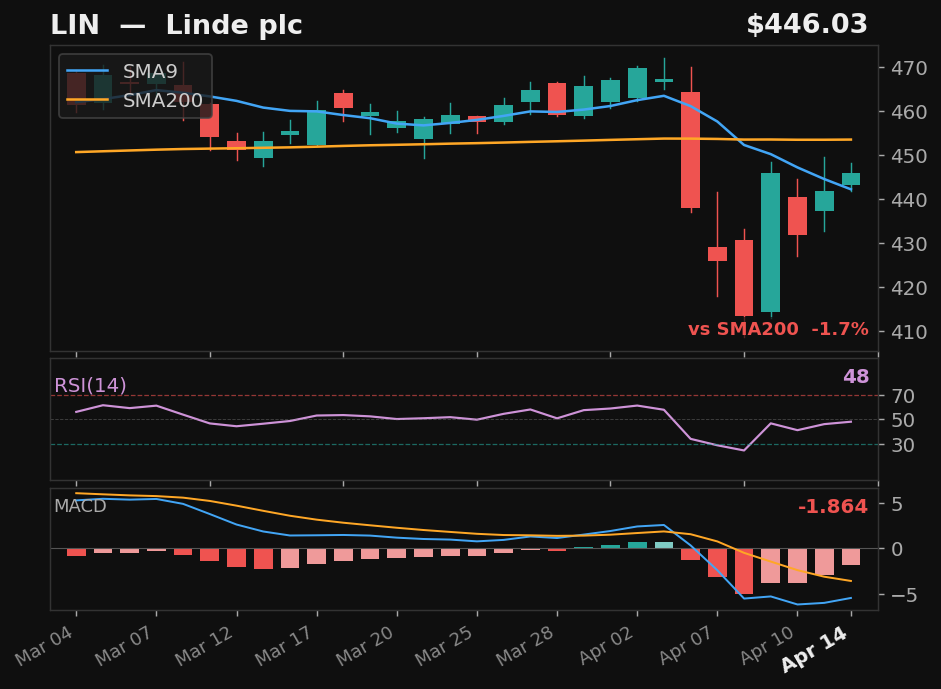
LIN
Linde plc
NASDAQ
- 11.5% pullback — 6 days below SMA9
- Prior rally: 13%
- MACD histogram rising from negative — early momentum signal
ExplosiveUp
Exp Score44Days Below6Pullback%11.5
Returns
StockMktDiff
1D+1.1%-0.3%+1.4%
2D+0.4%-2.5%+2.9%
3D+1.4%-2.4%+3.7%
5D+1.9%-2.2%+4.1%
10D+1.0%+2.8%-1.8%
 click to enlarge
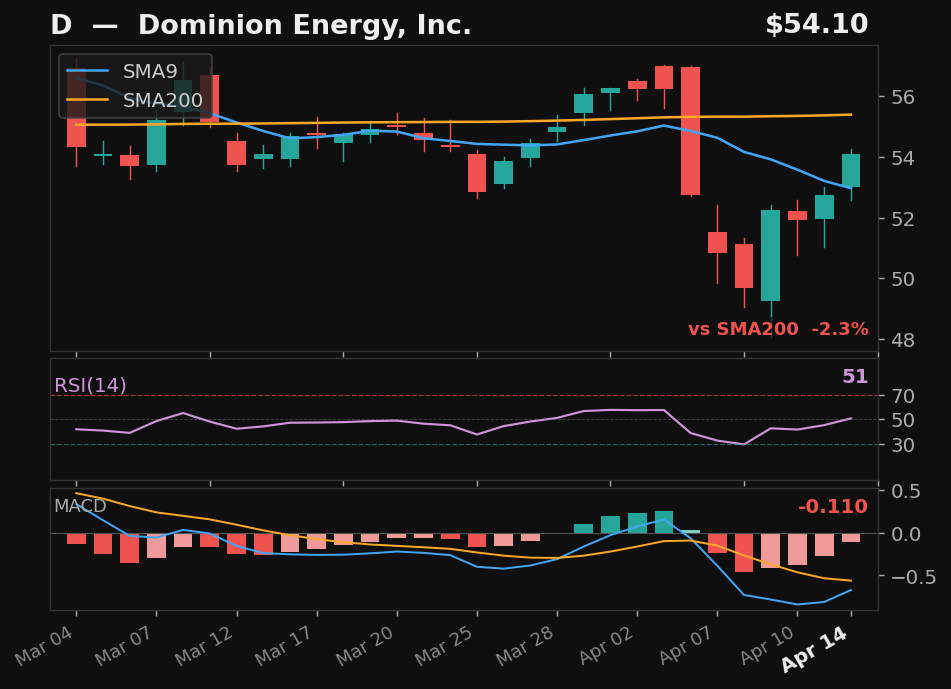
D
Dominion Energy, Inc.
NYSE
- 11.7% pullback — 6 days below SMA9
- Prior rally: 13%
- MACD histogram rising from negative — early momentum signal
ExplosiveUp
Exp Score44Days Below6Pullback%11.7
Returns
StockMktDiff
1D-0.8%-0.3%-0.5%
2D-1.9%-2.5%+0.6%
3D-1.7%-2.4%+0.6%
5D-1.3%-2.2%+0.9%
10D+0.4%+2.8%-2.4%
 click to enlarge
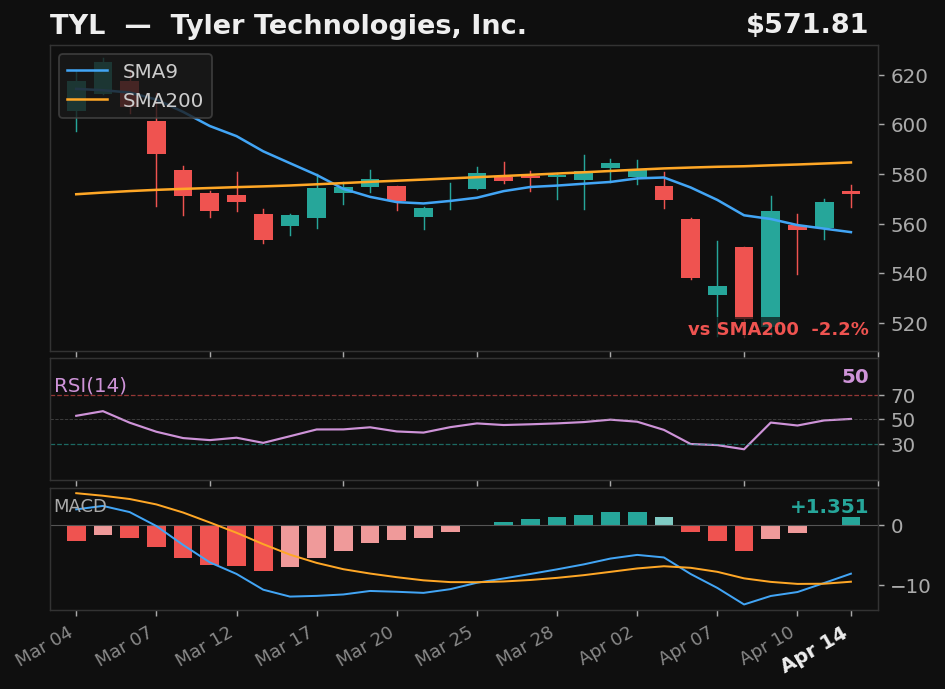
TYL
Tyler Technologies, Inc.
NYSE
- 10.3% pullback — 5 days below SMA9
- Prior rally: 12%
- MACD momentum building
ExplosiveUp
Exp Score44Days Below5Pullback%10.3
Returns
StockMktDiff
1D+1.2%-0.3%+1.4%
2D-0.4%-2.5%+2.1%
3D-0.3%-2.4%+2.1%
5D-1.4%-2.2%+0.8%
10D-6.6%+2.8%-9.4%
 click to enlarge
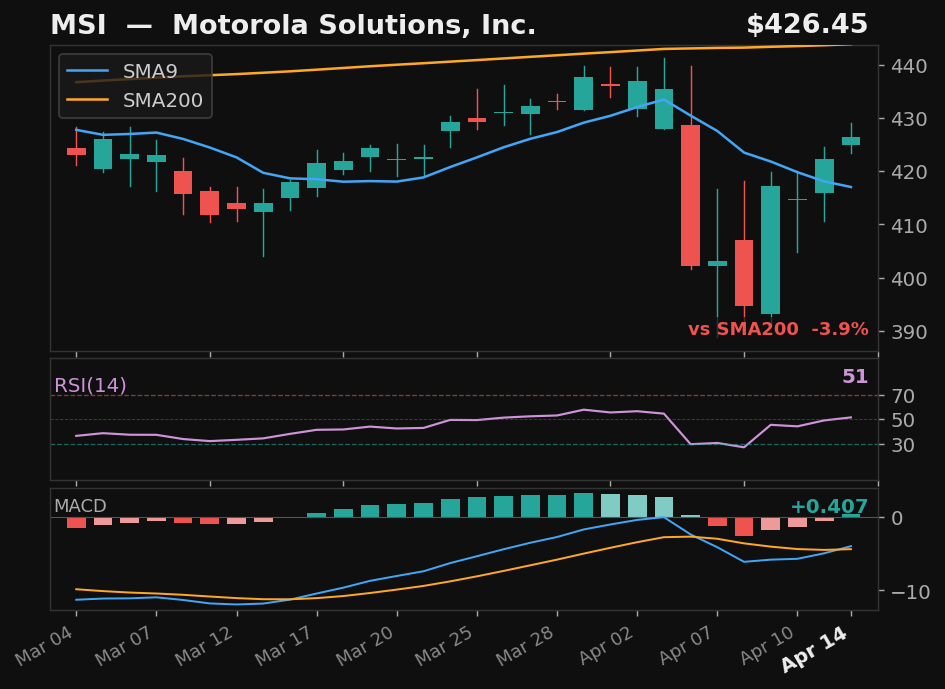
MSI
Motorola Solutions, Inc.
NYSE
- 9.7% pullback — 5 days below SMA9
- Prior rally: 11%
- MACD momentum building
ExplosiveUp
Exp Score41Days Below5Pullback%9.7
Returns
StockMktDiff
1D+1.0%-0.3%+1.3%
2D-1.4%-2.5%+1.1%
3D-1.3%-2.4%+1.1%
5D-1.6%-2.2%+0.6%
10D+2.2%+2.8%-0.6%
 click to enlarge
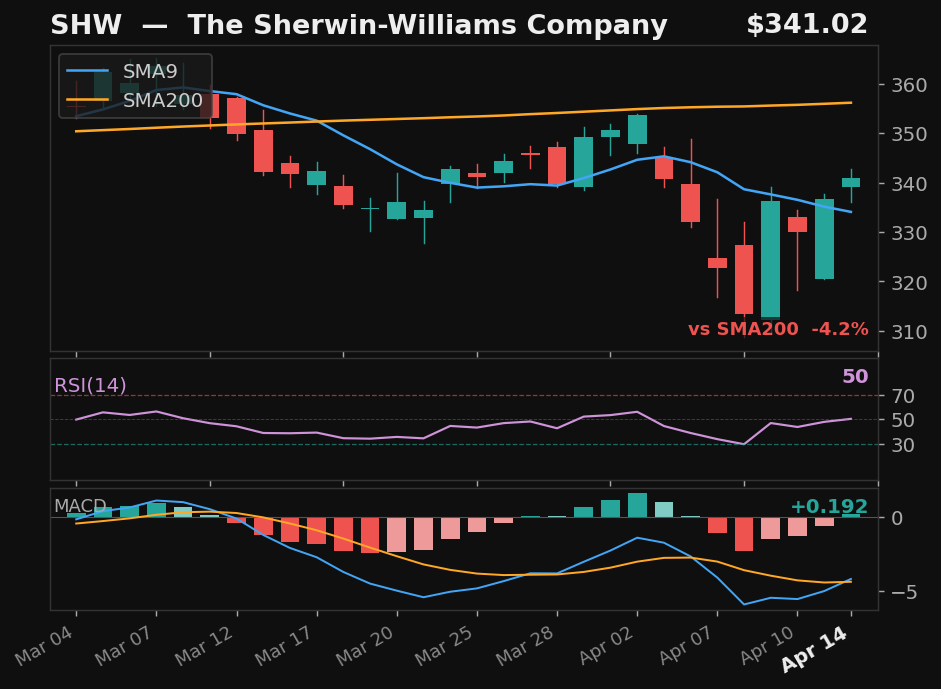
SHW
The Sherwin-Williams Company
NYSE
- 11.4% pullback — 6 days below SMA9
- Prior rally: 13%
- MACD momentum building
ExplosiveUp
Exp Score41Days Below6Pullback%11.4
Returns
StockMktDiff
1D-1.2%-0.3%-0.9%
2D-2.9%-2.5%-0.4%
3D-2.2%-2.4%+0.1%
5D-2.7%-2.2%-0.5%
10D+2.1%+2.8%-0.7%
Empirical3
 click to enlarge
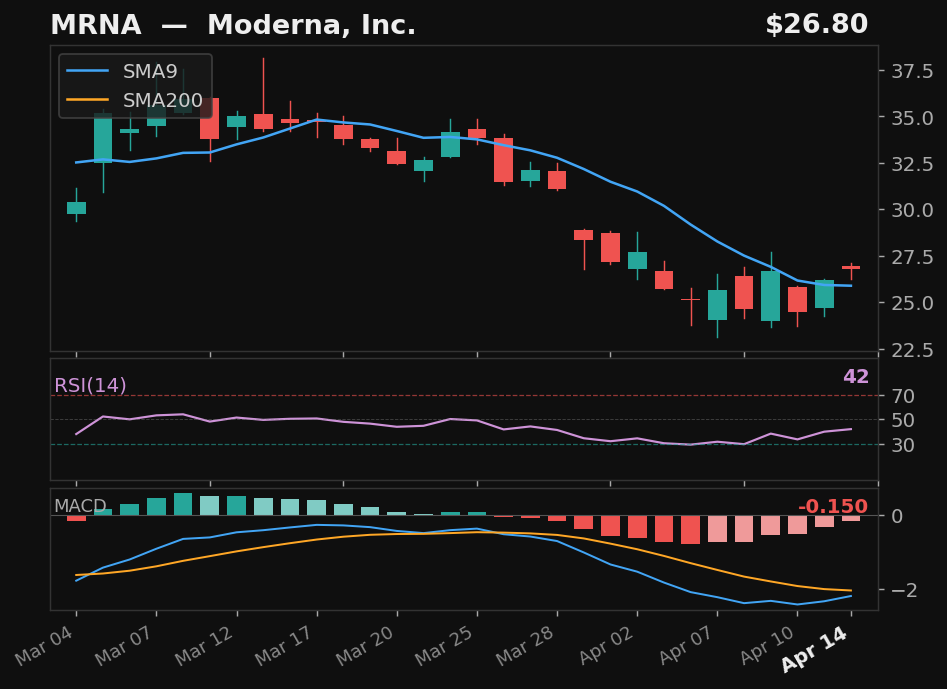
MRNA
Moderna, Inc.
NASDAQ
- 27.6% pullback — full candle body above SMA9
- RSI rising from 42
- MACD histogram rising while still negative — early recovery signal
- 53.6% below SMA200 — extended from trend
Empirical
Emp Score74.3Body Above✓
Returns
StockMktDiff
1D-2.1%-0.3%-1.8%
2D-6.0%-2.5%-3.5%
3D-7.8%-2.4%-5.4%
5D-4.0%-2.2%-1.8%
10D+3.8%+2.8%+1.0%
 click to enlarge
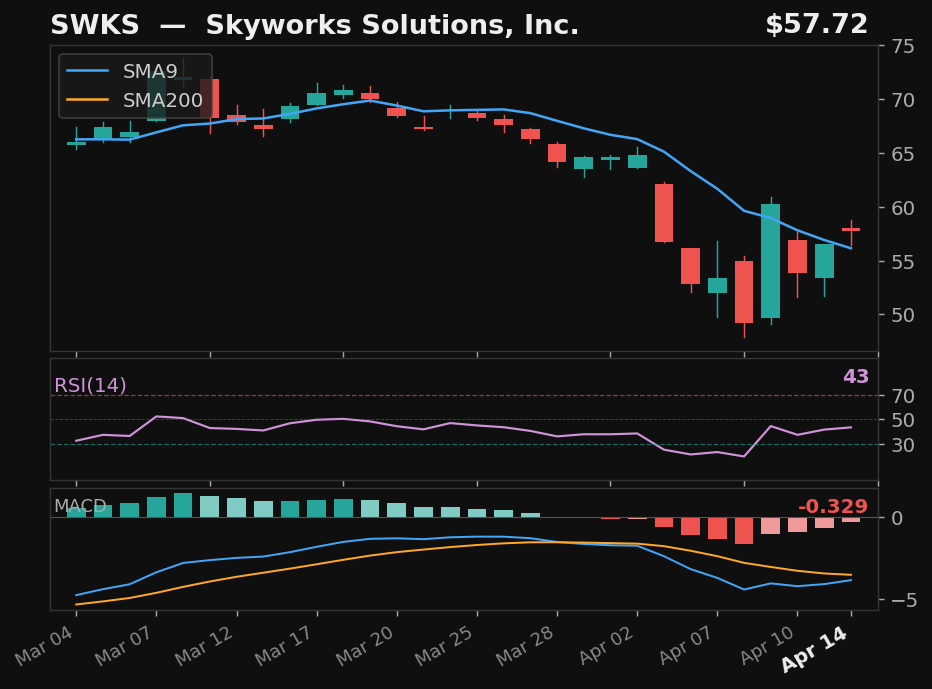
SWKS
Skyworks Solutions, Inc.
NASDAQ
- 29.8% pullback — full candle body above SMA9
- RSI rising from 43
- MACD histogram rising while still negative — early recovery signal
- 35.7% below SMA200 — extended from trend
Empirical
Emp Score73.2Body Above✓
Returns
StockMktDiff
1D-0.6%-0.3%-0.3%
2D-3.2%-2.5%-0.7%
3D-3.0%-2.4%-0.7%
5D+0.1%-2.2%+2.3%
10D+6.7%+2.8%+3.9%
 click to enlarge
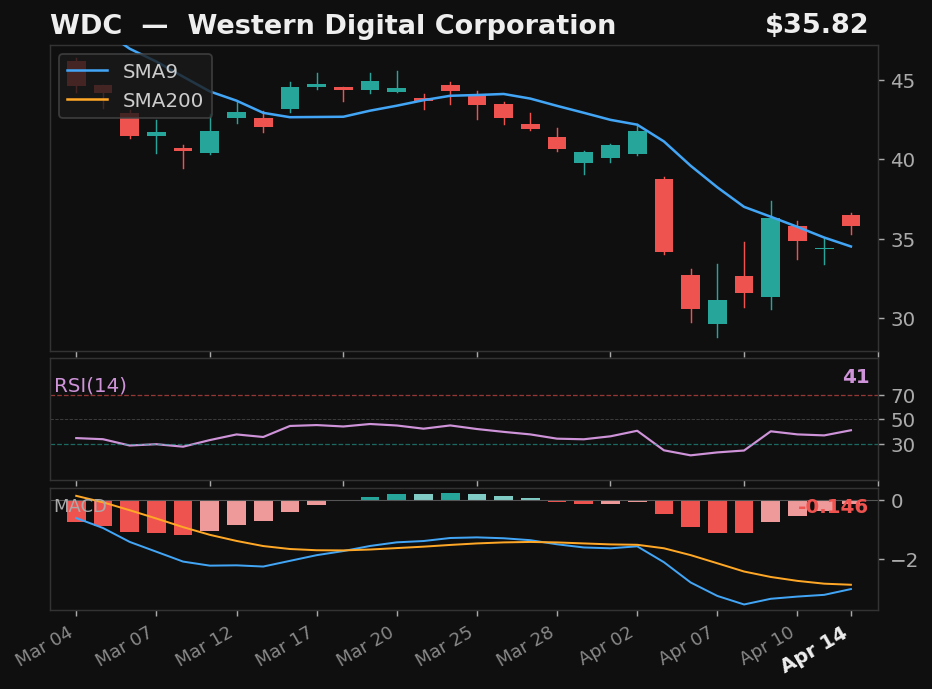
WDC
Western Digital Corporation
NASDAQ
- 31.1% pullback over 14 days — full candle above SMA9
- RSI rising from 41
- MACD histogram rising while still negative — early recovery signal
- 26.6% below SMA200 — extended from trend
Empirical
Emp Score73.1Body Above✓
Returns
StockMktDiff
1D+0.3%-0.3%+0.6%
2D-0.6%-2.5%+1.9%
3D+1.9%-2.4%+4.3%
5D+2.4%-2.2%+4.6%
10D+13.4%+2.8%+10.6%