Tuesday, February 10, 2026 · After Close
Explosive Up Setups6
 click to enlarge
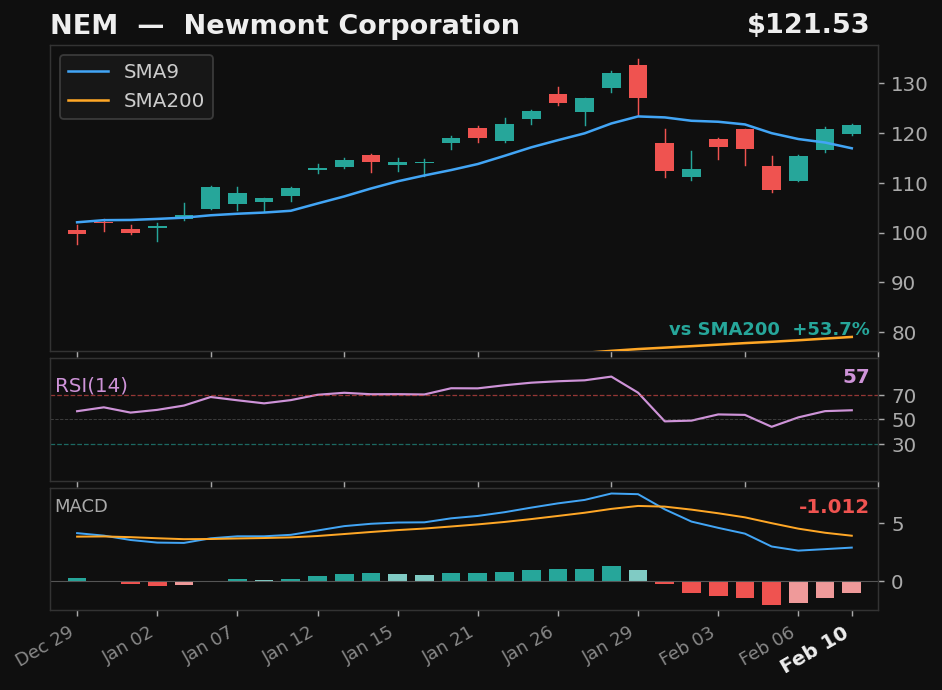
NEM
Newmont Corporation
NYSE
- 14.5% pullback — 6 days below SMA9
- Prior rally: 17%
- 54% above SMA200 — strong structural position
- MACD histogram rising from negative — early momentum signal
ExplosiveUp
Exp Score100Days Below6Pullback%14.5
Returns
StockMktDiff
1D+2.5%-0.0%+2.5%
2D-2.8%-1.6%-1.2%
3D+3.5%-1.5%+5.0%
5D+2.6%-0.8%+3.4%
10D+2.7%+0.1%+2.6%
 click to enlarge
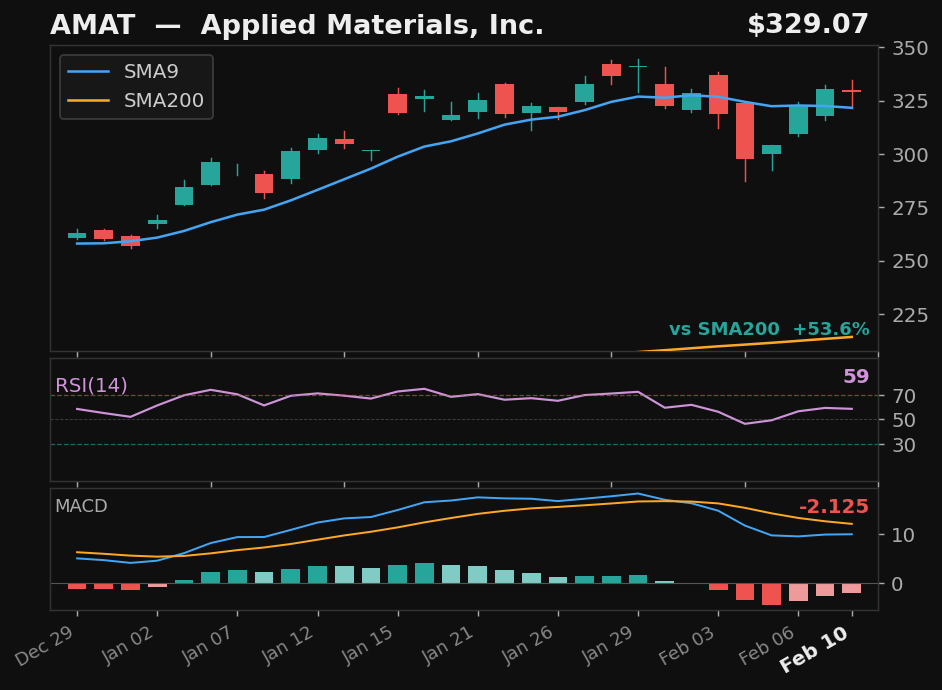
AMAT
Applied Materials, Inc.
NASDAQ
- 12.8% pullback — 5 days below SMA9
- Prior rally: 15%
- 54% above SMA200 — strong structural position
- MACD histogram rising from negative — early momentum signal
ExplosiveUp
Exp Score97Days Below5Pullback%12.8
Returns
StockMktDiff
1D+3.3%-0.0%+3.3%
2D-0.2%-1.6%+1.4%
3D+7.9%-1.5%+9.4%
5D+12.2%-0.8%+13.1%
10D+20.0%+0.1%+19.9%
 click to enlarge
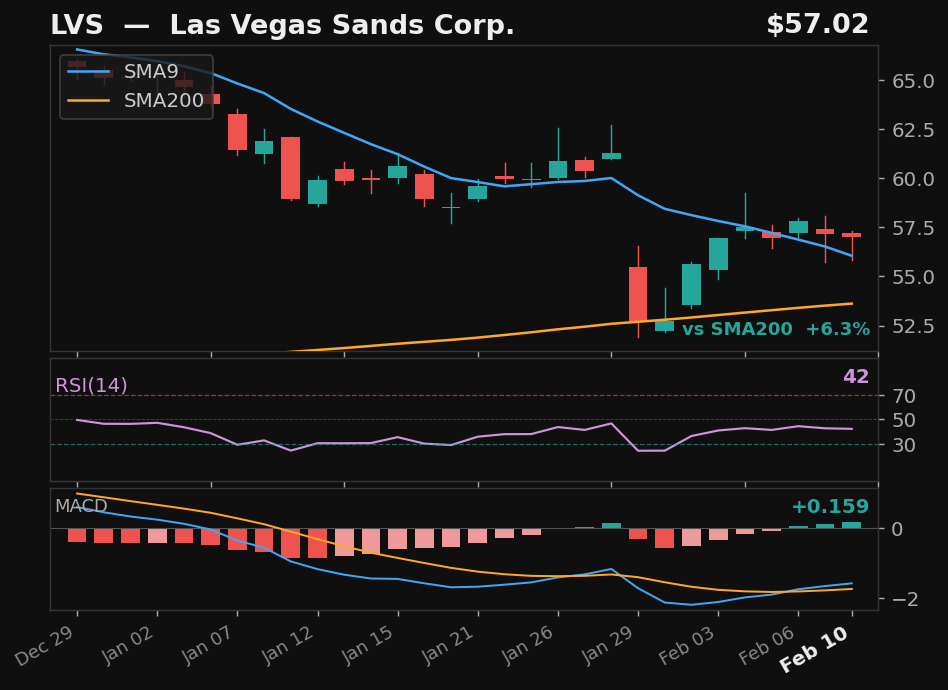
LVS
Las Vegas Sands Corp.
NYSE
- 14.0% pullback — 6 days below SMA9
- Prior rally: 16%
- Above SMA200 (6%)
- MACD momentum building
ExplosiveUp
Exp Score70Days Below6Pullback%14.0
Returns
StockMktDiff
1D+1.2%-0.0%+1.2%
2D-0.3%-1.6%+1.2%
3D+0.2%-1.5%+1.7%
5D+3.2%-0.8%+4.0%
10D-3.4%+0.1%-3.6%
 click to enlarge
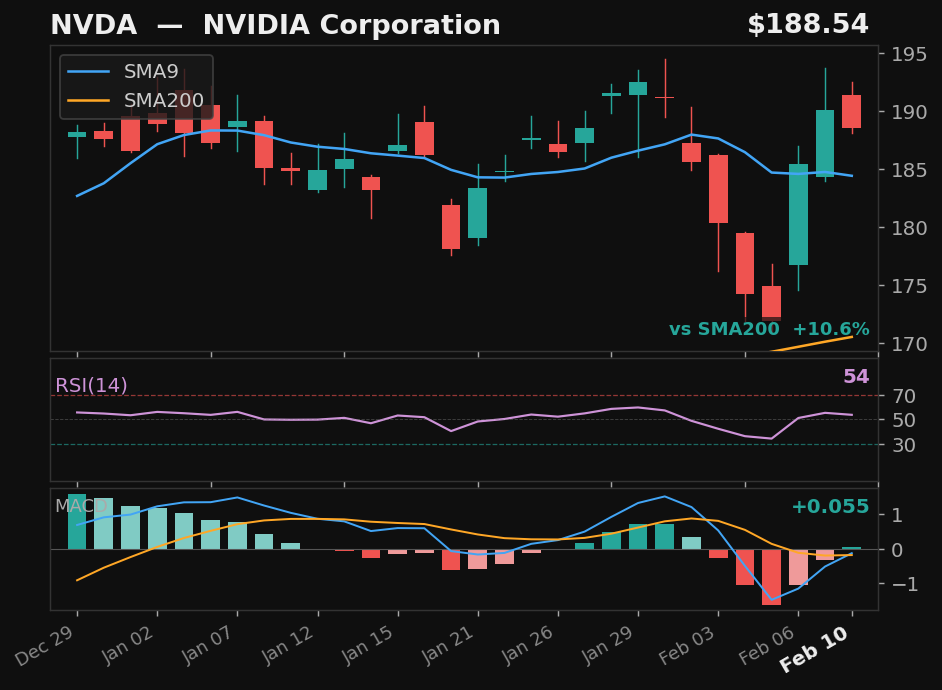
NVDA
NVIDIA Corporation
NASDAQ
- 10.1% pullback — 4 days below SMA9
- Prior rally: 11%
- Above SMA200 (11%)
- MACD momentum building
ExplosiveUp
Exp Score55Days Below4Pullback%10.1
Returns
StockMktDiff
1D+0.8%-0.0%+0.8%
2D-0.8%-1.6%+0.7%
3D-3.0%-1.5%-1.5%
5D-0.3%-0.8%+0.5%
10D+3.7%+0.1%+3.6%
 click to enlarge
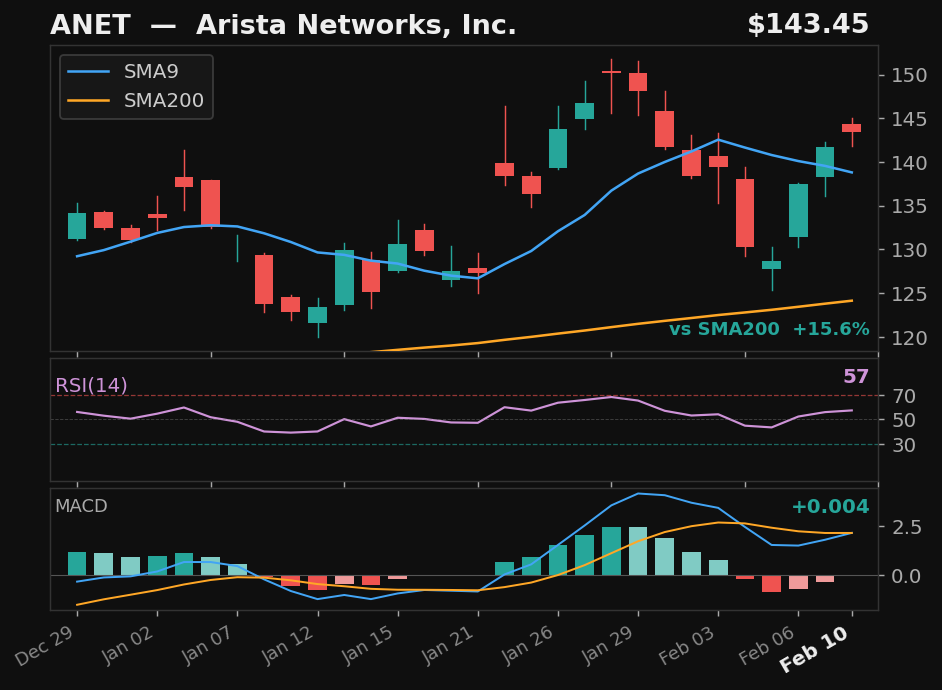
ANET
Arista Networks, Inc.
NYSE
- 9.2% pullback — 5 days below SMA9
- Prior rally: 10%
- Above SMA200 (16%)
- MACD momentum building
ExplosiveUp
Exp Score50Days Below5Pullback%9.2
Returns
StockMktDiff
1D-1.9%-0.0%-1.9%
2D-5.8%-1.6%-4.2%
3D-1.3%-1.5%+0.2%
5D-2.7%-0.8%-1.9%
10D-7.4%+0.1%-7.5%
 click to enlarge
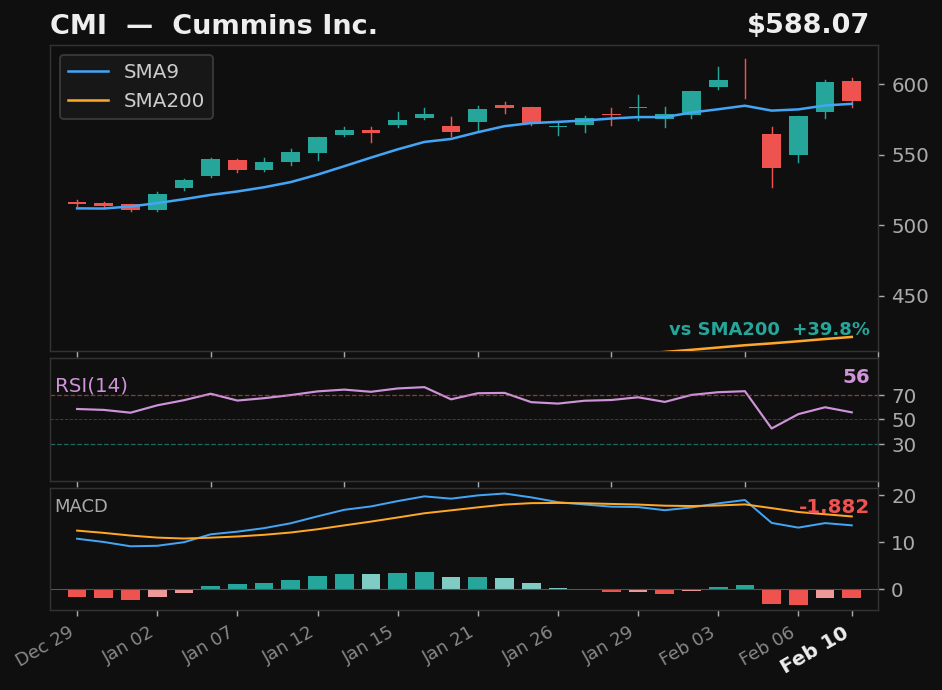
CMI
Cummins Inc.
NYSE
- 10.7% pullback — 2 days below SMA9
- Prior rally: 12%
- 40% above SMA200 — strong structural position
ExplosiveUp
Exp Score45Days Below2Pullback%10.7
Returns
StockMktDiff
1D+1.8%-0.0%+1.9%
2D+0.1%-1.6%+1.7%
3D+2.2%-1.5%+3.7%
5D+0.8%-0.8%+1.7%
10D+1.1%+0.1%+0.9%
Empirical3
 click to enlarge
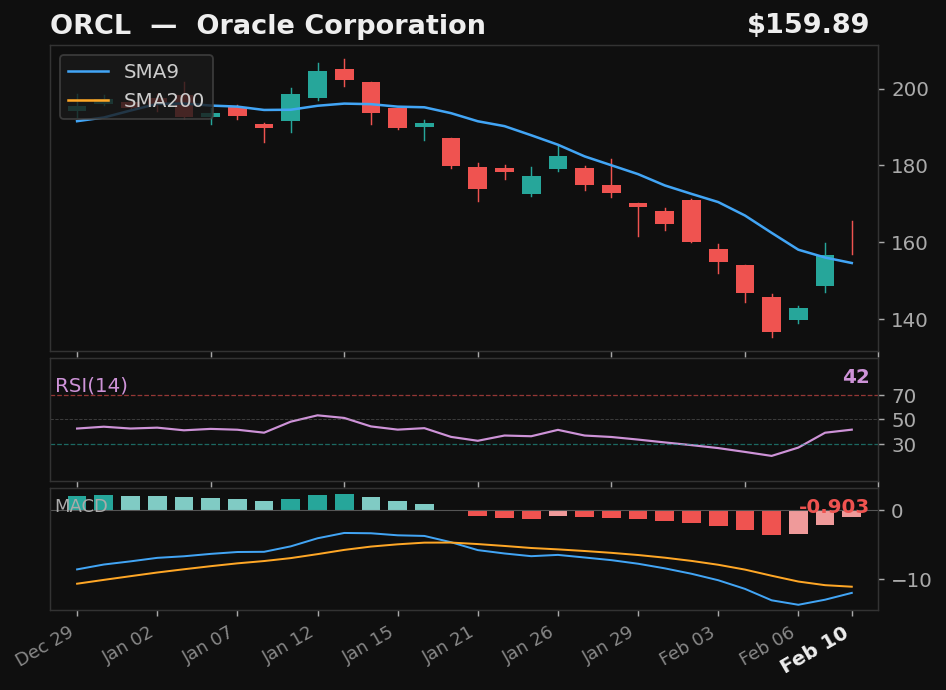
ORCL
Oracle Corporation
NYSE
- 32.5% pullback — full candle body above SMA9
- RSI rising from 42
- MACD histogram rising while still negative — early recovery signal
- 27.4% below SMA200 — extended from trend
Empirical
Emp Score76.3Body Above✓
Returns
StockMktDiff
1D-1.7%-0.0%-1.7%
2D-2.1%-1.6%-0.6%
3D+0.2%-1.5%+1.7%
5D-2.3%-0.8%-1.5%
10D-7.5%+0.1%-7.7%
 click to enlarge
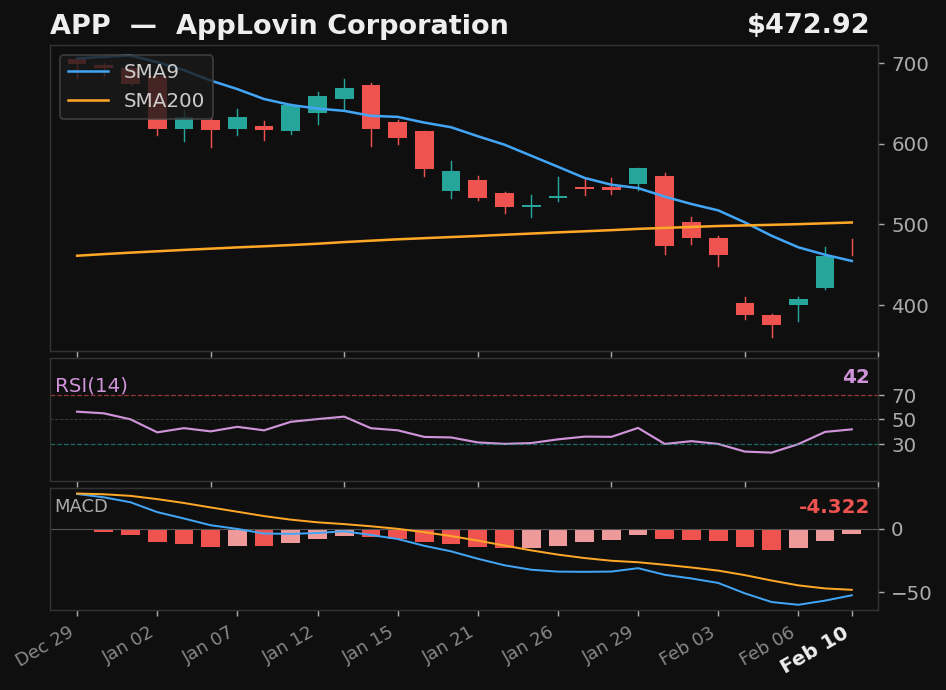
APP
AppLovin Corporation
NASDAQ
- 34.1% pullback over 7 days — full candle above SMA9
- RSI rising from 42
- MACD histogram rising while still negative — early recovery signal
- 5.8% below SMA200 — extended from trend
Empirical
Emp Score72.9Body Above✓
Returns
StockMktDiff
1D-3.4%-0.0%-3.4%
2D-22.4%-1.6%-20.8%
3D-17.4%-1.5%-15.9%
5D-14.5%-0.8%-13.6%
10D-10.8%+0.1%-11.0%
 click to enlarge
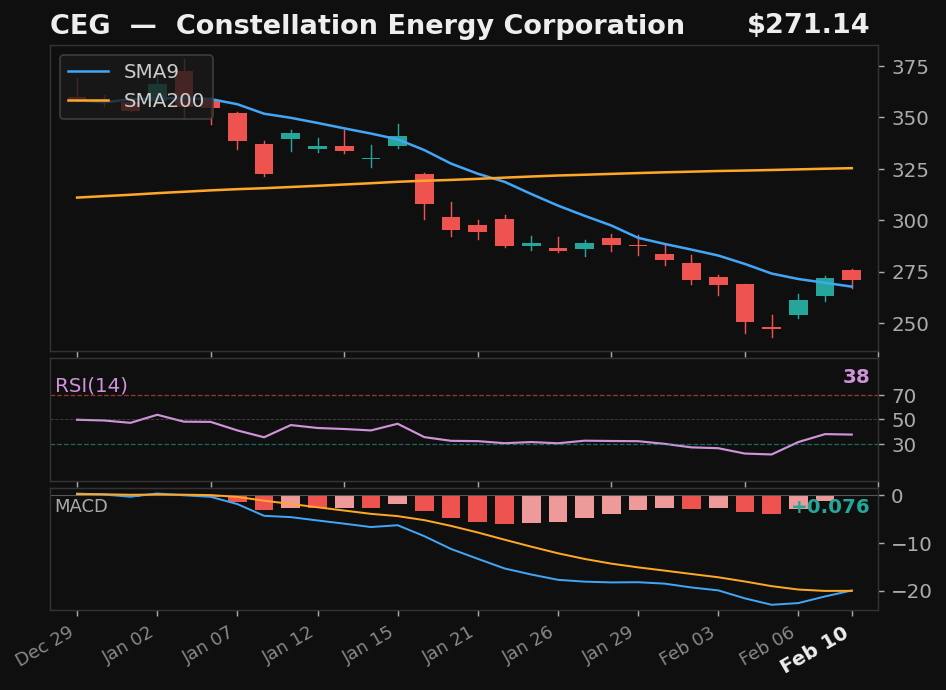
CEG
Constellation Energy Corporation
NASDAQ
- 32.5% pullback — full candle body above SMA9
- 16.7% below SMA200 — extended from trend
Empirical
Emp Score70.1Body Above✓
Returns
StockMktDiff
1D+2.1%-0.0%+2.1%
2D+1.8%-1.6%+3.4%
3D+6.4%-1.5%+7.9%
5D+8.4%-0.8%+9.3%
10D+20.2%+0.1%+20.0%