Tuesday, March 31, 2026 · After Close
SwingTrader Setups
10 candidates
 click to enlarge
DLR
Digital Realty Trust, Inc.
NYSE
- 3.9% pullback to SMA9 over 9 days
- Crossed back above SMA9 today
- RSI at 57, rising
- MACD histogram improving
Base✓Strict✓Score84.0
Returns
StockMktDiff
1D———
2D———
3D———
5D———
10D———
results pending next close
 click to enlarge
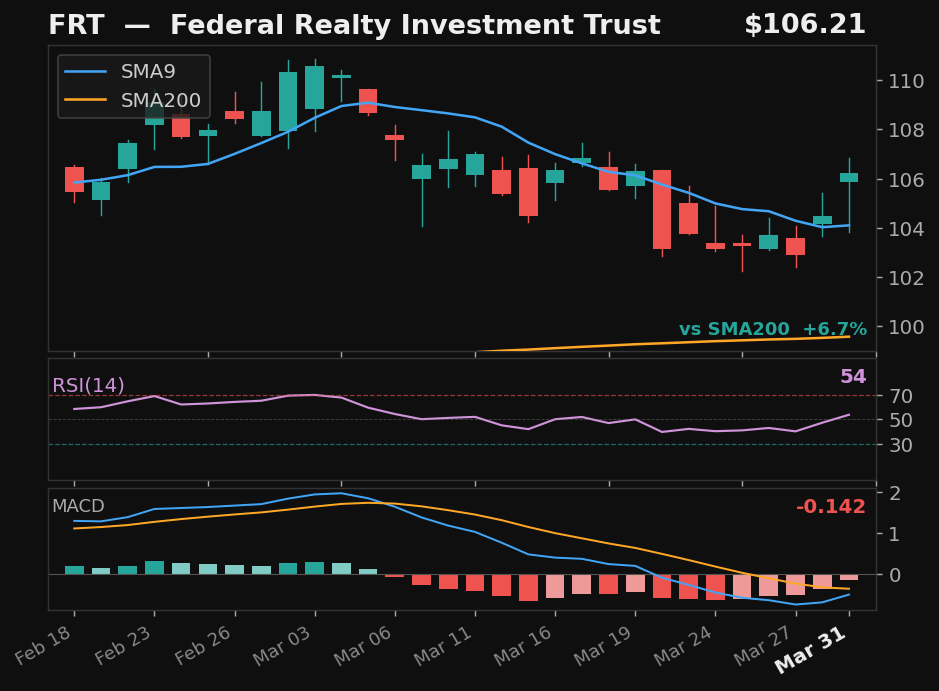
FRT
Federal Realty Investment Trust
NYSE
- 3.7% pullback to SMA9
- Crossed above SMA9 — 2 days above
- RSI at 53, rising
- MACD histogram improving
Base✓Strict✓Score84.0
Returns
StockMktDiff
1D———
2D———
3D———
5D———
10D———
results pending next close
 click to enlarge
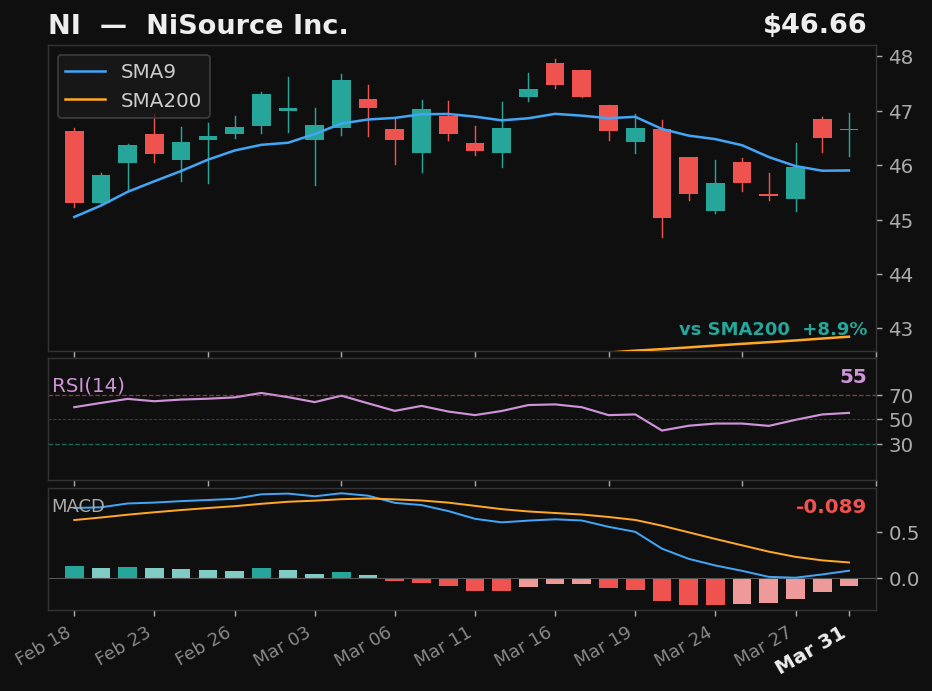
NI
NiSource Inc.
NYSE
- 4.7% pullback to SMA9
- Crossed above SMA9 — 2 days above
- RSI at 55, rising
- MACD histogram improving
Base✓Strict✓Score84.0
Returns
StockMktDiff
1D———
2D———
3D———
5D———
10D———
results pending next close
 click to enlarge
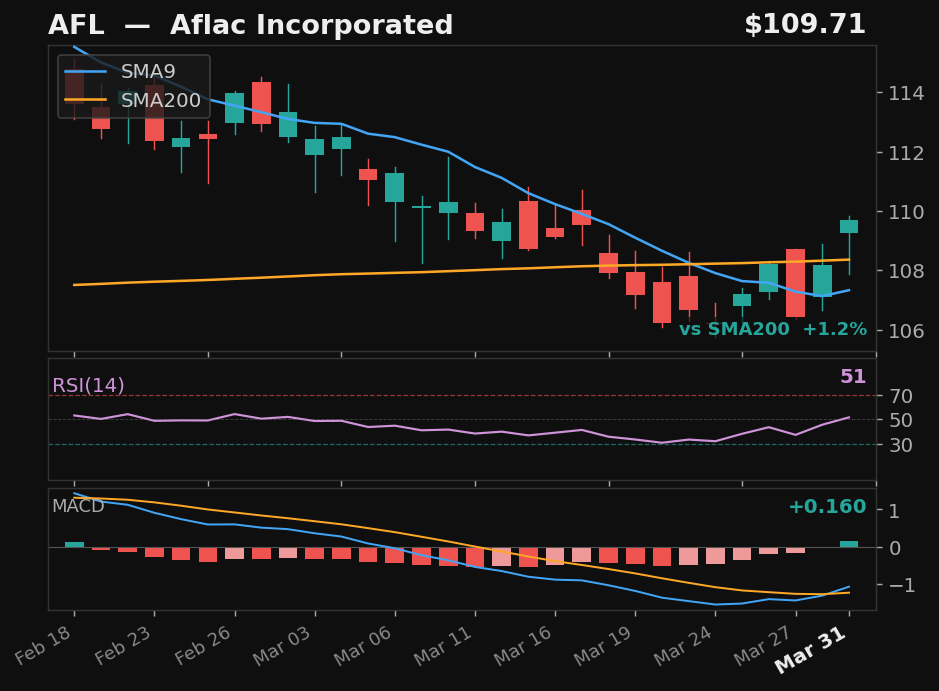
AFL
Aflac Incorporated
NYSE
- 8.4% pullback to SMA9
- Crossed above SMA9 — 2 days above
- RSI at 52, rising
- MACD histogram improving
Base✓Strict✓Score82.0
Returns
StockMktDiff
1D———
2D———
3D———
5D———
10D———
results pending next close
 click to enlarge
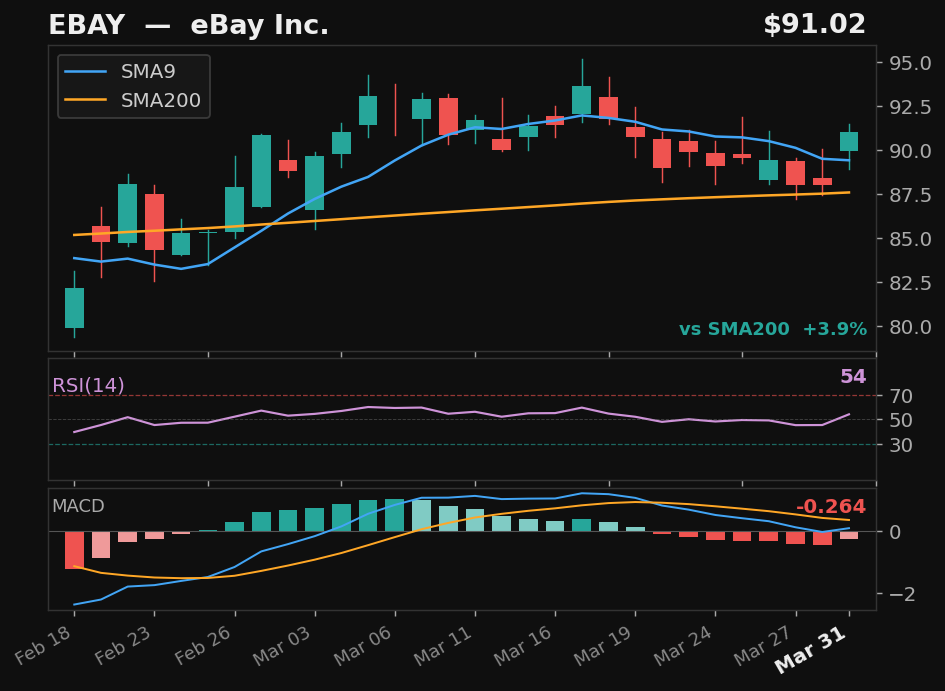
EBAY
eBay Inc.
NASDAQ
- 6.0% pullback to SMA9 over 9 days
- Crossed back above SMA9 today
- RSI at 53, rising
- MACD histogram improving
Base✓Strict✓Score81.0
Returns
StockMktDiff
1D———
2D———
3D———
5D———
10D———
results pending next close
 click to enlarge
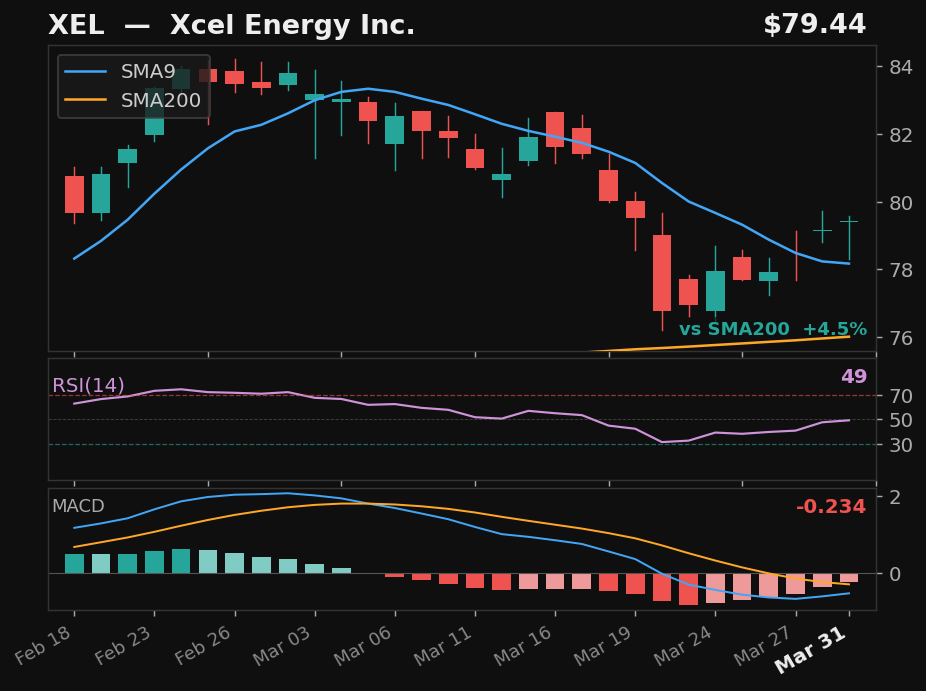
XEL
Xcel Energy Inc.
NASDAQ
- 7.7% pullback to SMA9
- Crossed above SMA9 — 2 days above
- RSI at 49, rising
- MACD histogram improving
Base✓Strict✓Score77.0
Returns
StockMktDiff
1D———
2D———
3D———
5D———
10D———
results pending next close
 click to enlarge
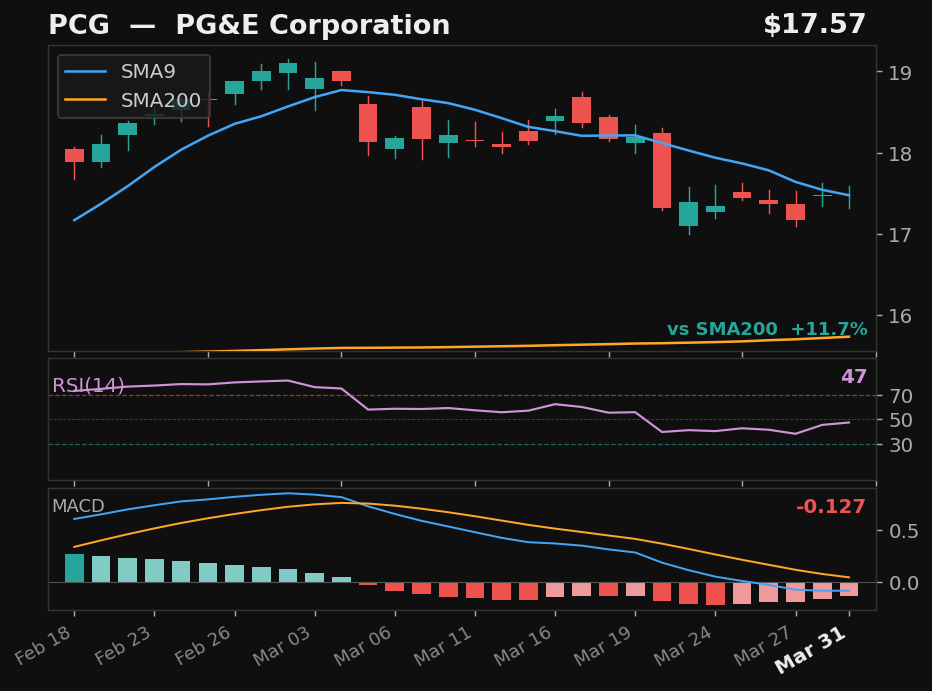
PCG
PG&E Corporation
NYSE
- 6.5% pullback to SMA9 over 9 days
- Crossed back above SMA9 today
- RSI at 47, rising
- MACD histogram improving
Base✓Strict✓Score76.0
Returns
StockMktDiff
1D———
2D———
3D———
5D———
10D———
results pending next close
 click to enlarge
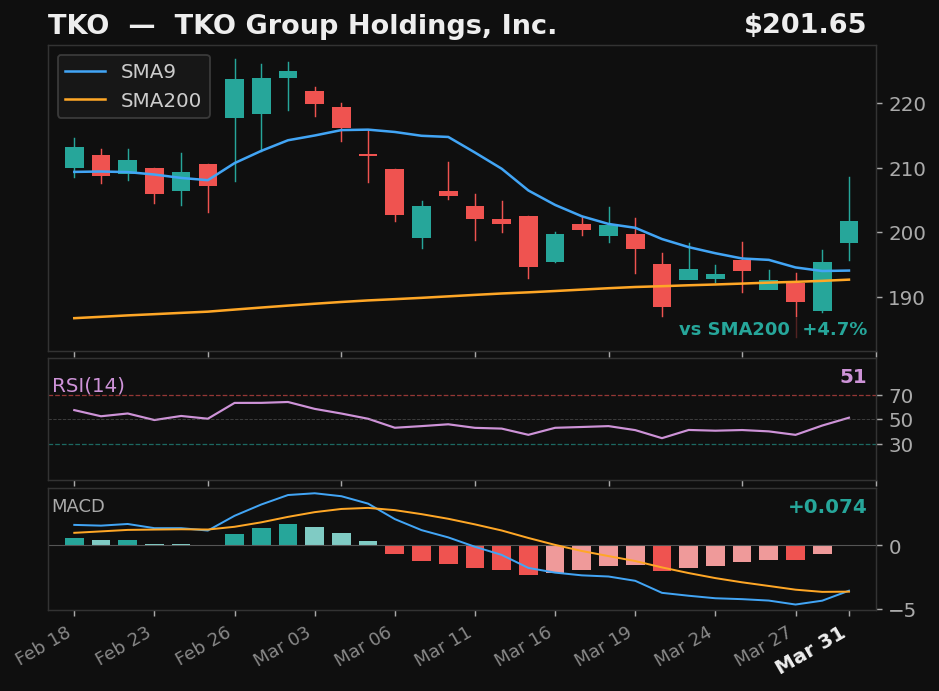
TKO
TKO Group Holdings, Inc.
NYSE
- 12.9% pullback to SMA9
- Crossed above SMA9 — 2 days above
- RSI at 51, rising
- MACD histogram improving
Base✓Strict✓Score76.0
Returns
StockMktDiff
1D———
2D———
3D———
5D———
10D———
results pending next close
 click to enlarge
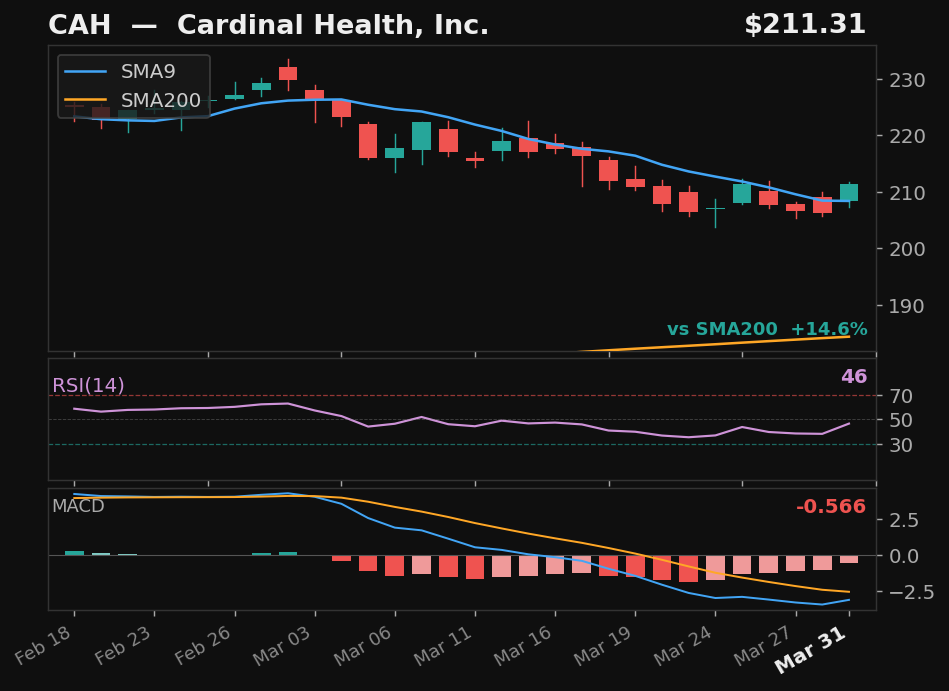
CAH
Cardinal Health, Inc.
NYSE
- 8.9% pullback to SMA9 over 19 days
- Crossed back above SMA9 today
- RSI at 46, rising
- MACD histogram improving
Base✓Strict✓Score75.0
Returns
StockMktDiff
1D———
2D———
3D———
5D———
10D———
results pending next close
 click to enlarge
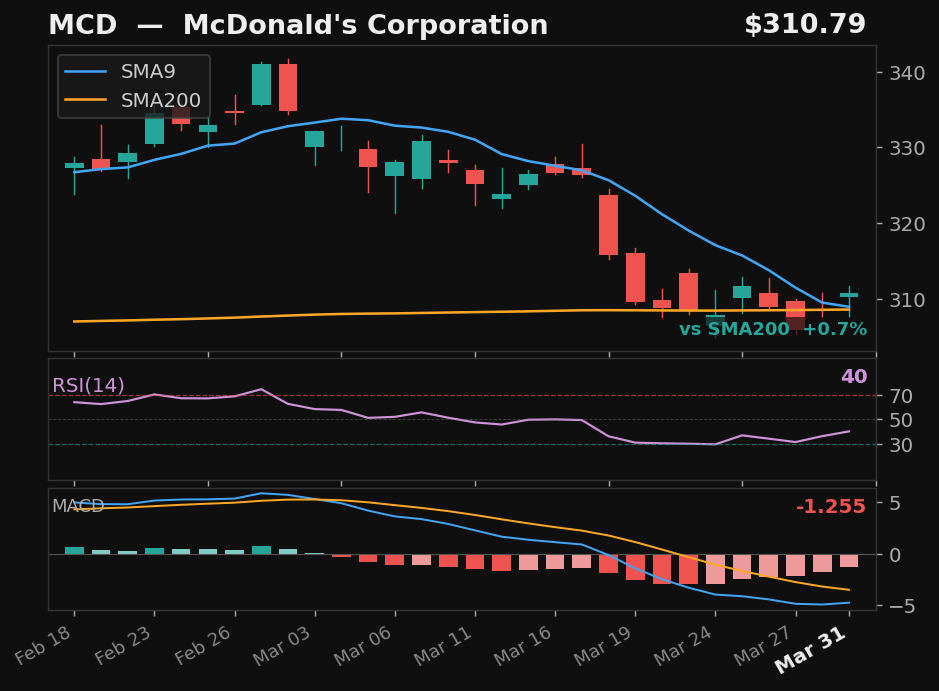
MCD
McDonald's Corporation
NYSE
- 8.6% pullback to SMA9 over 20 days
- Crossed back above SMA9 today
- RSI rising from 40 — recovering momentum
- MACD histogram improving
Base✓Strict✓Score74.0
Returns
StockMktDiff
1D———
2D———
3D———
5D———
10D———
results pending next close
Alternative Setups
3 candidates · ranked by Empirical Score
 click to enlarge
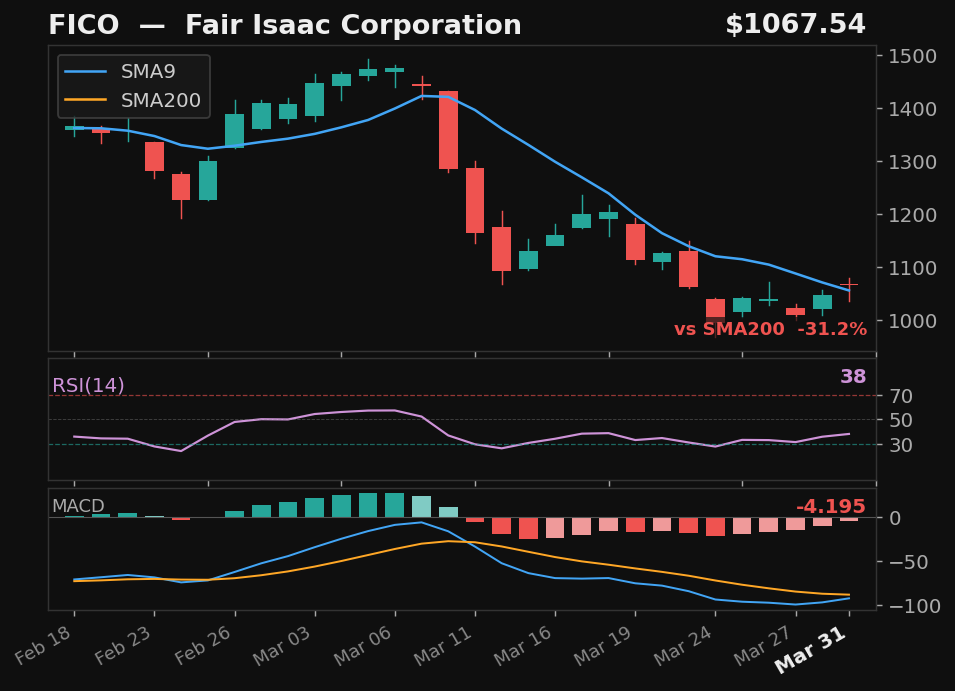
FICO
Fair Isaac Corporation
NYSE
- 31.0% pullback over 15 days — full candle above SMA9
- RSI rising from 38
- MACD histogram rising while still negative — early recovery signal
- 31.2% below SMA200 — extended from trend
Emp Score74.3Body Above✓
Returns
StockMktDiff
1D———
2D———
3D———
5D———
10D———
results pending next close
 click to enlarge
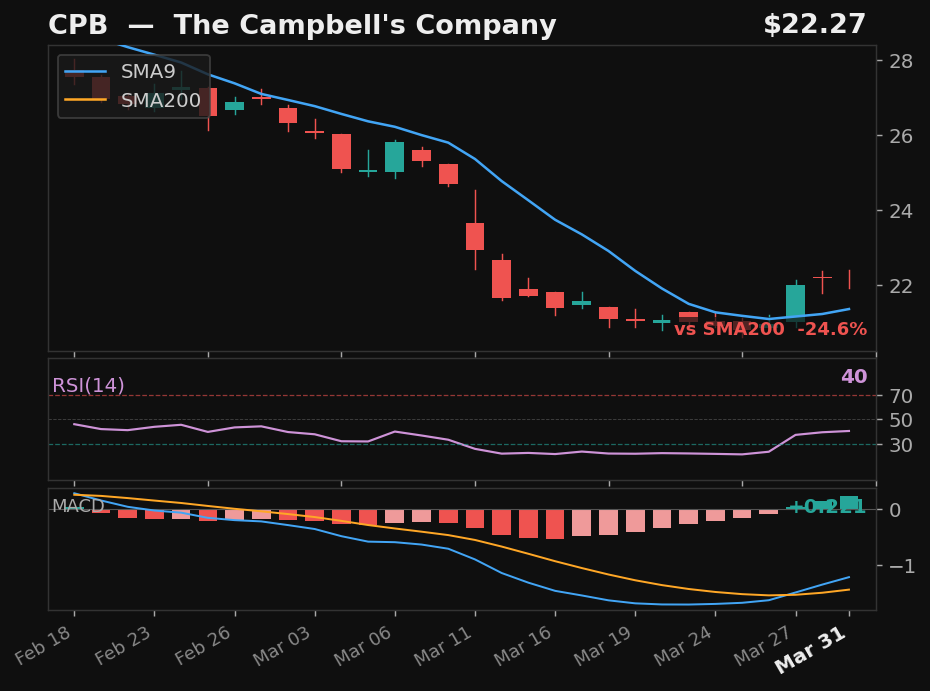
CPB
The Campbell's Company
NASDAQ
- 29.4% pullback — full candle body above SMA9
- RSI rising from 41
- MACD bullish cross 2 days ago
- 24.6% below SMA200 — extended from trend
Emp Score66.2Body Above✓
Returns
StockMktDiff
1D———
2D———
3D———
5D———
10D———
results pending next close
 click to enlarge
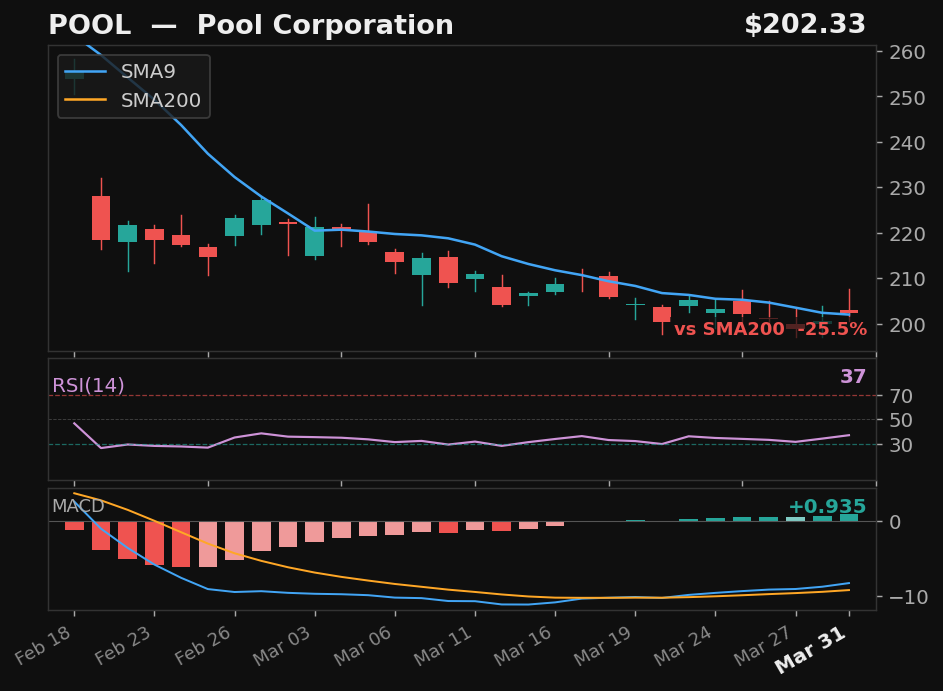
POOL
Pool Corporation
NASDAQ
- 25.2% pullback over 9 days — full candle above SMA9
- RSI rising from 36
- 25.5% below SMA200 — extended from trend
Emp Score58.1Body Above✓
Returns
StockMktDiff
1D———
2D———
3D———
5D———
10D———
results pending next close