Tuesday, April 21, 2026 · After Close
★ Highlights
3
▼
 click to enlarge
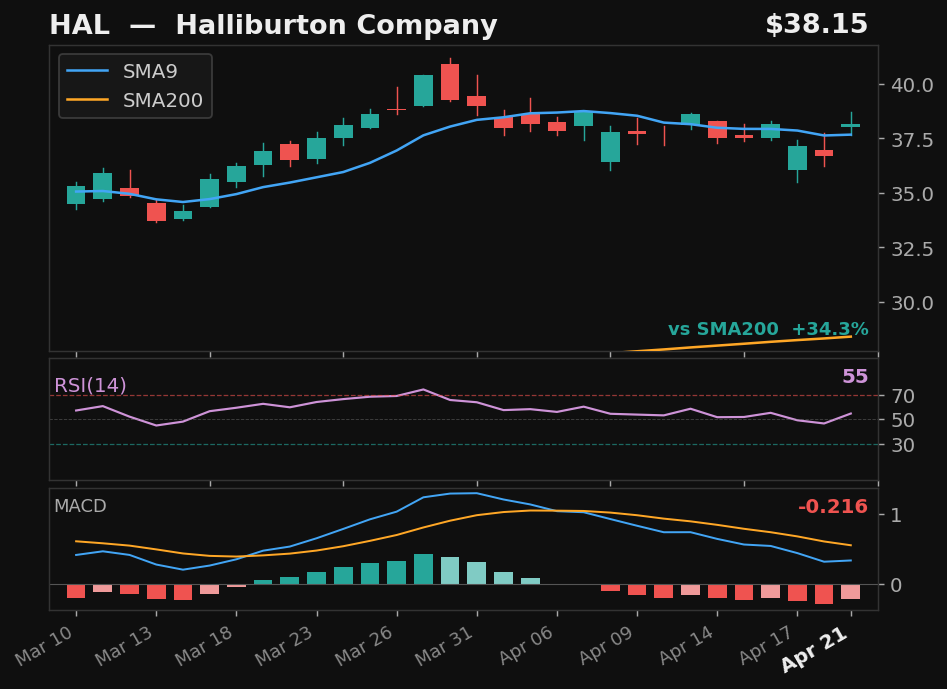
HAL★
Halliburton Company
NYSE
- 5.9% pullback to SMA9 over 11 days
- Crossed back above SMA9 today
- RSI at 55, rising
- MACD histogram improving
Returns
StockMktDiff
1D———
2D———
3D———
5D———
10D———
results pending next close
 click to enlarge
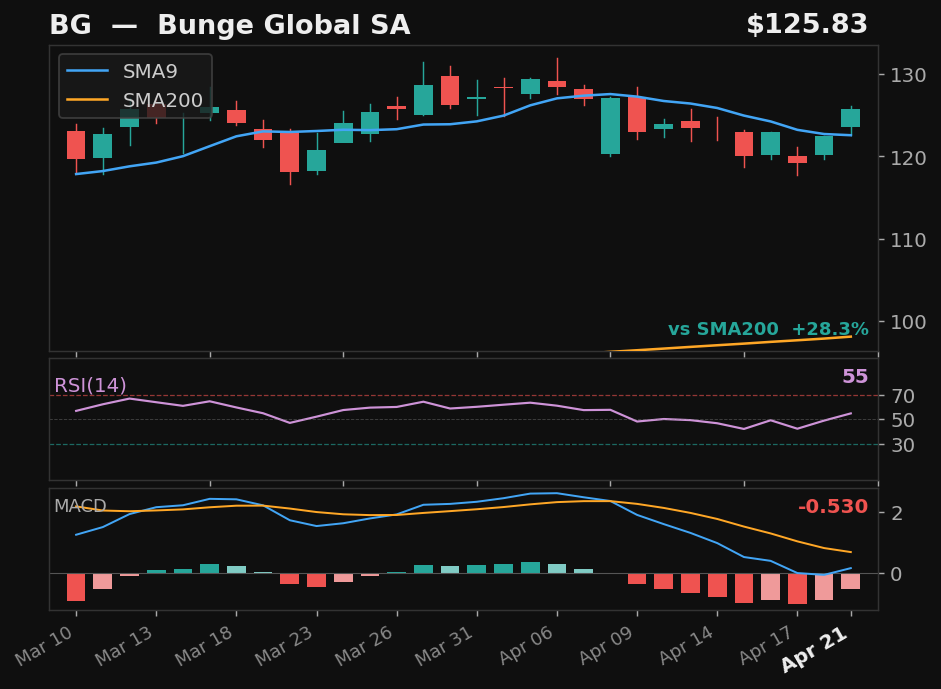
BG★
Bunge Global SA
NYSE
- 7.2% pullback to SMA9 over 10 days
- Crossed back above SMA9 today
- RSI at 55, rising
- MACD histogram improving
Returns
StockMktDiff
1D———
2D———
3D———
5D———
10D———
results pending next close
 click to enlarge
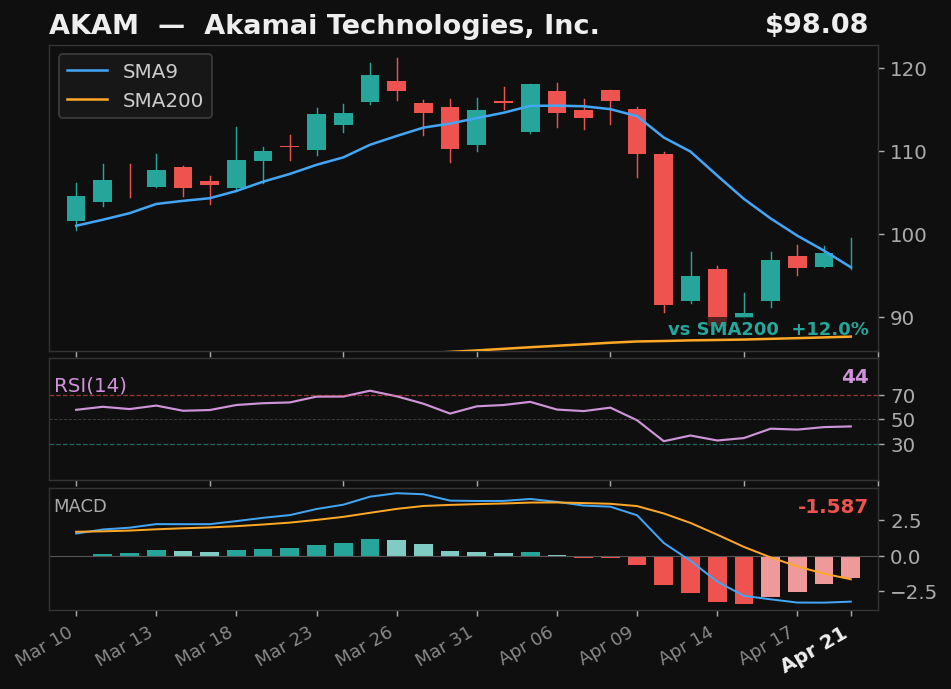
AKAM★
Akamai Technologies, Inc.
NASDAQ
- 23.4% pullback to SMA9 over 8 days
- Crossed back above SMA9 today
- RSI rising from 45 — recovering momentum
- MACD histogram improving
Returns
StockMktDiff
1D———
2D———
3D———
5D———
10D———
results pending next close
Empirical V1
5
▼
click to enlarge
AKAM★
Akamai Technologies, Inc.
NASDAQ
- 23.4% pullback over 8 days — full candle above SMA9
- RSI rising from 45
- MACD histogram rising while still negative — early recovery signal
- 12.0% above SMA200 — extended from trend
Emp Score53.4Body Above✓
Returns
StockMktDiff
1D———
2D———
3D———
5D———
10D———
results pending next close
 click to enlarge
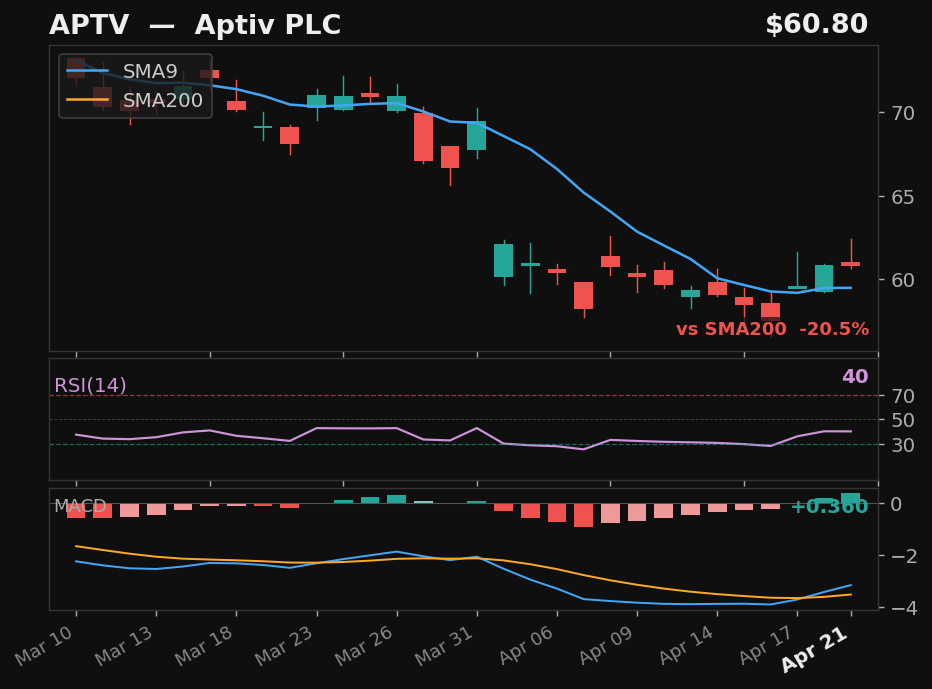
APTV
Aptiv PLC
NYSE
- 18.9% pullback — full candle body above SMA9
- MACD bullish cross 1 day ago
- 20.5% below SMA200 — extended from trend
Emp Score44.0Body Above✓
Returns
StockMktDiff
1D———
2D———
3D———
5D———
10D———
results pending next close
click to enlarge
BG★
Bunge Global SA
NYSE
- 7.2% pullback over 10 days — full candle above SMA9
- RSI at 55, rising above 50
- MACD histogram rising while still negative — early recovery signal
- 28.3% above SMA200 — extended from trend
Emp Score28.8Body Above✓
Returns
StockMktDiff
1D———
2D———
3D———
5D———
10D———
results pending next close
click to enlarge
HAL★
Halliburton Company
NYSE
- 5.9% pullback — full candle body above SMA9
- RSI at 55, rising above 50
- MACD histogram rising while still negative — early recovery signal
- 34.3% above SMA200 — extended from trend
Emp Score28.1Body Above✓
Returns
StockMktDiff
1D———
2D———
3D———
5D———
10D———
results pending next close
 click to enlarge
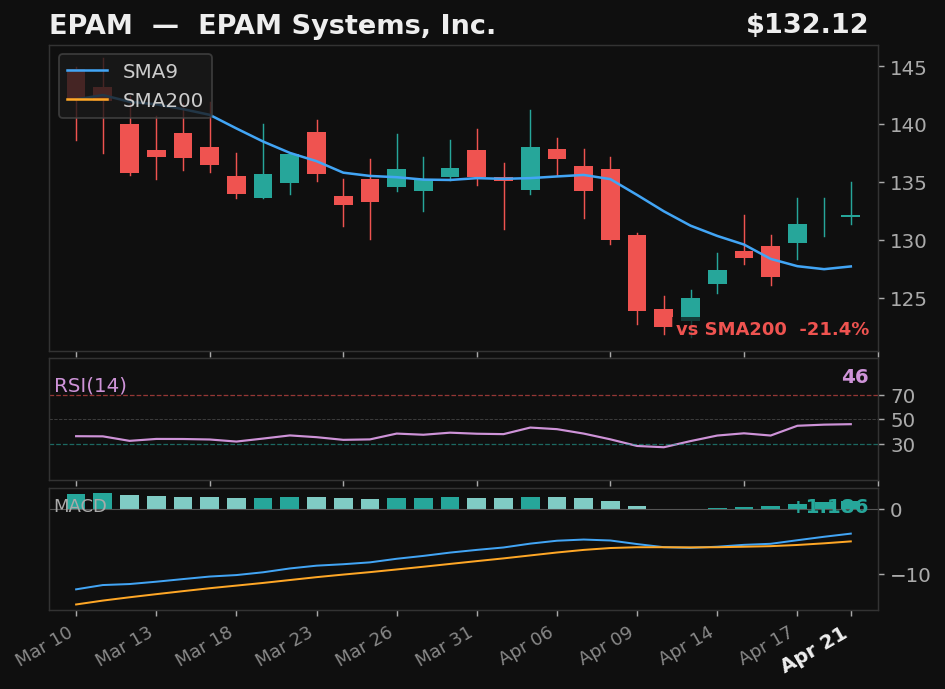
EPAM
EPAM Systems, Inc.
NYSE
- 10.6% pullback — full candle body above SMA9
- RSI rising from 46
- 21.4% below SMA200 — extended from trend
Emp Score27.7Body Above✓
Returns
StockMktDiff
1D———
2D———
3D———
5D———
10D———
results pending next close
SwingTrader Setups
10
▼
click to enlarge
HAL★
Halliburton Company
NYSE
- 5.9% pullback to SMA9 over 11 days
- Crossed back above SMA9 today
- RSI at 55, rising
- MACD histogram improving
Base✓Strict✓Score89.0
Returns
StockMktDiff
1D———
2D———
3D———
5D———
10D———
results pending next close
click to enlarge
BG★
Bunge Global SA
NYSE
- 7.2% pullback to SMA9 over 10 days
- Crossed back above SMA9 today
- RSI at 55, rising
- MACD histogram improving
Base✓Strict✓Score79.0
Returns
StockMktDiff
1D———
2D———
3D———
5D———
10D———
results pending next close
click to enlarge
AKAM★
Akamai Technologies, Inc.
NASDAQ
- 23.4% pullback to SMA9 over 8 days
- Crossed back above SMA9 today
- RSI rising from 45 — recovering momentum
- MACD histogram improving
Base✓Strict✓Score73.0
Returns
StockMktDiff
1D———
2D———
3D———
5D———
10D———
results pending next close
 click to enlarge
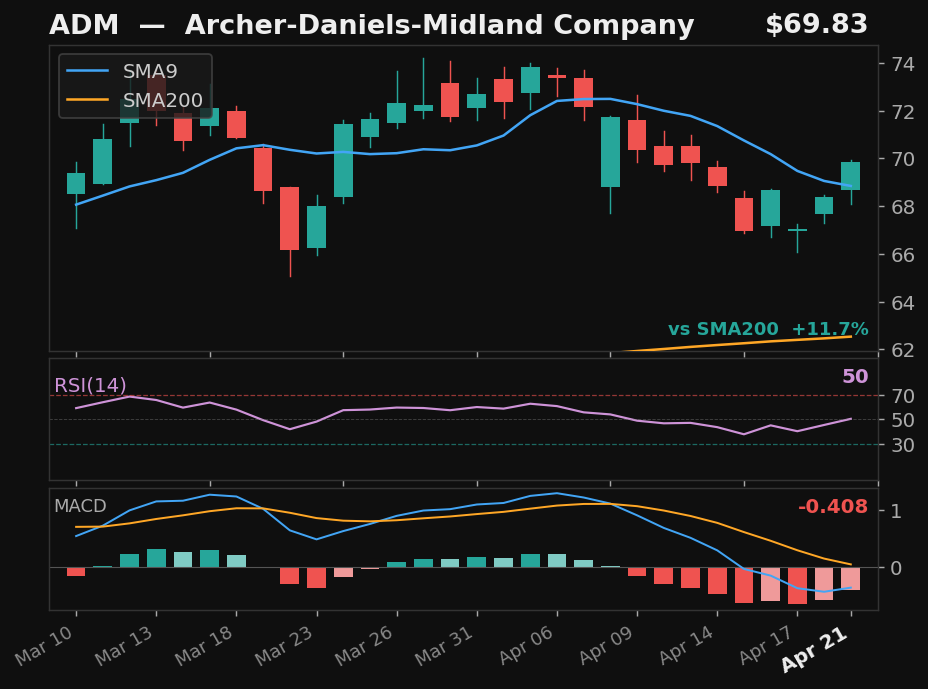
ADM
Archer-Daniels-Midland Company
NYSE
- 8.8% pullback to SMA9 over 10 days
- Crossed back above SMA9 today
- RSI at 50, rising
- MACD histogram improving
Base✓Strict✗Score65.0
Returns
StockMktDiff
1D———
2D———
3D———
5D———
10D———
results pending next close
 click to enlarge
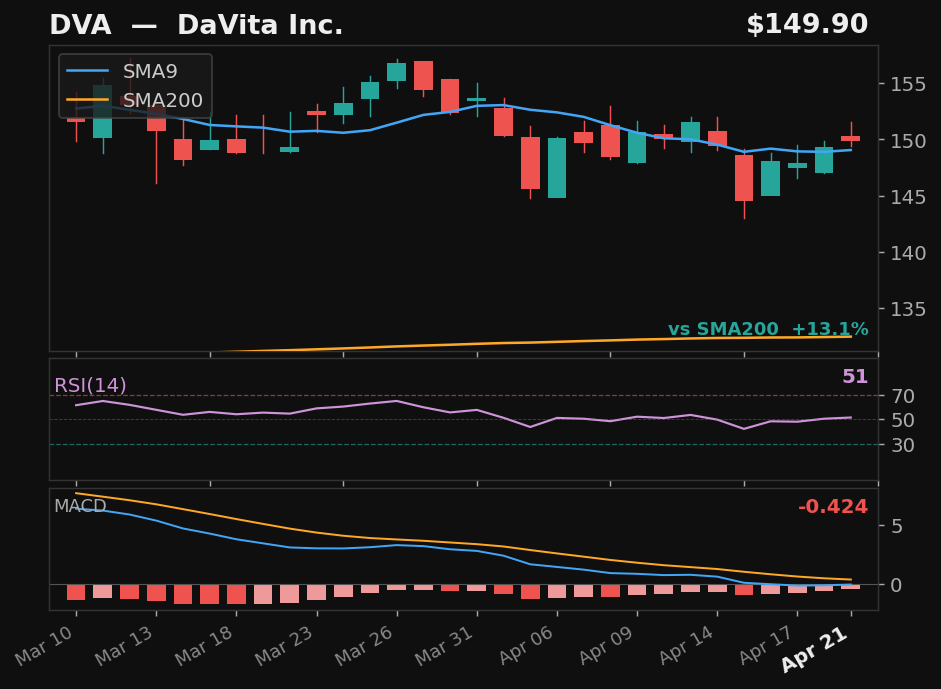
DVA
DaVita Inc.
NYSE
- 5.9% pullback to SMA9 over 10 days
- Crossed above SMA9 — 2 days above
- RSI at 50, rising
- MACD histogram improving
Base✓Strict✗Score65.0
Returns
StockMktDiff
1D———
2D———
3D———
5D———
10D———
results pending next close
 click to enlarge
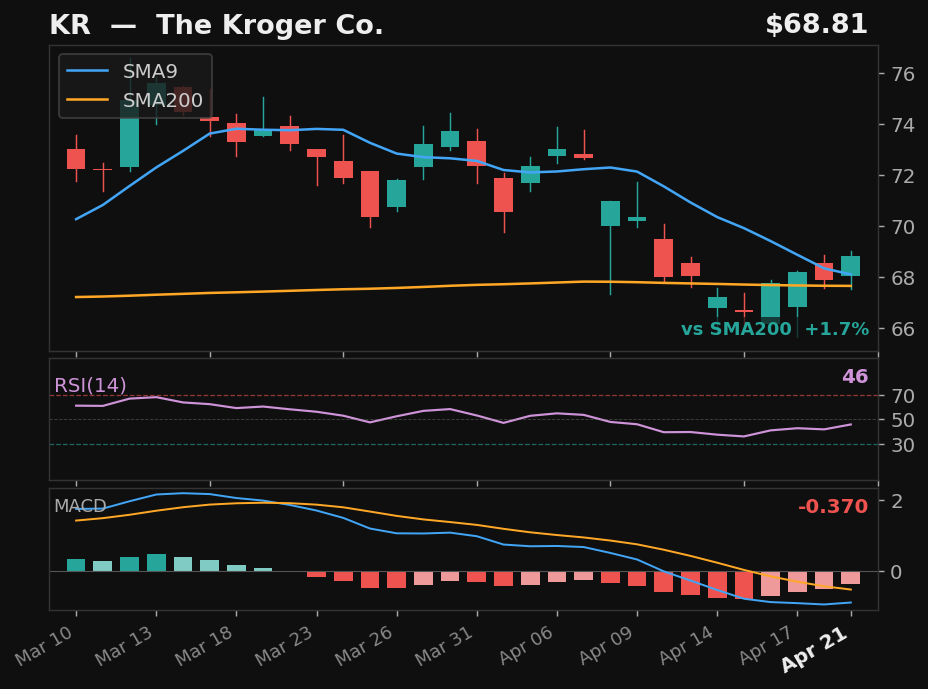
KR
The Kroger Co.
NYSE
- 8.3% pullback to SMA9 over 9 days
- Crossed back above SMA9 today
- RSI at 46, rising
- MACD histogram improving
Base✓Strict✗Score62.0
Returns
StockMktDiff
1D———
2D———
3D———
5D———
10D———
results pending next close
 click to enlarge
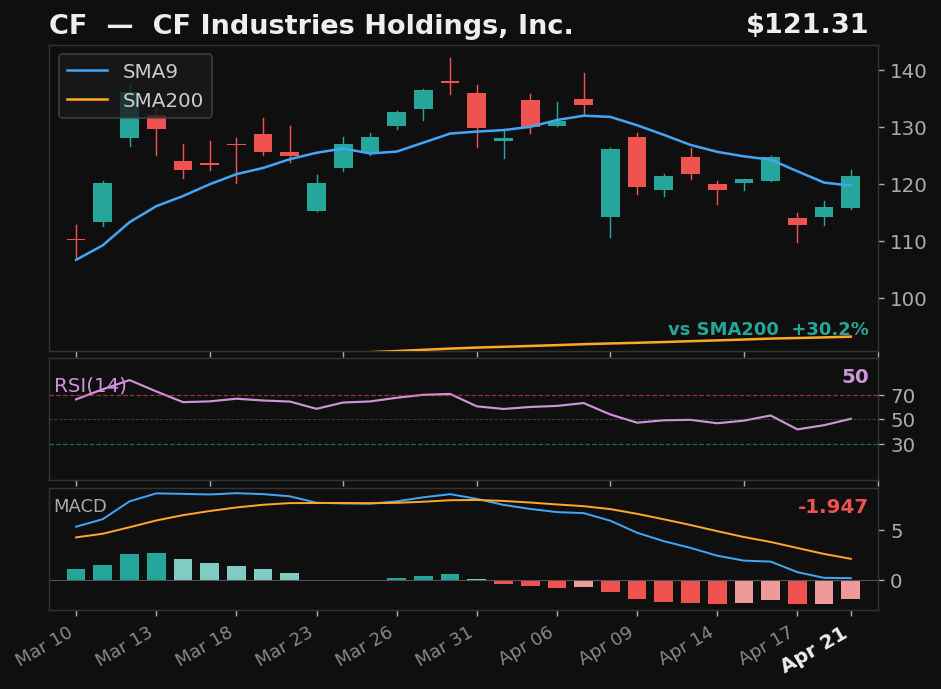
CF
CF Industries Holdings, Inc.
NYSE
- 15.8% pullback to SMA9 over 8 days
- Crossed back above SMA9 today
- RSI at 50, rising
- MACD histogram improving
Base✓Strict✗Score61.0
Returns
StockMktDiff
1D———
2D———
3D———
5D———
10D———
results pending next close
 click to enlarge
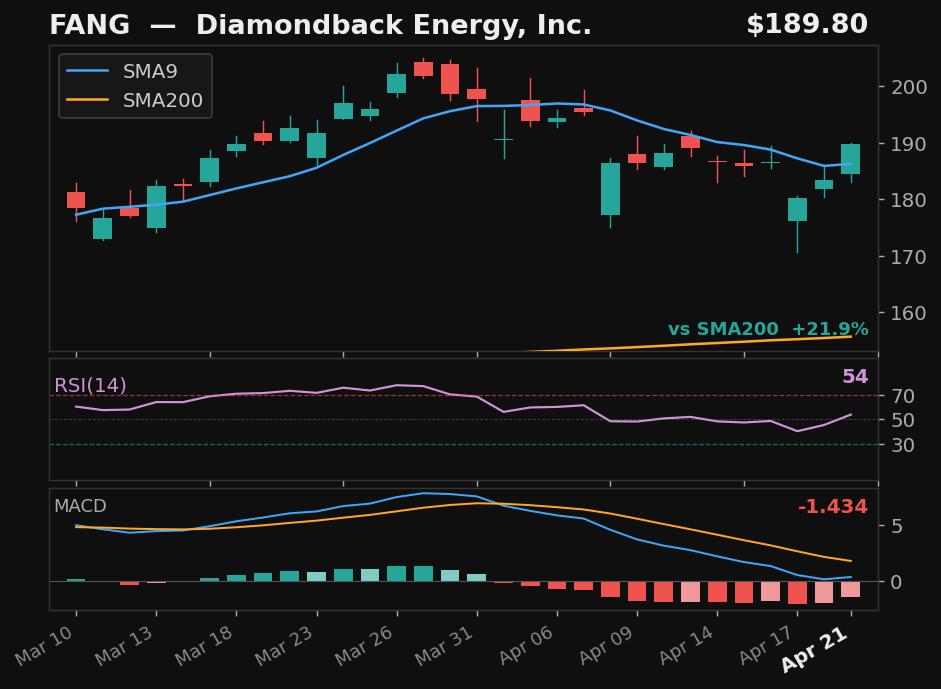
FANG
Diamondback Energy, Inc.
NASDAQ
- 8.9% pullback to SMA9 over 13 days
- Crossed back above SMA9 today
- RSI at 54, rising
- MACD histogram improving
Base✓Strict✗Score61.0
Returns
StockMktDiff
1D———
2D———
3D———
5D———
10D———
results pending next close
 click to enlarge
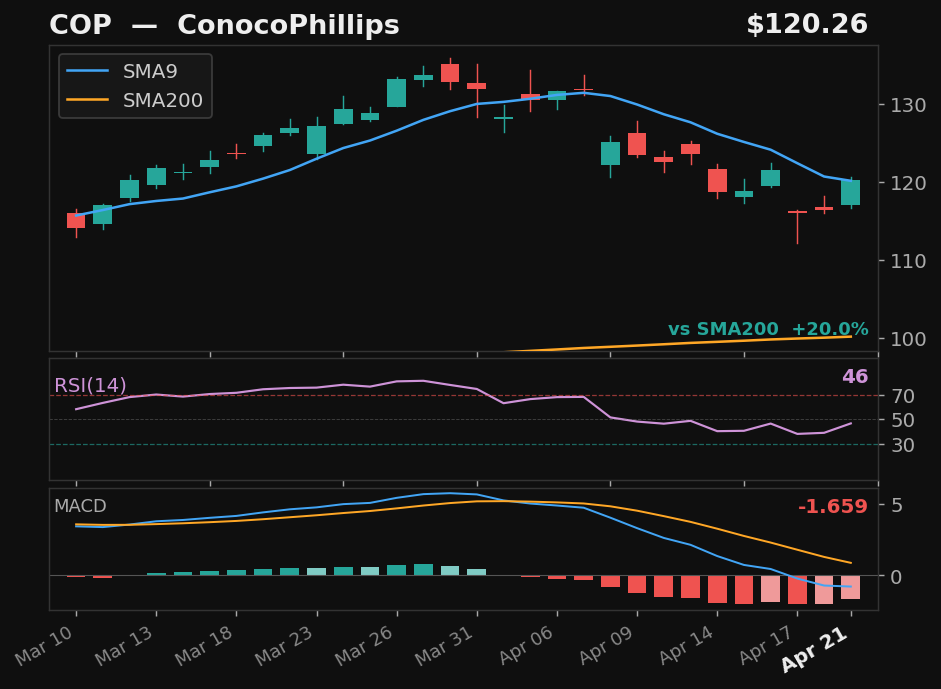
COP
ConocoPhillips
NYSE
- 11.9% pullback to SMA9 over 9 days
- Crossed back above SMA9 today
- RSI at 47, rising
- MACD histogram improving
Base✓Strict✗Score58.0
Returns
StockMktDiff
1D———
2D———
3D———
5D———
10D———
results pending next close
 click to enlarge
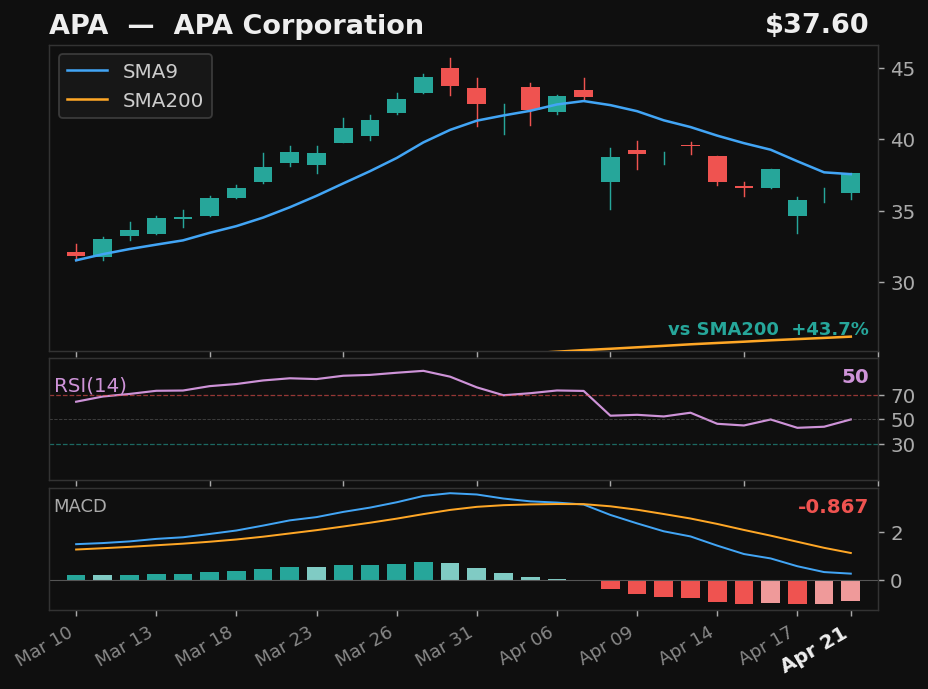
APA
APA Corporation
NASDAQ
- 16.8% pullback to SMA9 over 9 days
- Crossed back above SMA9 today
- RSI at 50, rising
- MACD histogram improving
Base✓Strict✗Score54.0
Returns
StockMktDiff
1D———
2D———
3D———
5D———
10D———
results pending next close