Friday, May 1, 2026 · After Close
★ Highlights
1
▼
 click to enlarge
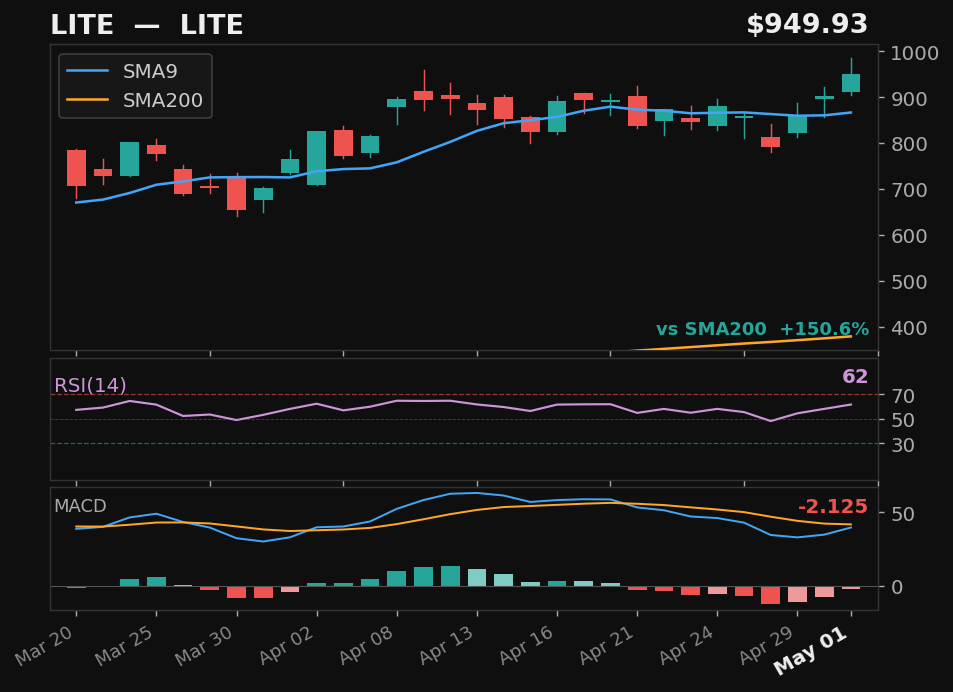
LITE★
LITE
NASDAQ
- 11.6% pullback — full candle body above SMA9
- RSI at 62 — confirmed recovery momentum
- MACD histogram rising while still negative — early recovery signal
- 150.6% above SMA200 — extended from trend
Returns
StockMktDiff
1D———
2D———
3D———
5D———
10D———
results pending next close
Explosive Up Setups
2
▼
click to enlarge
LITE★
LITE
NASDAQ
- 11.6% pullback — 5 days below SMA9
- Prior rally: 13%
- 151% above SMA200 — strong structural position
- MACD histogram rising from negative — early momentum signal
Exp Score77Days Below5Pullback%11.6
Returns
StockMktDiff
1D———
2D———
3D———
5D———
10D———
results pending next close
 click to enlarge
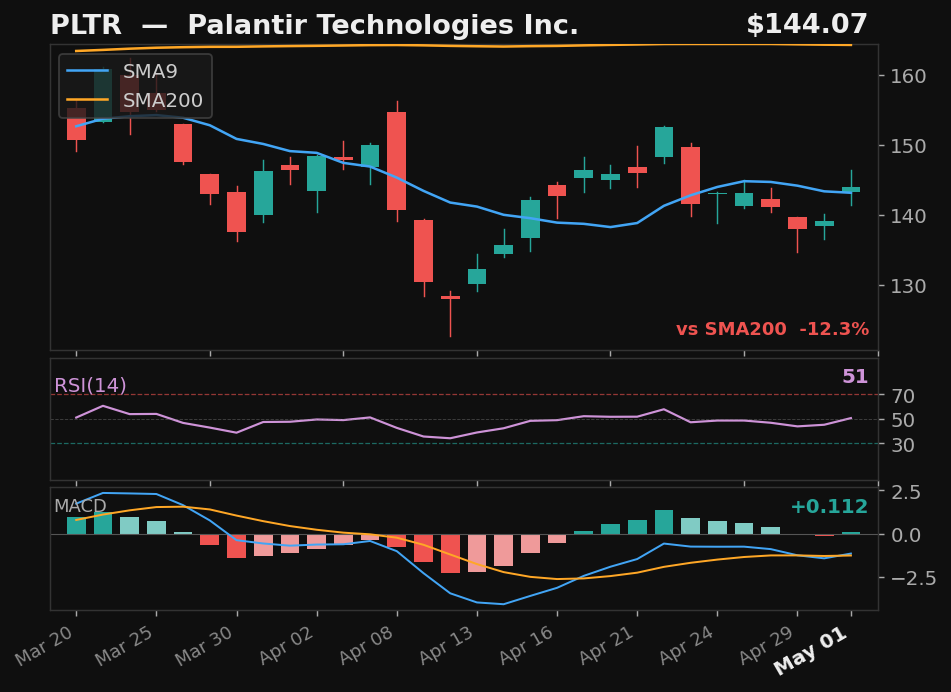
PLTR
Palantir Technologies Inc.
NASDAQ
- 9.6% pullback — 6 days below SMA9
- Prior rally: 11%
- MACD histogram rising from negative — early momentum signal
Exp Score51Days Below6Pullback%9.6
Returns
StockMktDiff
1D———
2D———
3D———
5D———
10D———
results pending next close
Empirical V1
5
▼
click to enlarge
LITE★
LITE
NASDAQ
- 11.6% pullback — full candle body above SMA9
- RSI at 62 — confirmed recovery momentum
- MACD histogram rising while still negative — early recovery signal
- 150.6% above SMA200 — extended from trend
Emp Score76.4Body Above✓
Returns
StockMktDiff
1D———
2D———
3D———
5D———
10D———
results pending next close
 click to enlarge
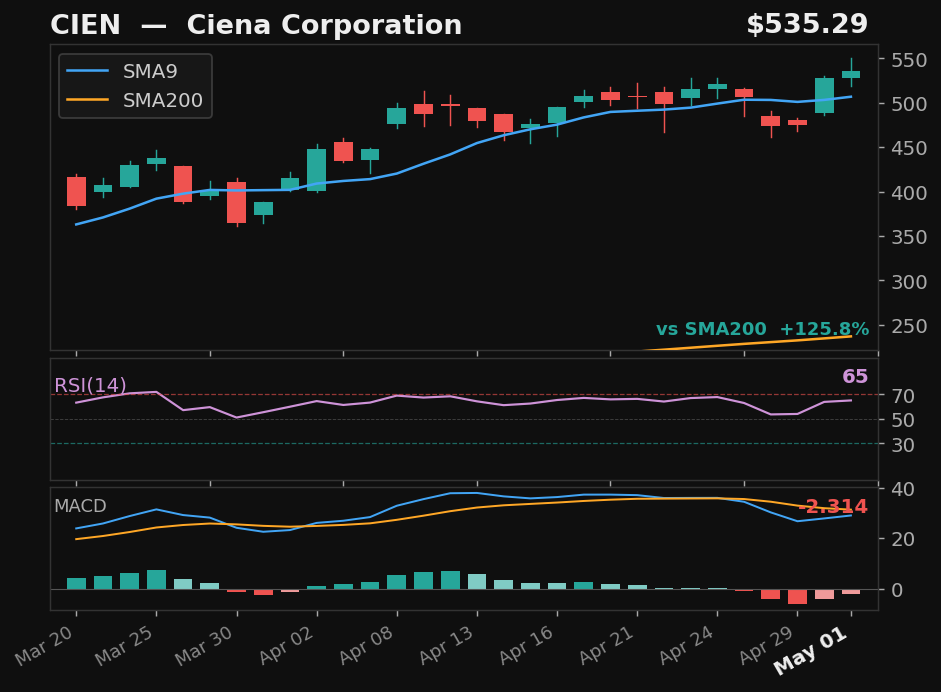
CIEN
Ciena Corporation
NYSE
- 6.4% pullback — full candle body above SMA9
- RSI at 65 — confirmed recovery momentum
- MACD histogram rising while still negative — early recovery signal
- 125.8% above SMA200 — extended from trend
Emp Score58.6Body Above✓
Returns
StockMktDiff
1D———
2D———
3D———
5D———
10D———
results pending next close
 click to enlarge
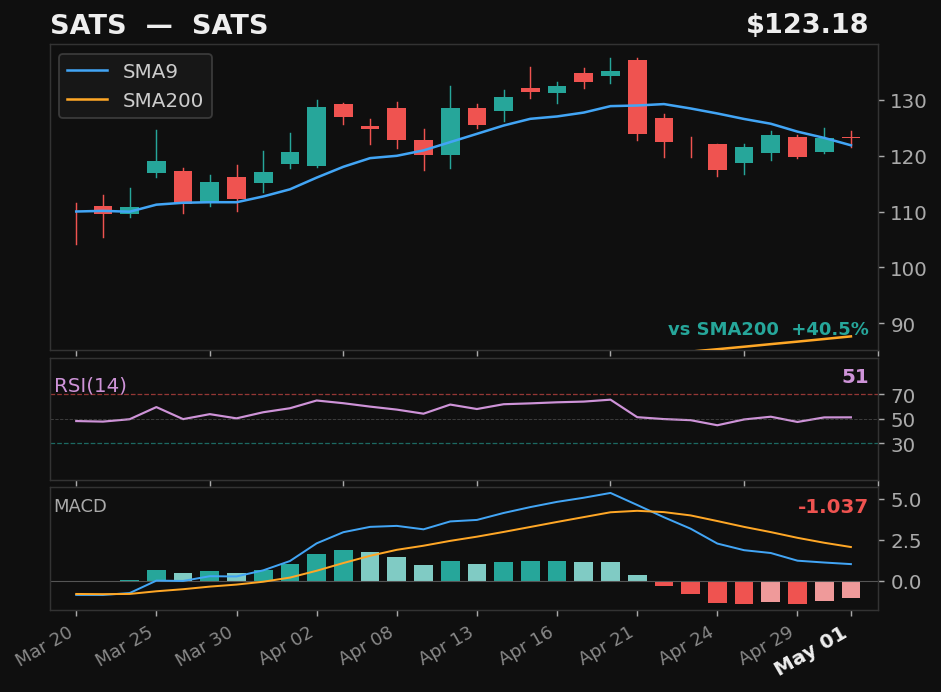
SATS
SATS
NASDAQ
- 13.0% pullback over 8 days — full candle above SMA9
- RSI at 51, rising above 50
- MACD histogram rising while still negative — early recovery signal
- 40.5% above SMA200 — extended from trend
Emp Score44.2Body Above✓
Returns
StockMktDiff
1D———
2D———
3D———
5D———
10D———
results pending next close
 click to enlarge
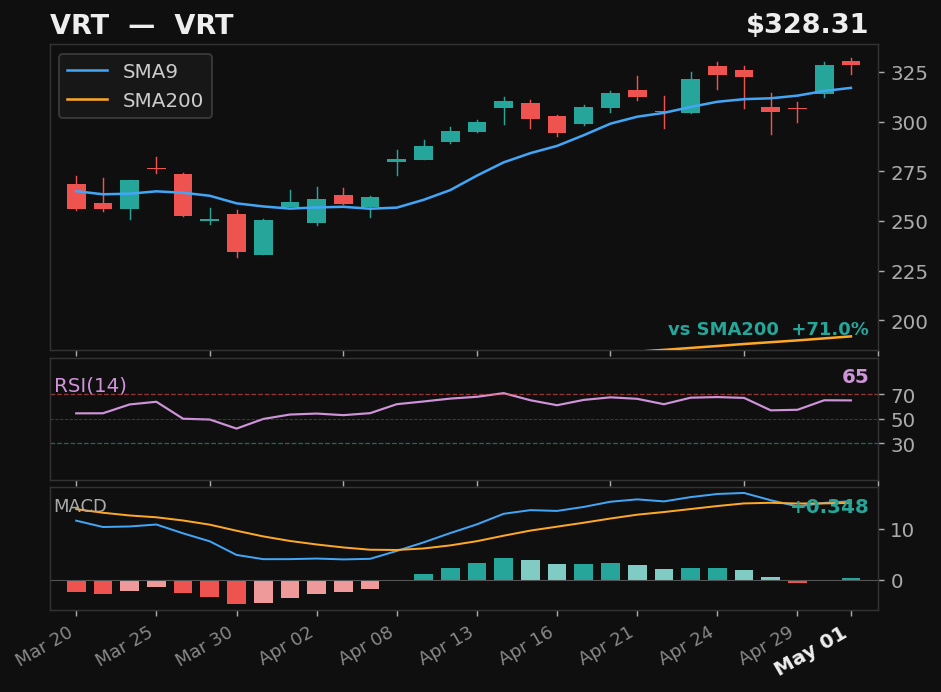
VRT
VRT
NYSE
- 5.4% pullback — full candle body above SMA9
- MACD bullish cross 1 day ago
- 71.0% above SMA200 — extended from trend
Emp Score37.1Body Above✓
Returns
StockMktDiff
1D———
2D———
3D———
5D———
10D———
results pending next close
 click to enlarge
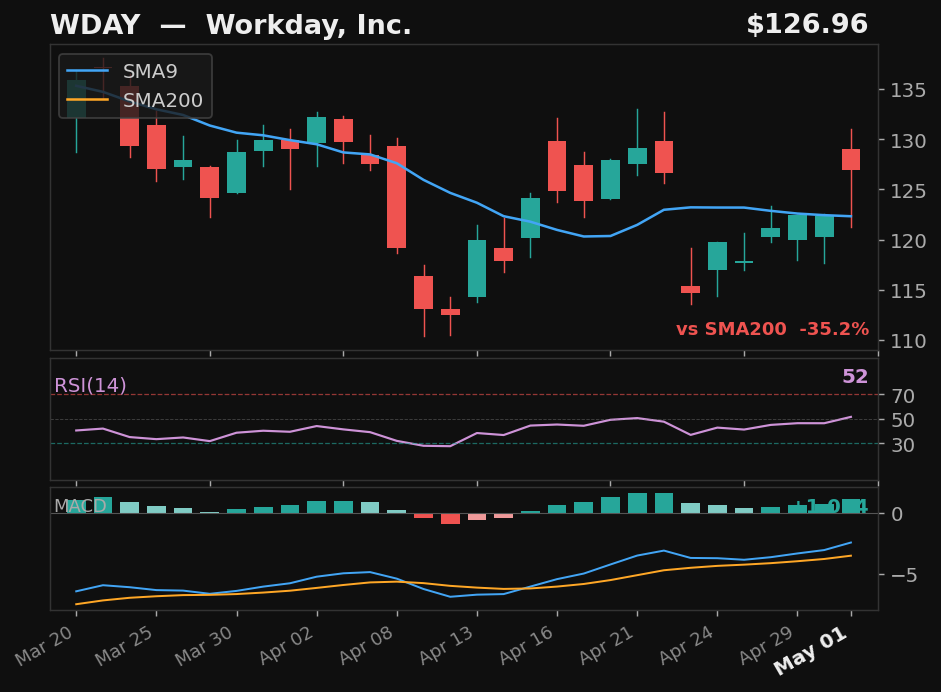
WDAY
Workday, Inc.
NASDAQ
- 9.4% pullback over 6 days — full candle above SMA9
- RSI at 52, rising above 50
- 35.1% below SMA200 — extended from trend
Emp Score32.4Body Above✓
Returns
StockMktDiff
1D———
2D———
3D———
5D———
10D———
results pending next close
SwingTrader Setups
10
▼
 click to enlarge
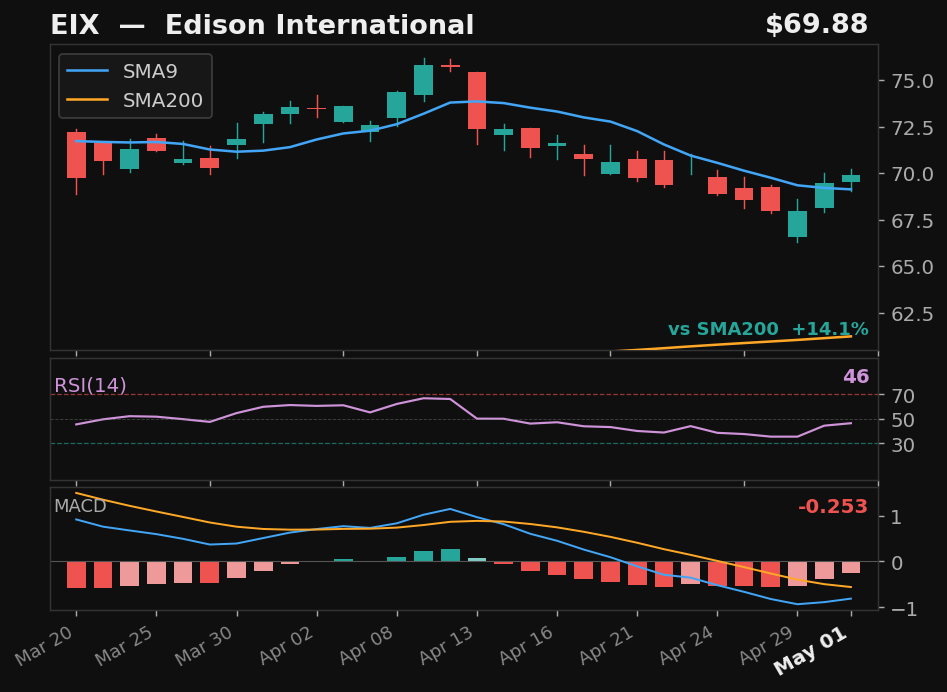
EIX
Edison International
NYSE
- 10.3% pullback to SMA9 over 13 days
- Crossed above SMA9 — 2 days above
- RSI at 46, rising
- MACD histogram improving
Base✓Strict✓Score73.0
Returns
StockMktDiff
1D———
2D———
3D———
5D———
10D———
results pending next close
 click to enlarge
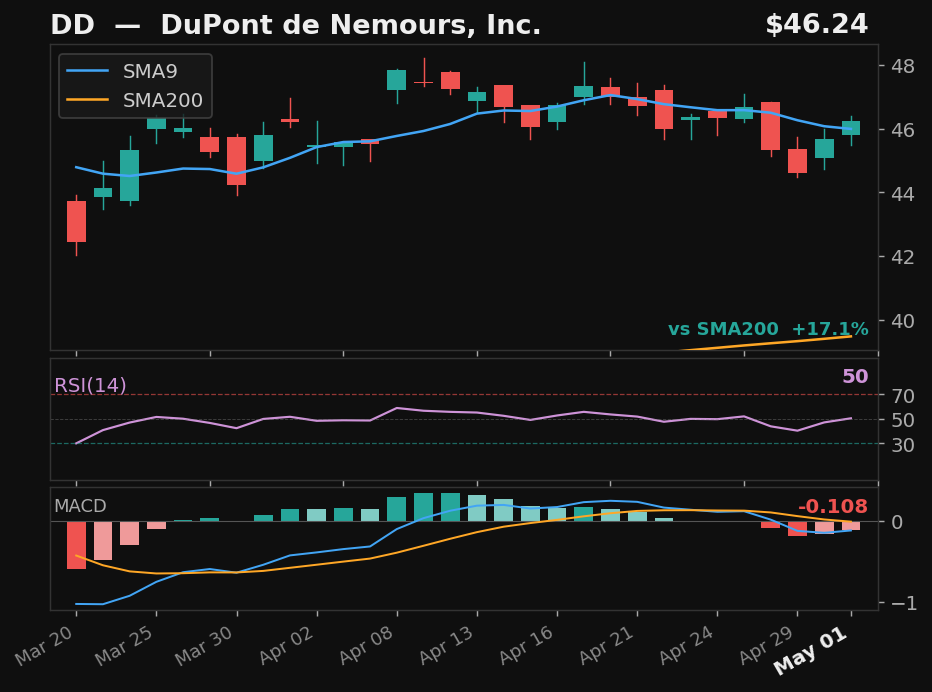
DD
DuPont de Nemours, Inc.
NYSE
- 5.8% pullback to SMA9 over 8 days
- Crossed back above SMA9 today
- RSI at 49, rising
- MACD histogram improving
Base✓Strict✗Score75.0
Returns
StockMktDiff
1D———
2D———
3D———
5D———
10D———
results pending next close
 click to enlarge
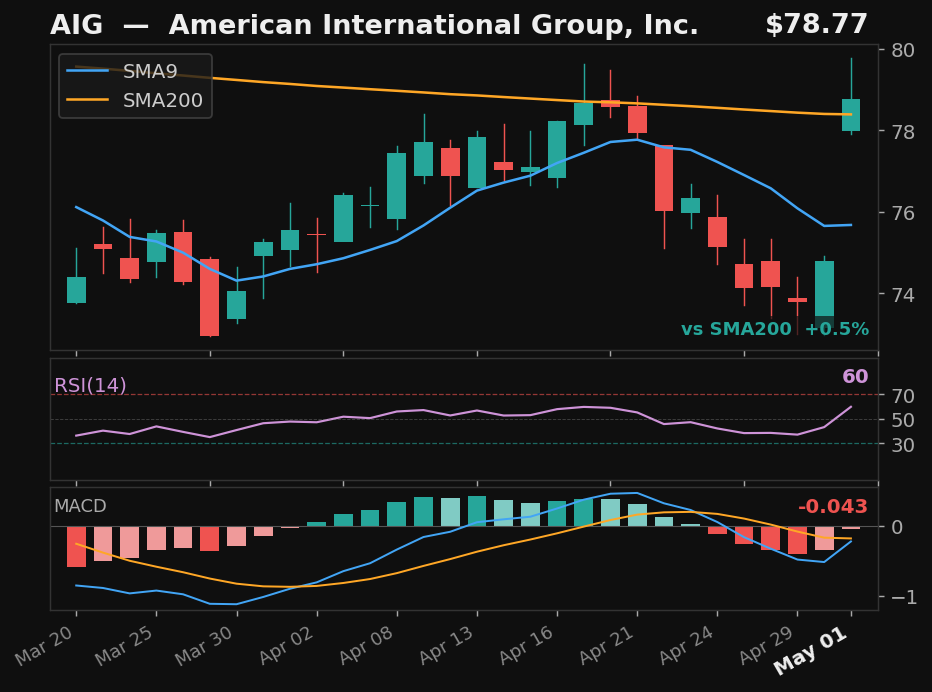
AIG
American International Group, Inc.
NYSE
- 5.3% pullback to SMA9 over 7 days
- Crossed back above SMA9 today
- RSI at 60, rising
- MACD histogram improving
Base✓Strict✗Score71.0
Returns
StockMktDiff
1D———
2D———
3D———
5D———
10D———
results pending next close
 click to enlarge
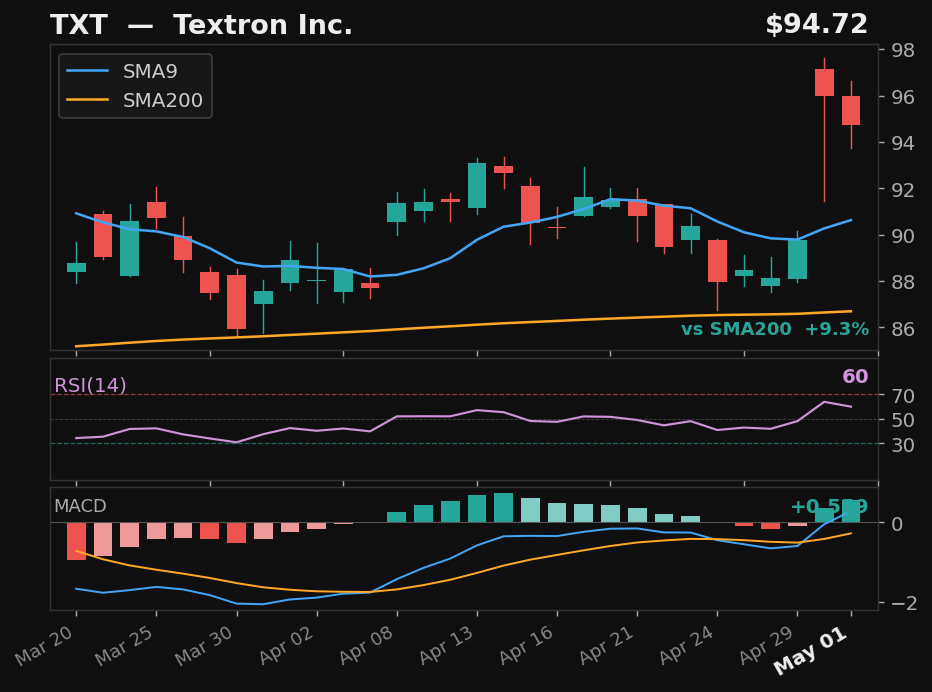
TXT
Textron Inc.
NYSE
- 5.1% pullback to SMA9 over 10 days
- Crossed above SMA9 — 2 days above
- MACD bullish cross 1 day ago
- Long-term uptrend intact
Base✓Strict✗Score67.0
Returns
StockMktDiff
1D———
2D———
3D———
5D———
10D———
results pending next close
 click to enlarge
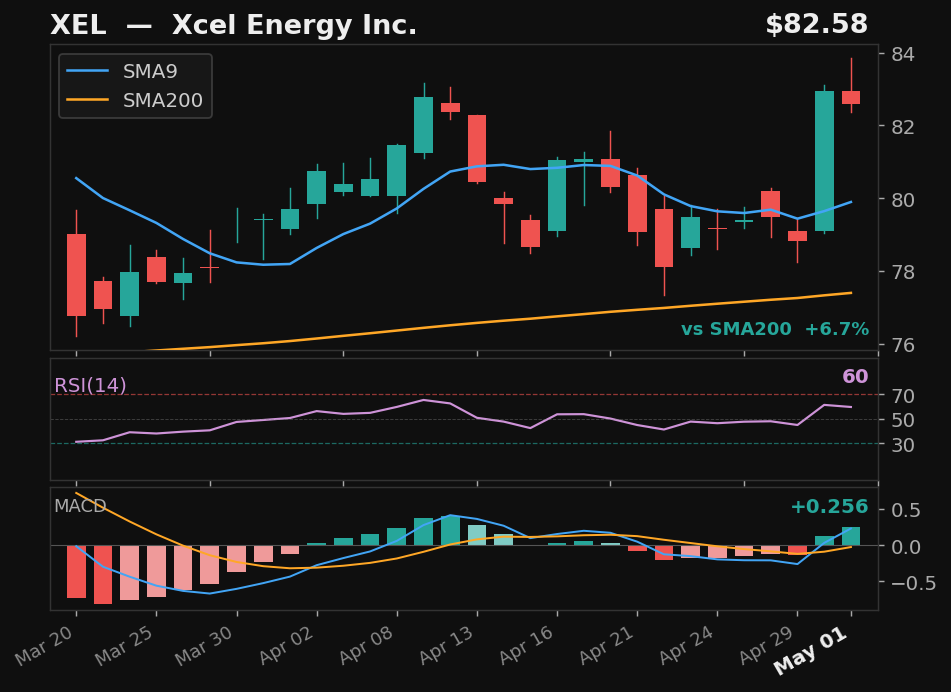
XEL
Xcel Energy Inc.
NASDAQ
- 3.7% pullback to SMA9 over 8 days
- Crossed above SMA9 — 2 days above
- MACD bullish cross 1 day ago
- Long-term uptrend intact
Base✓Strict✗Score67.0
Returns
StockMktDiff
1D———
2D———
3D———
5D———
10D———
results pending next close
 click to enlarge
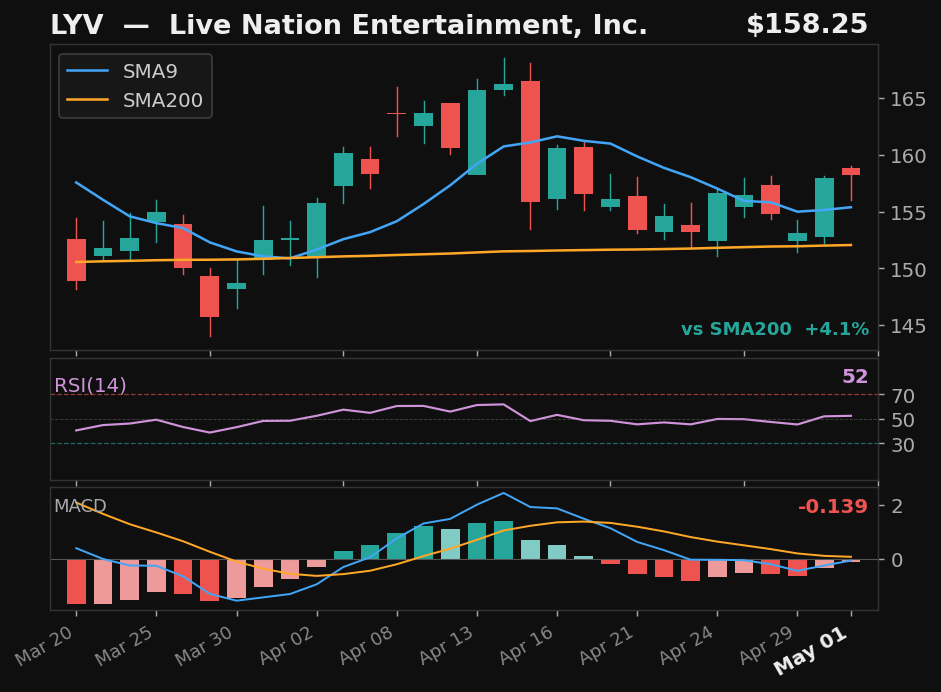
LYV
Live Nation Entertainment, Inc.
NYSE
- 7.9% pullback to SMA9 over 10 days
- Crossed above SMA9 — 2 days above
- RSI at 52, rising
- MACD histogram improving
Base✓Strict✗Score64.0
Returns
StockMktDiff
1D———
2D———
3D———
5D———
10D———
results pending next close
 click to enlarge
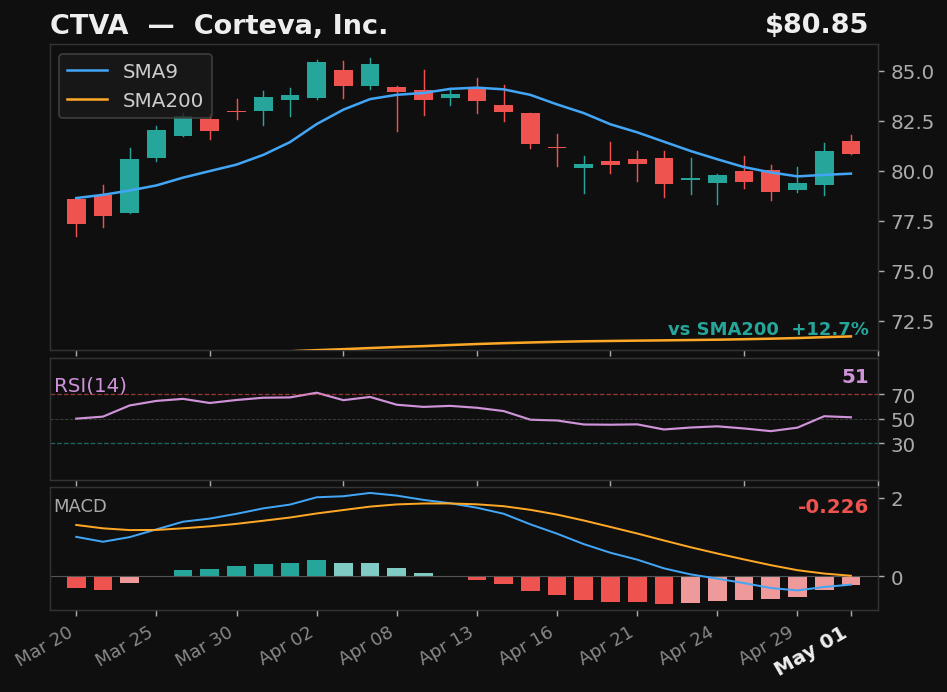
CTVA
Corteva, Inc.
NYSE
- 6.0% pullback to SMA9 over 15 days
- Crossed above SMA9 — 2 days above
- MACD histogram improving
- Long-term uptrend intact
Base✓Strict✗Score62.0
Returns
StockMktDiff
1D———
2D———
3D———
5D———
10D———
results pending next close
 click to enlarge
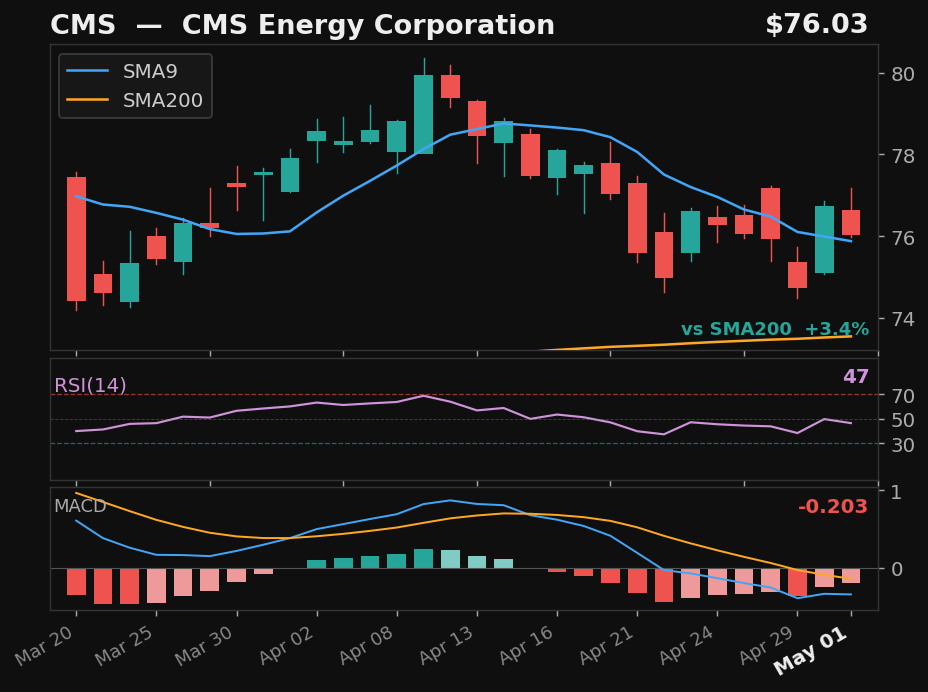
CMS
CMS Energy Corporation
NYSE
- 5.9% pullback to SMA9 over 12 days
- Crossed above SMA9 — 2 days above
- MACD histogram improving
Base✓Strict✗Score61.0
Returns
StockMktDiff
1D———
2D———
3D———
5D———
10D———
results pending next close
 click to enlarge
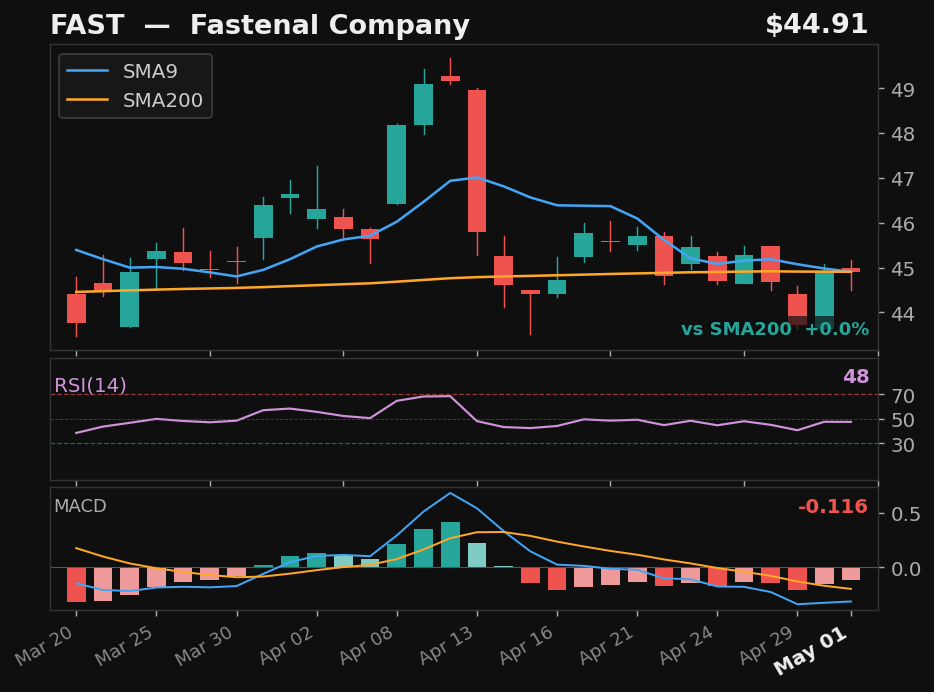
FAST
Fastenal Company
NASDAQ
- 11.1% pullback to SMA9 over 12 days
- Crossed back above SMA9 today
- MACD histogram improving
Base✓Strict✗Score60.0
Returns
StockMktDiff
1D———
2D———
3D———
5D———
10D———
results pending next close
 click to enlarge
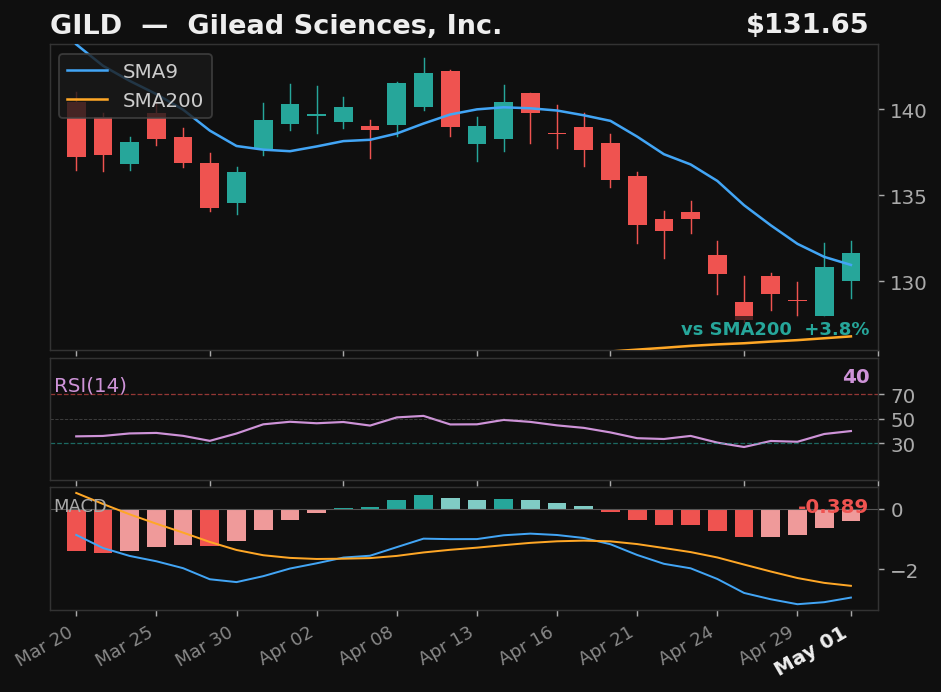
GILD
Gilead Sciences, Inc.
NASDAQ
- 10.1% pullback to SMA9 over 14 days
- Crossed back above SMA9 today
- RSI rising from 39 — recovering momentum
- MACD histogram improving
Base✓Strict✗Score60.0
Returns
StockMktDiff
1D———
2D———
3D———
5D———
10D———
results pending next close