Monday, May 11, 2026 · After Close
Empirical4
 click to enlarge
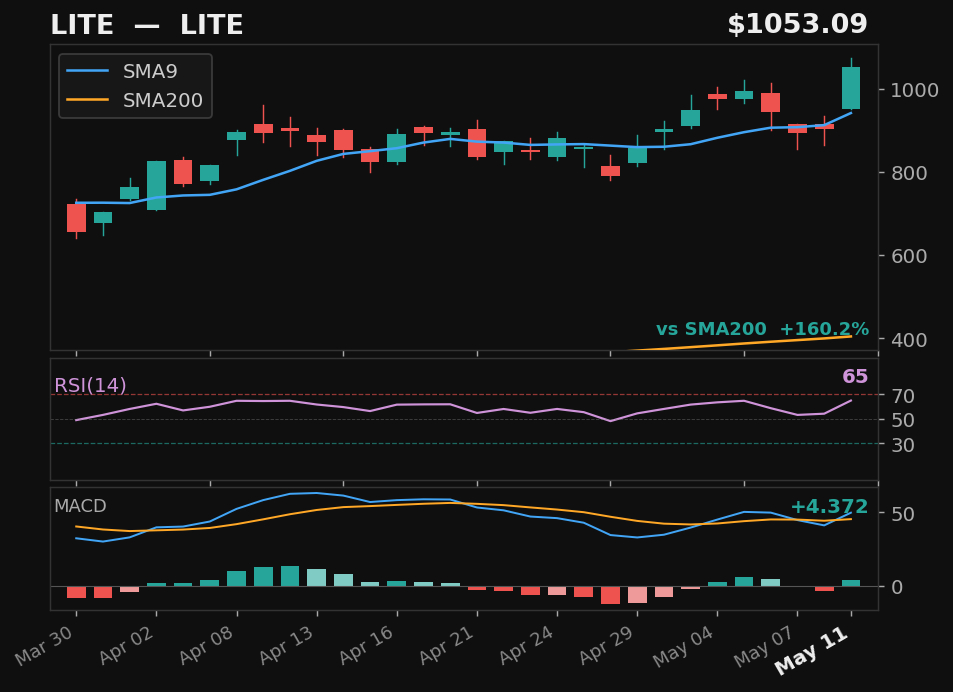
LITE
LITE
NASDAQ
- 5.5% pullback — full candle body above SMA9
- RSI at 64 — confirmed recovery momentum
- 160.2% above SMA200 — extended from trend
Empirical
Emp Score64.0Body Above✓
Returns
StockMktDiff
1D———
2D———
3D———
5D———
10D———
results pending next close
 click to enlarge
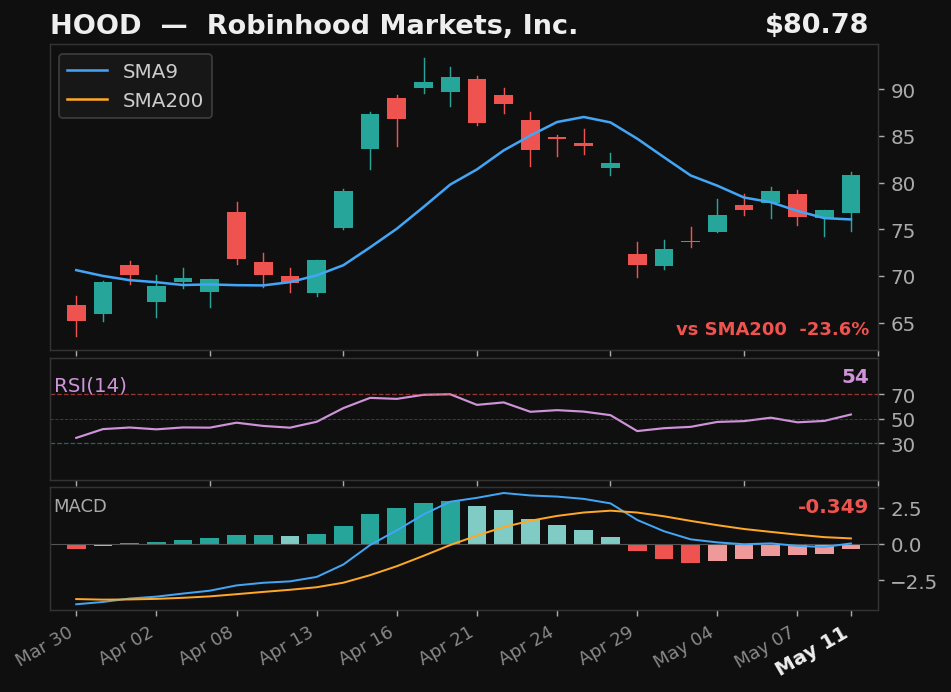
HOOD
Robinhood Markets, Inc.
NASDAQ
- 19.5% pullback — full candle body above SMA9
- RSI at 54, rising above 50
- MACD histogram rising while still negative — early recovery signal
- 23.6% below SMA200 — extended from trend
Empirical
Emp Score52.1Body Above✓
Returns
StockMktDiff
1D———
2D———
3D———
5D———
10D———
results pending next close
 click to enlarge
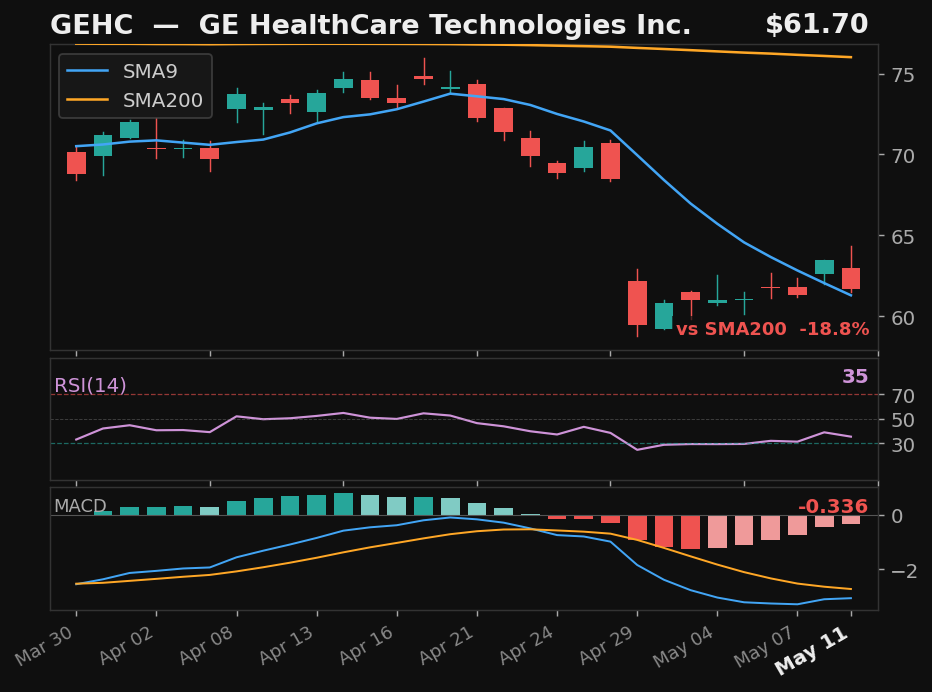
GEHC
GE HealthCare Technologies Inc.
NASDAQ
- 19.8% pullback — full candle body above SMA9
- MACD histogram rising while still negative — early recovery signal
- 18.8% below SMA200 — extended from trend
Empirical
Emp Score48.2Body Above✓
Returns
StockMktDiff
1D———
2D———
3D———
5D———
10D———
results pending next close
 click to enlarge
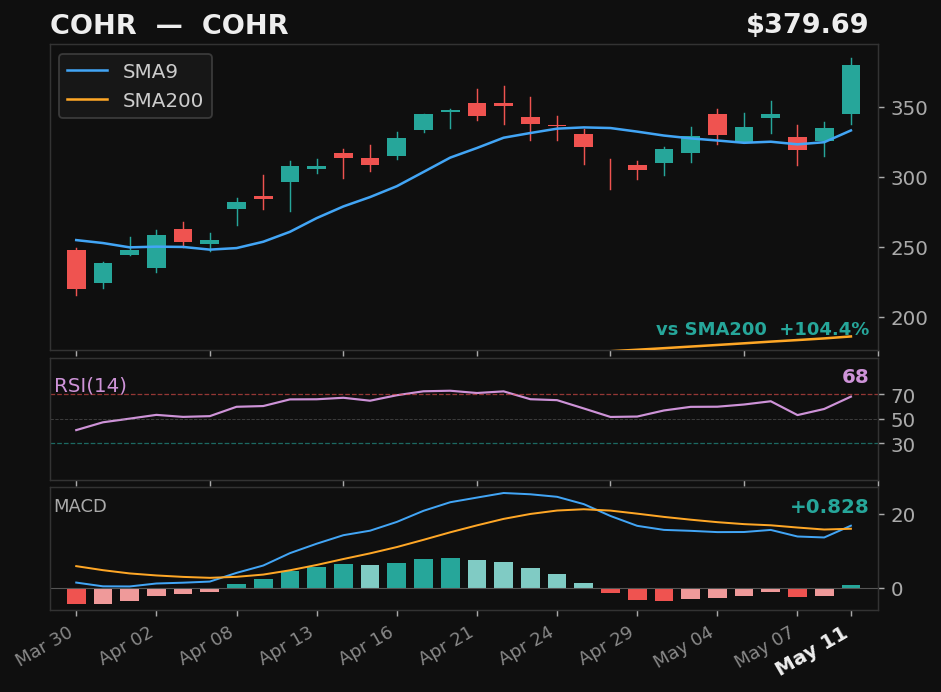
COHR
COHR
NYSE
- 7.4% pullback — full candle body above SMA9
- RSI at 68, rising above 50
- 104.4% above SMA200 — extended from trend
Empirical
Emp Score46.1Body Above✓
Returns
StockMktDiff
1D———
2D———
3D———
5D———
10D———
results pending next close