Wednesday, May 13, 2026 · After Close
★ Highlights1
 click to enlarge
CF★
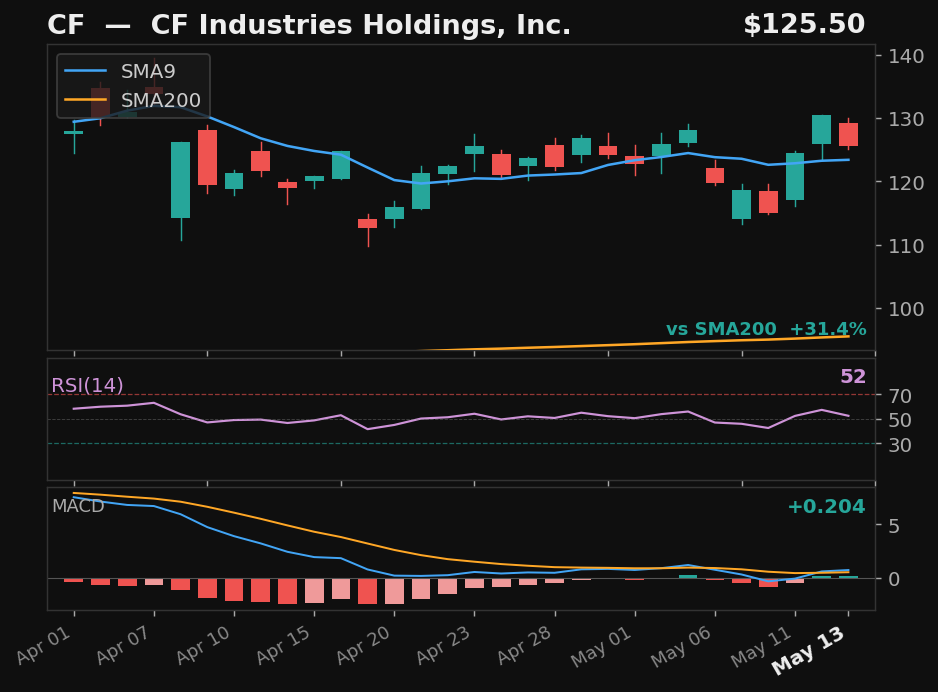
CF Industries Holdings, Inc.
NYSE
- 10.2% pullback — full candle body above SMA9
- MACD bullish cross 1 day ago
- 31.4% above SMA200 — extended from trend
ExplosiveUpEmpirical
Returns
StockMktDiff
1D———
2D———
3D———
5D———
10D———
results pending next close
Explosive Up Setups1
click to enlarge
CF★
CF Industries Holdings, Inc.
NYSE
- 10.2% pullback — 3 days below SMA9
- Prior rally: 11%
- 31% above SMA200 — strong structural position
- MACD momentum building
ExplosiveUp
Exp Score67Days Below3Pullback%10.2
Returns
StockMktDiff
1D———
2D———
3D———
5D———
10D———
results pending next close
Empirical4
 click to enlarge
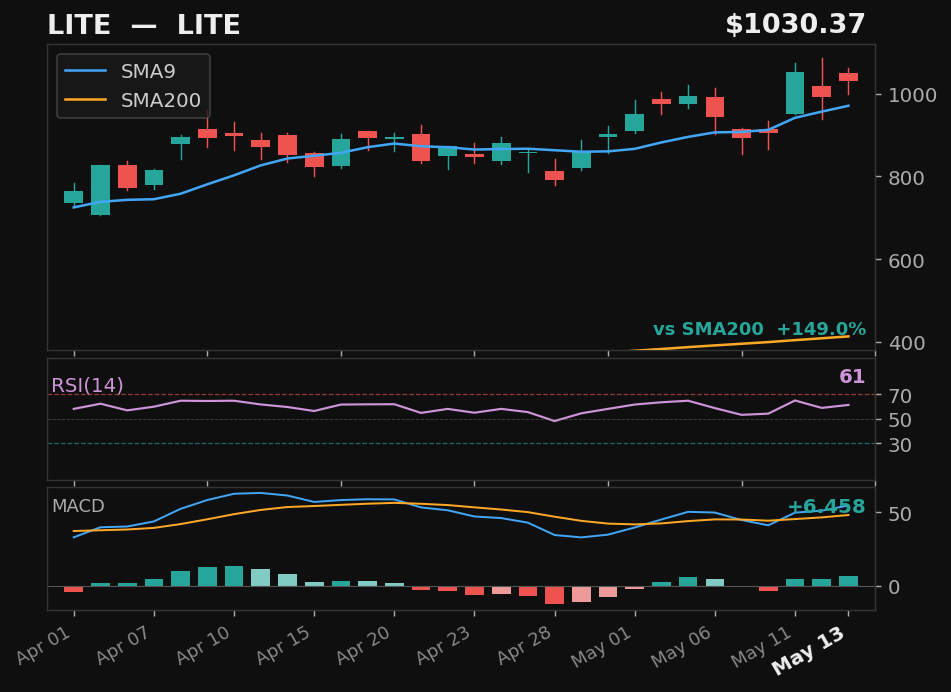
LITE
LITE
NASDAQ
- 5.5% pullback — full candle body above SMA9
- RSI at 60 — confirmed recovery momentum
- MACD bullish cross 2 days ago
- 149.0% above SMA200 — extended from trend
Empirical
Emp Score60.6Body Above✓
Returns
StockMktDiff
1D———
2D———
3D———
5D———
10D———
results pending next close
 click to enlarge
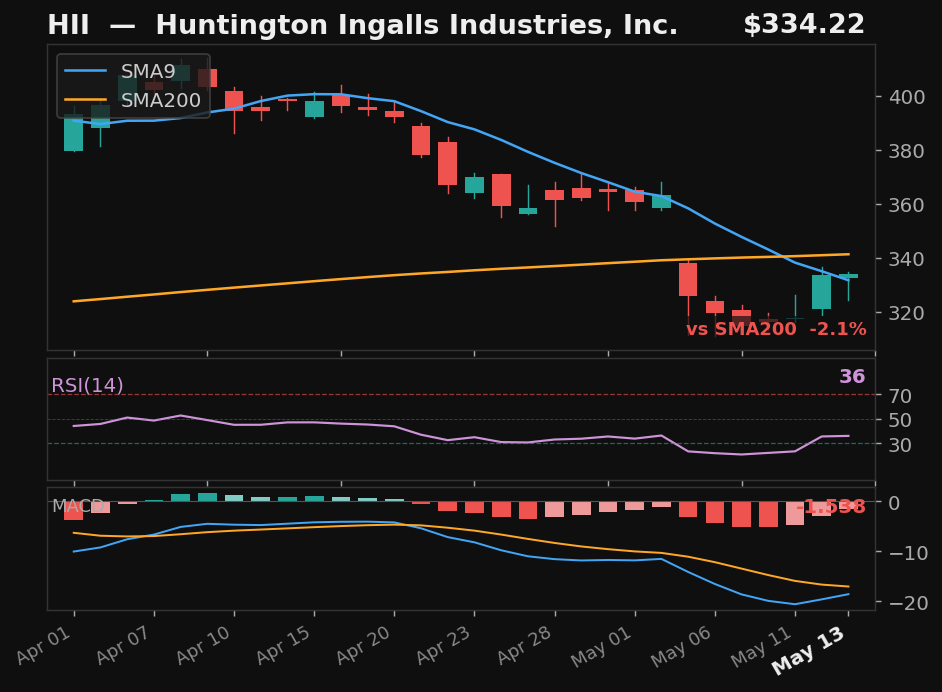
HII
Huntington Ingalls Industries, Inc.
NYSE
- 22.0% pullback over 6 days — full candle above SMA9
- RSI rising from 35
- MACD histogram rising while still negative — early recovery signal
Empirical
Emp Score47.6Body Above✓
Returns
StockMktDiff
1D———
2D———
3D———
5D———
10D———
results pending next close
 click to enlarge
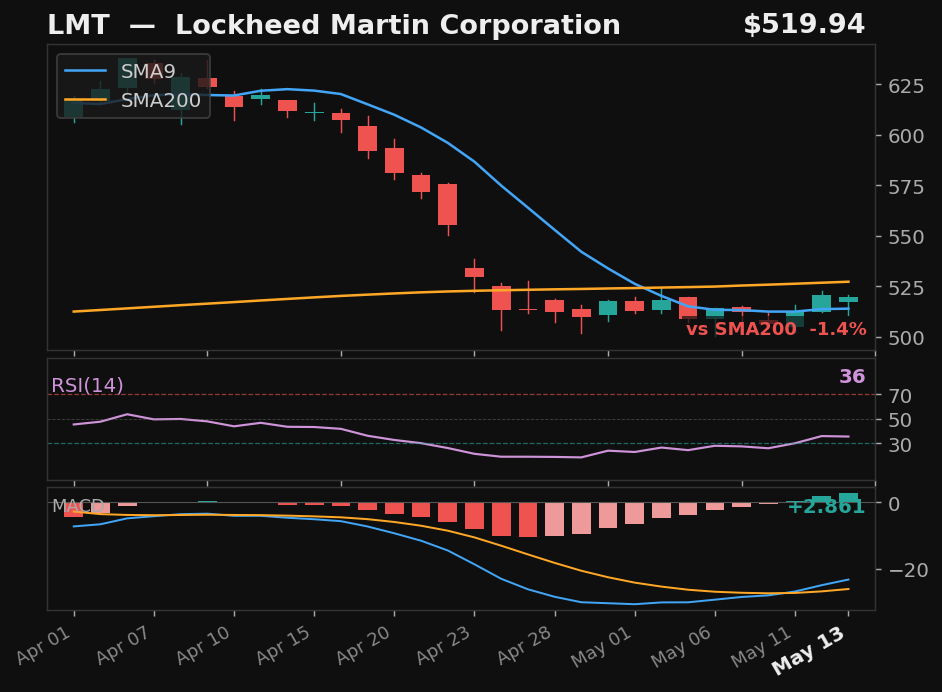
LMT
Lockheed Martin Corporation
NYSE
- 18.8% pullback — full candle body above SMA9
- MACD bullish cross 2 days ago
Empirical
Emp Score38.0Body Above✓
Returns
StockMktDiff
1D———
2D———
3D———
5D———
10D———
results pending next close
click to enlarge
CF★
CF Industries Holdings, Inc.
NYSE
- 10.2% pullback — full candle body above SMA9
- MACD bullish cross 1 day ago
- 31.4% above SMA200 — extended from trend
Empirical
Emp Score32.8Body Above✓
Returns
StockMktDiff
1D———
2D———
3D———
5D———
10D———
results pending next close