Wednesday, June 10, 2026 · After Close
★ Highlights1
 click to enlarge
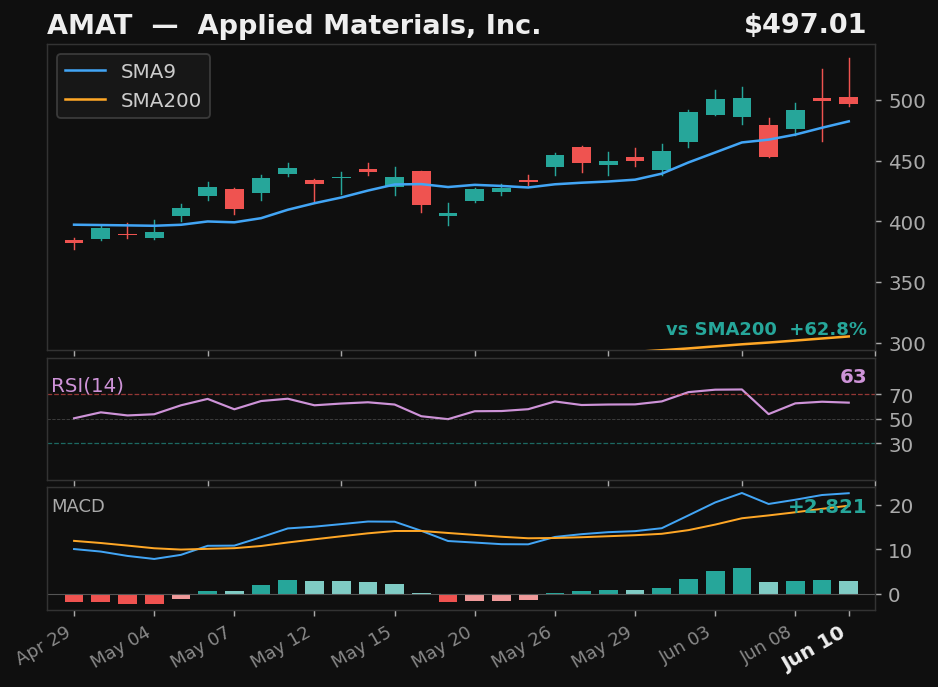
AMAT★
Applied Materials, Inc.
NASDAQ
- 9.7% pullback — full candle body above SMA9
- 62.8% above SMA200 — extended from trend
ExplosiveUpEmpirical
Returns
StockMktDiff
1D+11.2%+1.7%+9.5%
2D+14.1%+2.2%+11.9%
3D———
5D———
10D———
Explosive Up Setups1
click to enlarge
AMAT★
Applied Materials, Inc.
NASDAQ
- 9.7% pullback — 1 day below SMA9
- Prior rally: 11%
- 63% above SMA200 — strong structural position
ExplosiveUp
Exp Score55Days Below1Pullback%9.7
Returns
StockMktDiff
1D+11.2%+1.7%+9.5%
2D+14.1%+2.2%+11.9%
3D———
5D———
10D———
Empirical4
 click to enlarge
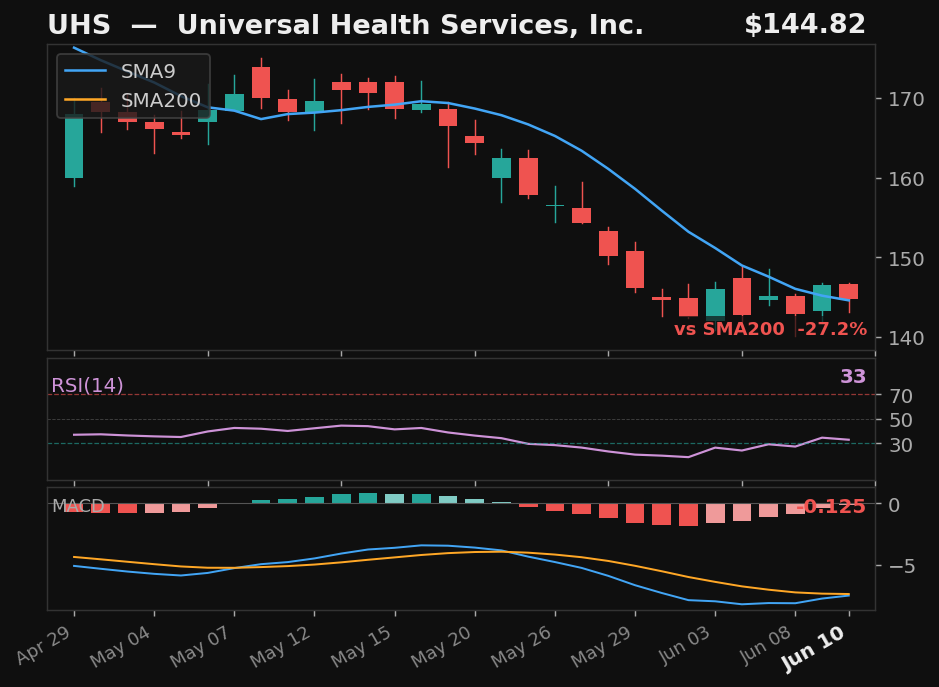
UHS
Universal Health Services, Inc.
NYSE
- 16.5% pullback — full candle body above SMA9
- MACD histogram rising while still negative — early recovery signal
- 27.2% below SMA200 — extended from trend
Empirical
Emp Score44.1Body Above✓
Returns
StockMktDiff
1D+0.8%+1.7%-0.9%
2D+1.1%+2.2%-1.1%
3D———
5D———
10D———
click to enlarge
AMAT★
Applied Materials, Inc.
NASDAQ
- 9.7% pullback — full candle body above SMA9
- 62.8% above SMA200 — extended from trend
Empirical
Emp Score43.2Body Above✓
Returns
StockMktDiff
1D+11.2%+1.7%+9.5%
2D+14.1%+2.2%+11.9%
3D———
5D———
10D———
 click to enlarge
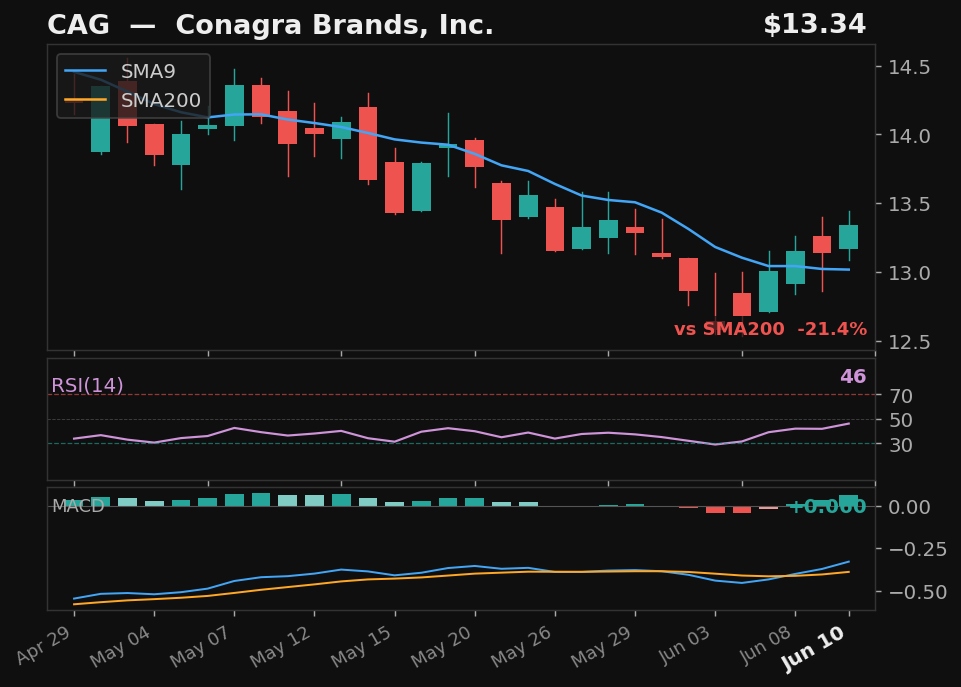
CAG
Conagra Brands, Inc.
NYSE
- 17.1% pullback — full candle body above SMA9
- RSI rising from 46
- MACD bullish cross 2 days ago
- 21.4% below SMA200 — extended from trend
Empirical
Emp Score40.7Body Above✓
Returns
StockMktDiff
1D+0.8%+1.7%-0.9%
2D+3.0%+2.2%+0.7%
3D———
5D———
10D———
 click to enlarge
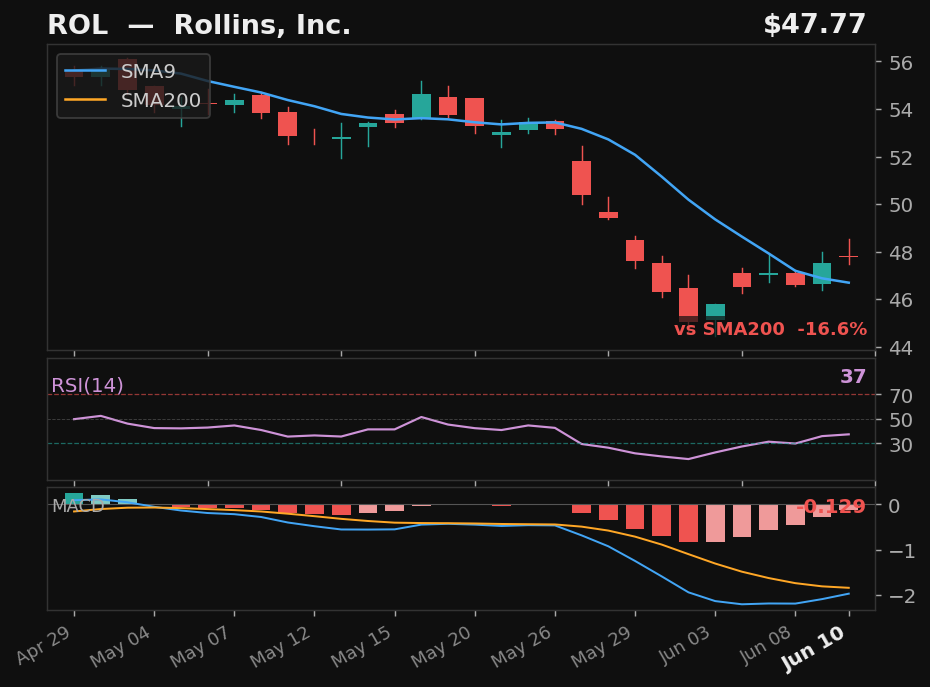
ROL
Rollins, Inc.
NYSE
- 16.2% pullback — full candle body above SMA9
- RSI rising from 37
- MACD histogram rising while still negative — early recovery signal
- 16.6% below SMA200 — extended from trend
Empirical
Emp Score40.4Body Above✓
Returns
StockMktDiff
1D-1.5%+1.7%-3.2%
2D-1.2%+2.2%-3.5%
3D———
5D———
10D———