Monday, June 22, 2026 · After Close
★ Highlights2
 click to enlarge
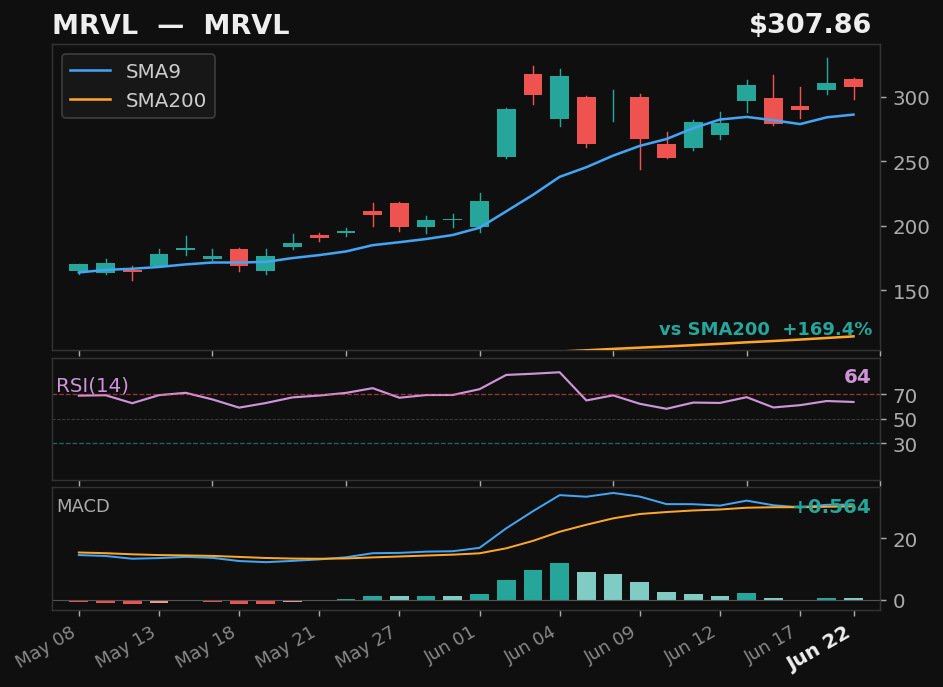
MRVL★
MRVL
NASDAQ
- 9.8% pullback — full candle body above SMA9
- 169.4% above SMA200 — extended from trend
ExplosiveUpEmpirical
Returns
StockMktDiff
1D———
2D———
3D———
5D———
10D———
results pending next close
 click to enlarge
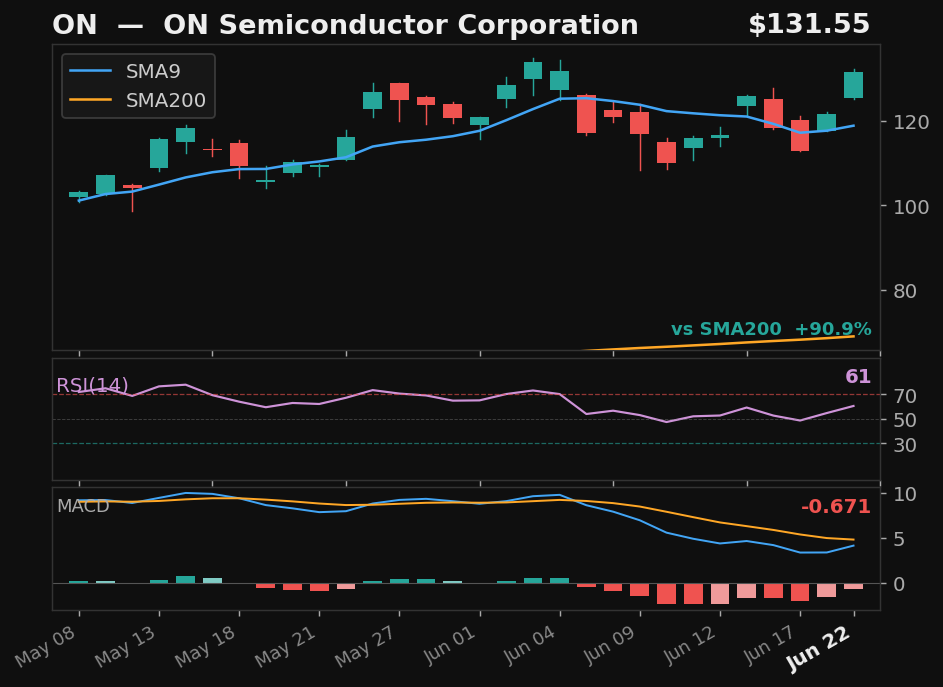
ON★
ON Semiconductor Corporation
NASDAQ
- 10.3% pullback — full candle body above SMA9
- RSI at 61 — confirmed recovery momentum
- MACD histogram rising while still negative — early recovery signal
- 90.9% above SMA200 — extended from trend
ExplosiveUpEmpirical
Returns
StockMktDiff
1D———
2D———
3D———
5D———
10D———
results pending next close
Explosive Up Setups2
click to enlarge
ON★
ON Semiconductor Corporation
NASDAQ
- 10.3% pullback — 2 days below SMA9
- Prior rally: 11%
- 91% above SMA200 — strong structural position
- MACD histogram rising from negative — early momentum signal
ExplosiveUp
Exp Score71Days Below2Pullback%10.3
Returns
StockMktDiff
1D———
2D———
3D———
5D———
10D———
results pending next close
click to enlarge
MRVL★
MRVL
NASDAQ
- 9.8% pullback — 1 day below SMA9
- Prior rally: 11%
- 169% above SMA200 — strong structural position
ExplosiveUp
Exp Score55Days Below1Pullback%9.8
Returns
StockMktDiff
1D———
2D———
3D———
5D———
10D———
results pending next close
Empirical4
 click to enlarge
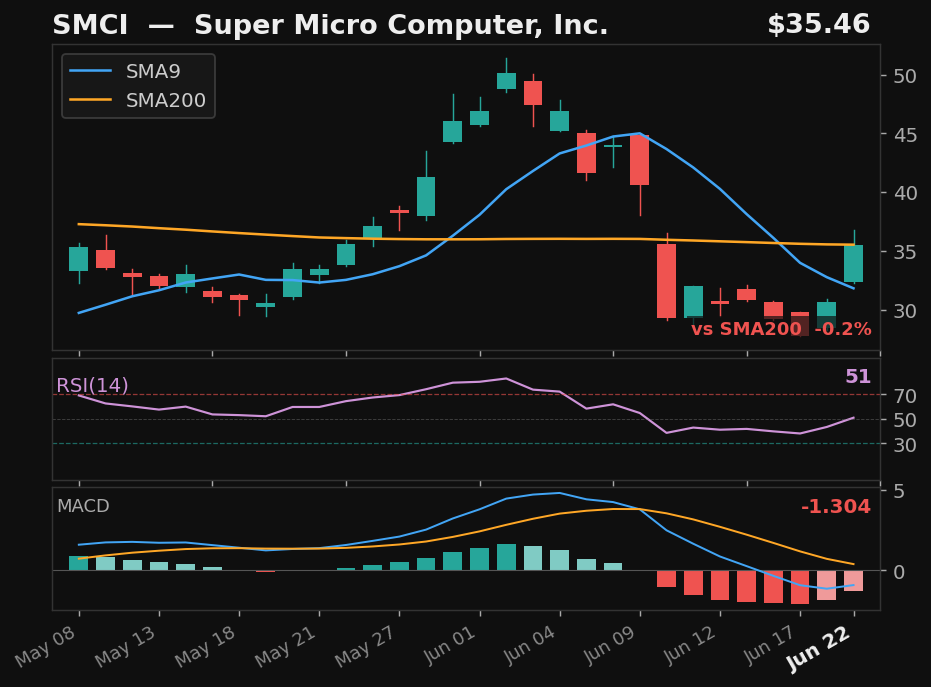
SMCI
Super Micro Computer, Inc.
NASDAQ
- 40.8% pullback over 10 days — full candle above SMA9
- RSI at 51, rising above 50
- MACD histogram rising while still negative — early recovery signal
Empirical
Emp Score87.6Body Above✓
Returns
StockMktDiff
1D———
2D———
3D———
5D———
10D———
results pending next close
click to enlarge
MRVL★
MRVL
NASDAQ
- 9.8% pullback — full candle body above SMA9
- 169.4% above SMA200 — extended from trend
Empirical
Emp Score75.4Body Above✓
Returns
StockMktDiff
1D———
2D———
3D———
5D———
10D———
results pending next close
click to enlarge
ON★
ON Semiconductor Corporation
NASDAQ
- 10.3% pullback — full candle body above SMA9
- RSI at 61 — confirmed recovery momentum
- MACD histogram rising while still negative — early recovery signal
- 90.9% above SMA200 — extended from trend
Empirical
Emp Score55.9Body Above✓
Returns
StockMktDiff
1D———
2D———
3D———
5D———
10D———
results pending next close
 click to enlarge
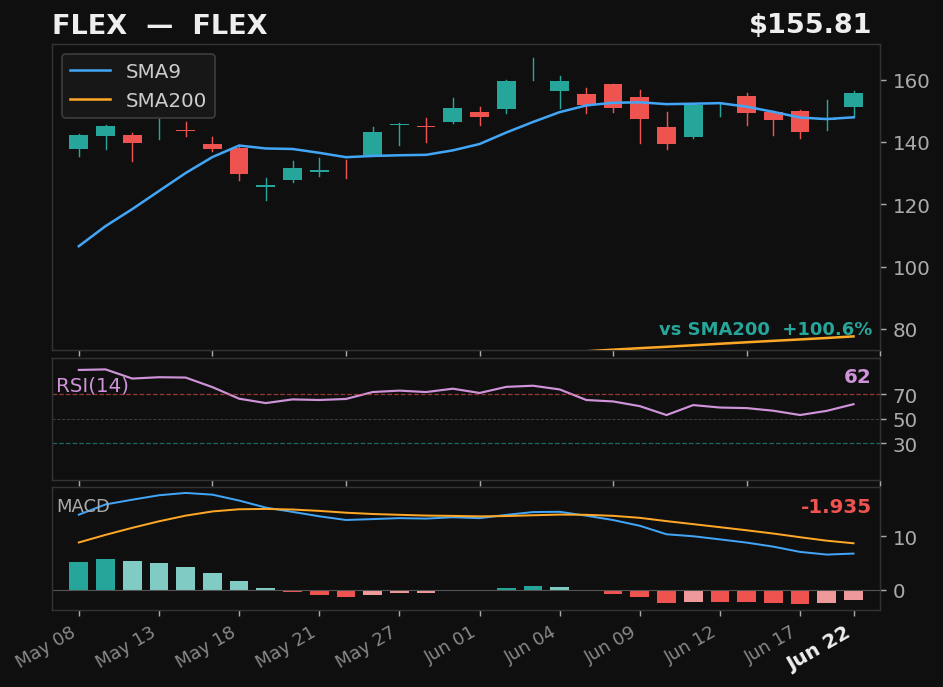
FLEX
FLEX
NASDAQ
- 8.2% pullback — full candle body above SMA9
- RSI at 62 — confirmed recovery momentum
- MACD histogram rising while still negative — early recovery signal
- 100.6% above SMA200 — extended from trend
Empirical
Emp Score54.6Body Above✓
Returns
StockMktDiff
1D———
2D———
3D———
5D———
10D———
results pending next close