Monday, March 2, 2026 · After Close
SwingTrader Setups
10 candidates
 click to enlarge
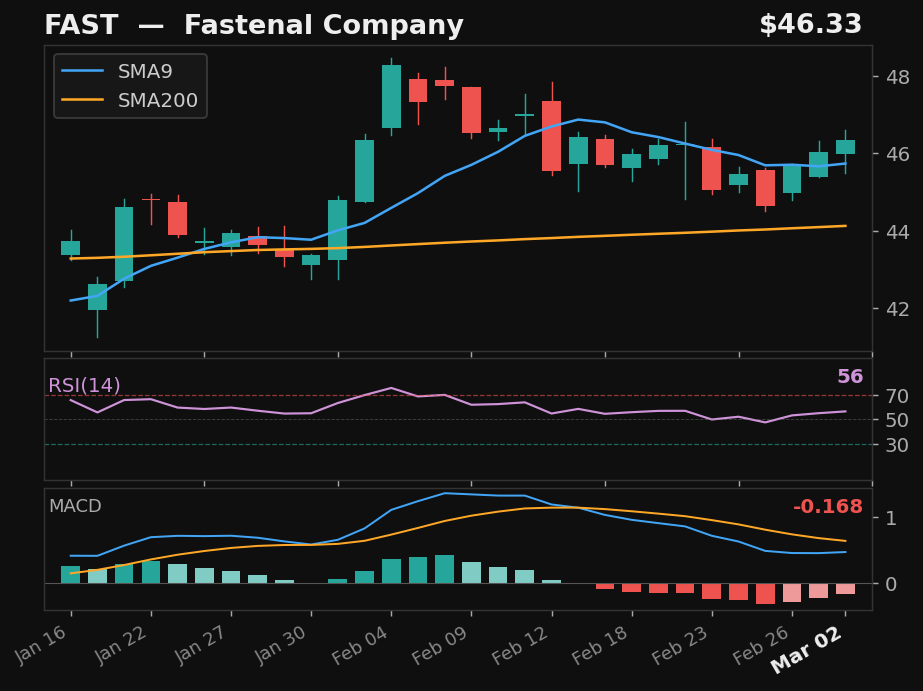
FAST
Fastenal Company
NASDAQ
- 5.1% pullback to SMA9
- Crossed above SMA9 — 2 days above
- RSI at 56, rising
- MACD histogram improving
Base✓Strict✓Score84.0
Returns
StockMktDiff
1D-0.2%-0.9%+0.7%
2D+0.2%-0.2%+0.4%
3D+2.1%-0.7%+2.8%
5D+1.0%-1.2%+2.2%
10D-1.4%-2.5%+1.1%
 click to enlarge
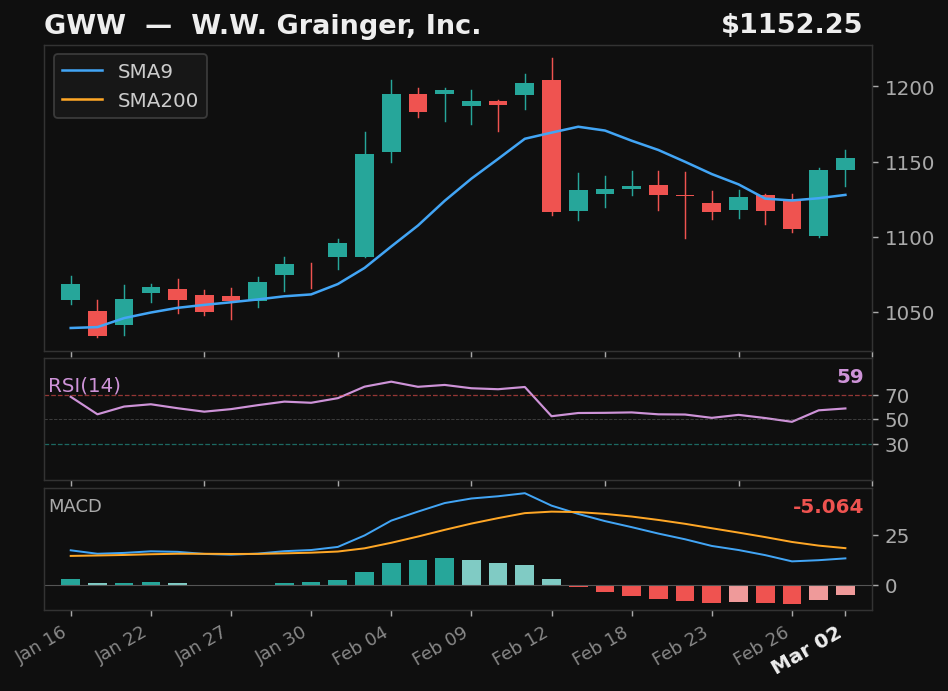
GWW
W.W. Grainger, Inc.
NYSE
- 8.1% pullback to SMA9
- Crossed above SMA9 — 2 days above
- RSI at 59, rising
- MACD histogram improving
Base✓Strict✓Score78.0
Returns
StockMktDiff
1D-0.1%-0.9%+0.8%
2D-0.3%-0.2%-0.1%
3D-0.6%-0.7%+0.2%
5D-3.2%-1.2%-2.0%
10D-8.0%-2.5%-5.4%
 click to enlarge
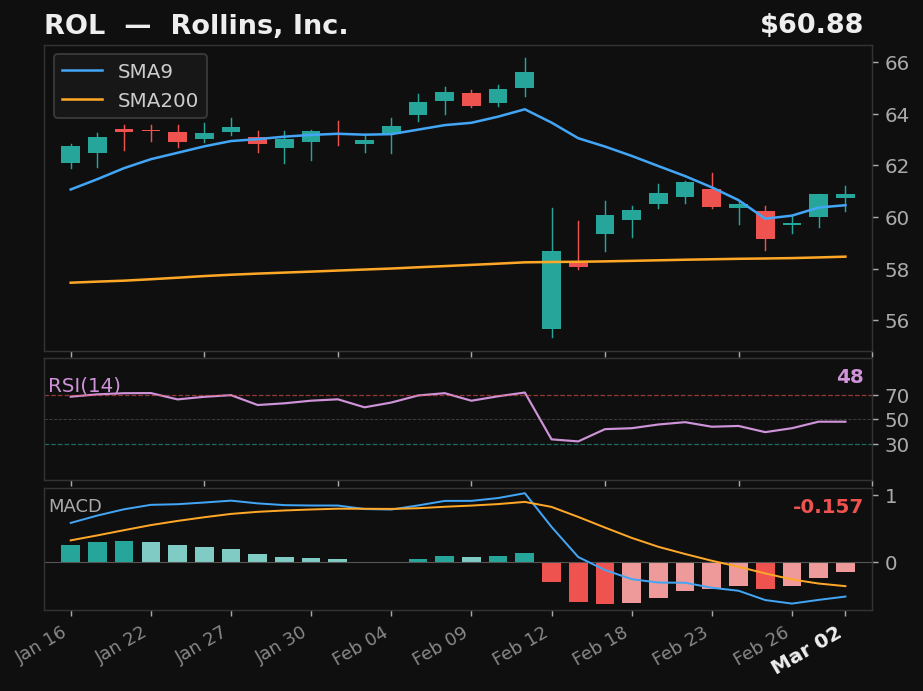
ROL
Rollins, Inc.
NYSE
- 11.5% pullback to SMA9
- Crossed above SMA9 — 2 days above
- MACD histogram improving
- Long-term uptrend intact
Base✓Strict✓Score67.0
Returns
StockMktDiff
1D-1.2%-0.9%-0.3%
2D-4.7%-0.2%-4.5%
3D-4.5%-0.7%-3.7%
5D-5.4%-1.2%-4.3%
10D-9.7%-2.5%-7.1%
 click to enlarge
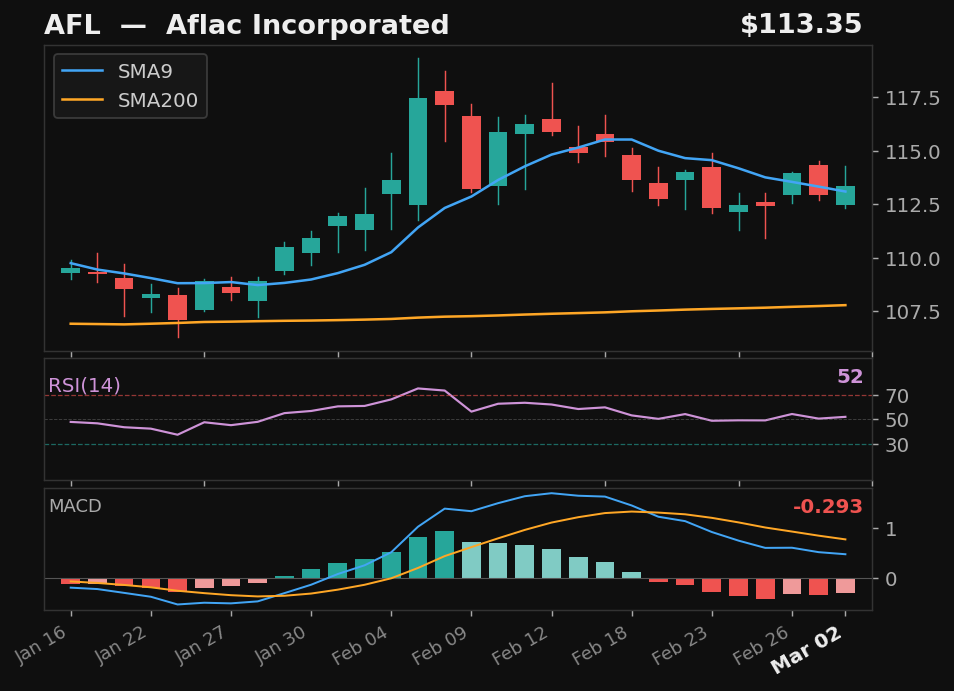
AFL
Aflac Incorporated
NYSE
- 3.0% pullback to SMA9 — 1 day
- Crossed back above SMA9 today
- RSI at 52, rising
- MACD histogram improving
Base✓Strict✗Score74.0
Returns
StockMktDiff
1D-0.8%-0.9%+0.1%
2D-0.8%-0.2%-0.6%
3D-2.0%-0.7%-1.3%
5D-2.8%-1.2%-1.6%
10D-3.7%-2.5%-1.2%
 click to enlarge
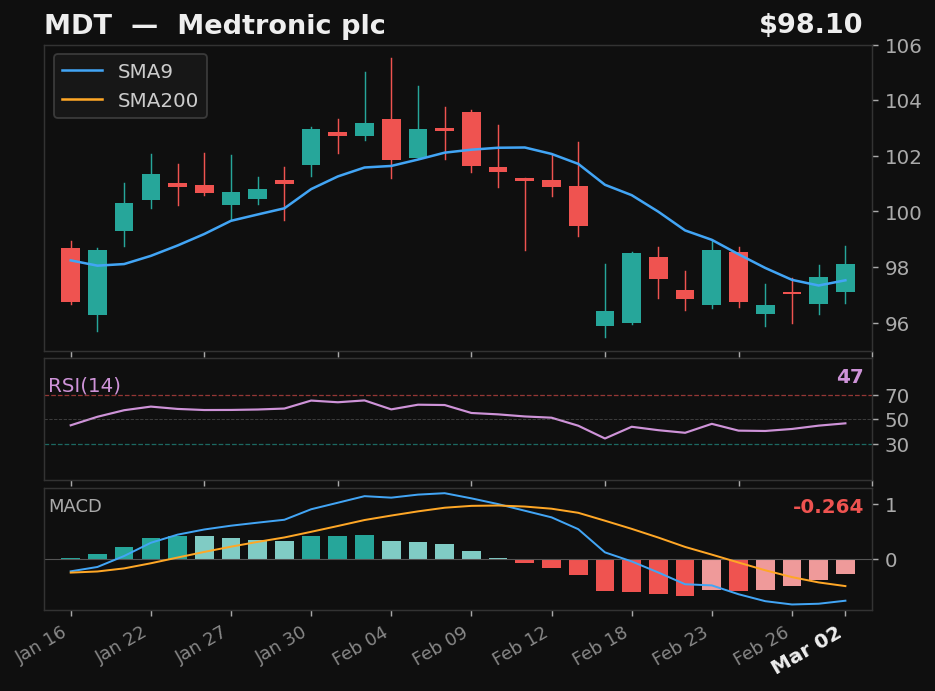
MDT
Medtronic plc
NYSE
- 6.3% pullback to SMA9
- Crossed above SMA9 — 2 days above
- RSI at 47, rising
- MACD histogram improving
Base✓Strict✗Score62.0
Returns
StockMktDiff
1D-1.4%-0.9%-0.5%
2D-2.5%-0.2%-2.4%
3D-5.2%-0.7%-4.4%
5D-6.9%-1.2%-5.7%
10D-10.1%-2.5%-7.5%
 click to enlarge
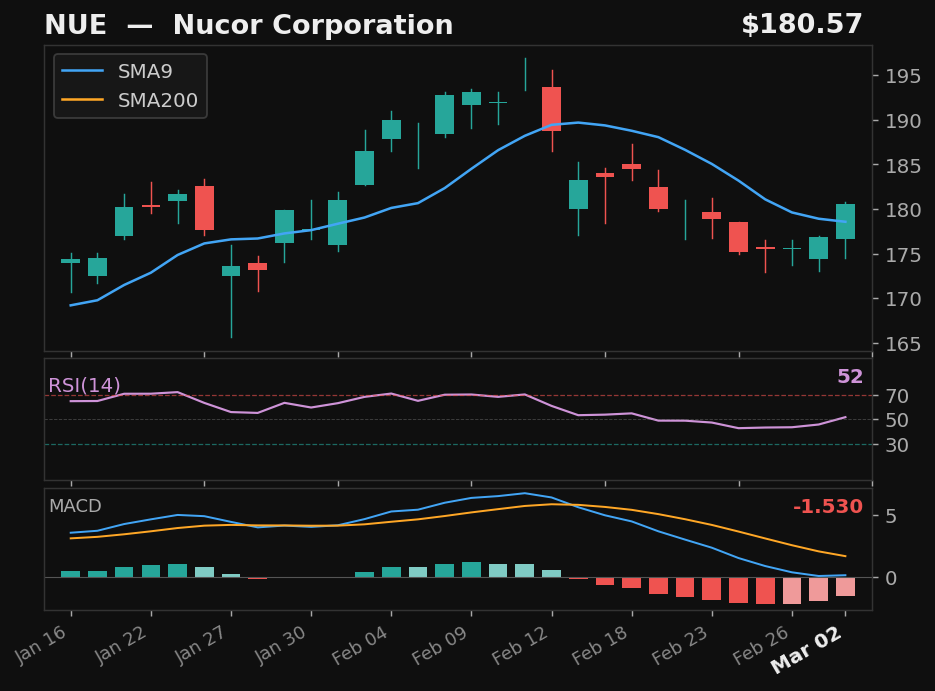
NUE
Nucor Corporation
NYSE
- 9.9% pullback to SMA9 over 11 days
- Crossed back above SMA9 today
- RSI at 52, rising
- MACD histogram improving
Base✓Strict✗Score60.0
Returns
StockMktDiff
1D-1.8%-0.9%-0.9%
2D-2.5%-0.2%-2.3%
3D-4.7%-0.7%-4.0%
5D-6.1%-1.2%-5.0%
10D-9.9%-2.5%-7.3%
 click to enlarge
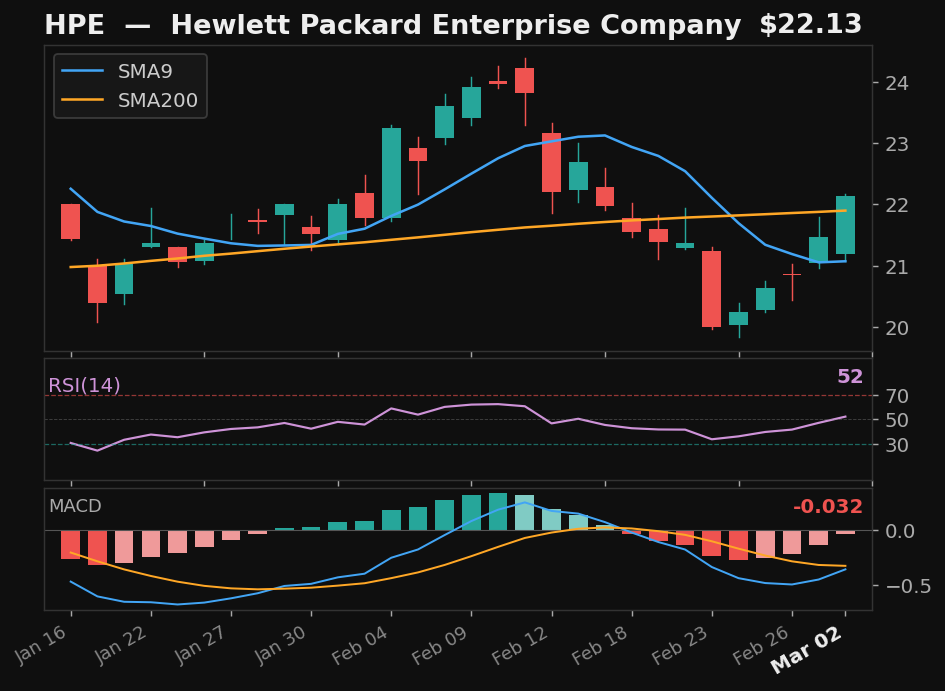
HPE
Hewlett Packard Enterprise Company
NYSE
- 16.0% pullback to SMA9
- Crossed above SMA9 — 2 days above
- RSI at 52, rising
- MACD histogram improving
Base✓Strict✗Score57.0
Returns
StockMktDiff
1D-2.2%-0.9%-1.3%
2D-2.6%-0.2%-2.4%
3D-3.0%-0.7%-2.2%
5D-1.4%-1.2%-0.3%
10D-1.3%-2.5%+1.3%
 click to enlarge
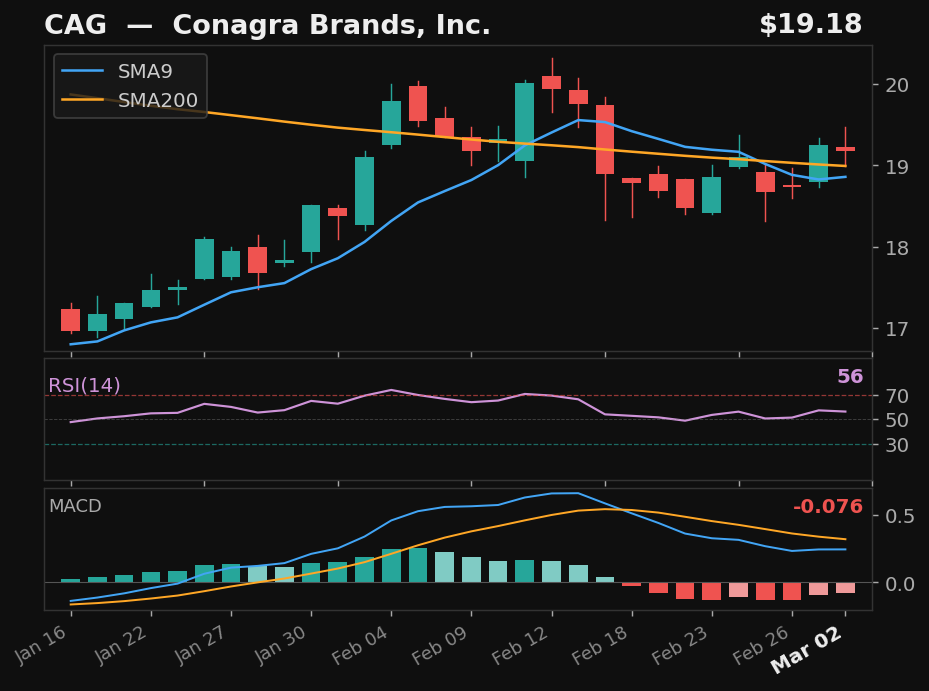
CAG
Conagra Brands, Inc.
NYSE
- 6.5% pullback to SMA9
- Crossed above SMA9 — 2 days above
- MACD histogram improving
Base✓Strict✗Score56.0
Returns
StockMktDiff
1D-1.1%-0.9%-0.3%
2D-1.7%-0.2%-1.5%
3D-3.0%-0.7%-2.2%
5D-2.7%-1.2%-1.5%
10D-16.4%-2.5%-13.9%
 click to enlarge
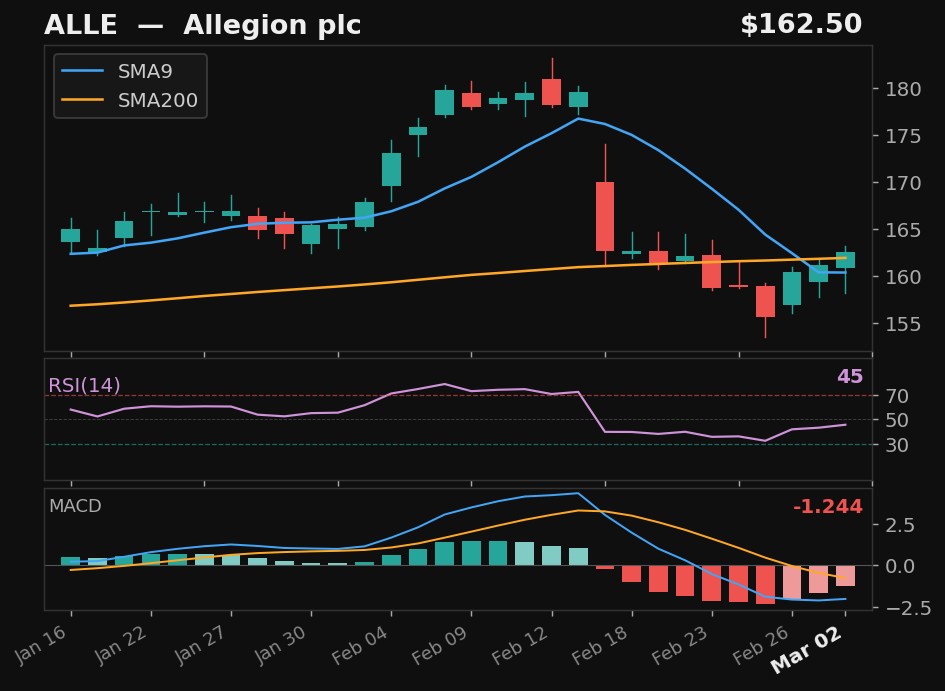
ALLE
Allegion plc
NYSE
- 13.3% pullback to SMA9
- Crossed above SMA9 — 2 days above
- RSI at 45, rising
- MACD histogram improving
Base✓Strict✗Score55.0
Returns
StockMktDiff
1D-2.5%-0.9%-1.7%
2D-3.6%-0.2%-3.4%
3D-6.3%-0.7%-5.6%
5D-7.6%-1.2%-6.4%
10D-10.3%-2.5%-7.7%
 click to enlarge
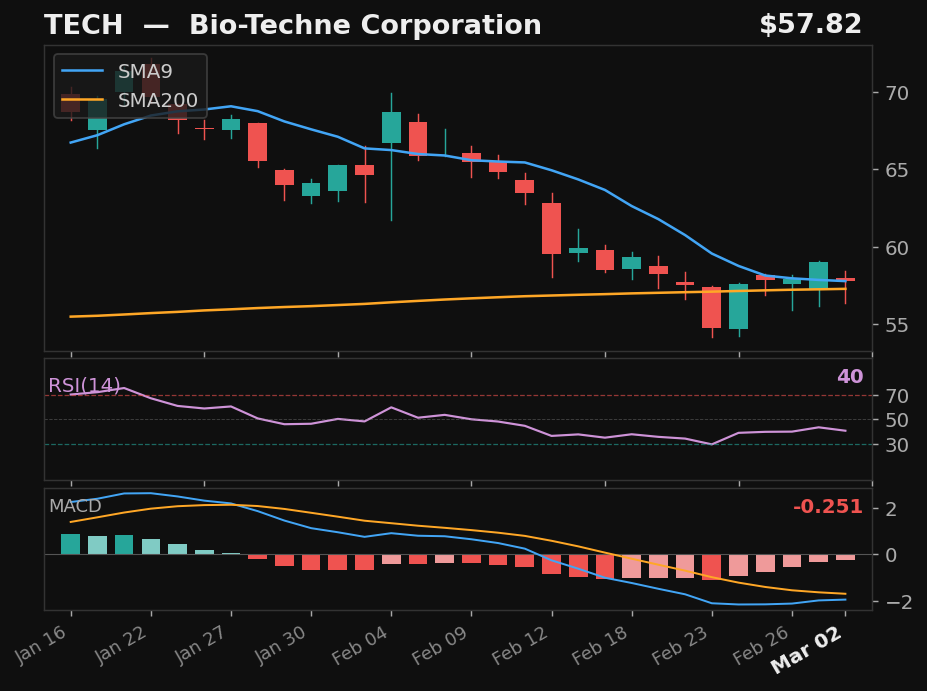
TECH
Bio-Techne Corporation
NASDAQ
- 18.0% pullback to SMA9
- Crossed above SMA9 — 2 days above
- MACD histogram improving
- Long-term uptrend intact
Base✓Strict✗Score48.0
Returns
StockMktDiff
1D-1.4%-0.9%-0.6%
2D+0.1%-0.2%+0.2%
3D-3.3%-0.7%-2.6%
5D-5.1%-1.2%-3.9%
10D-15.6%-2.5%-13.1%
Alternative Setups
3 candidates · ranked by Empirical Score
 click to enlarge
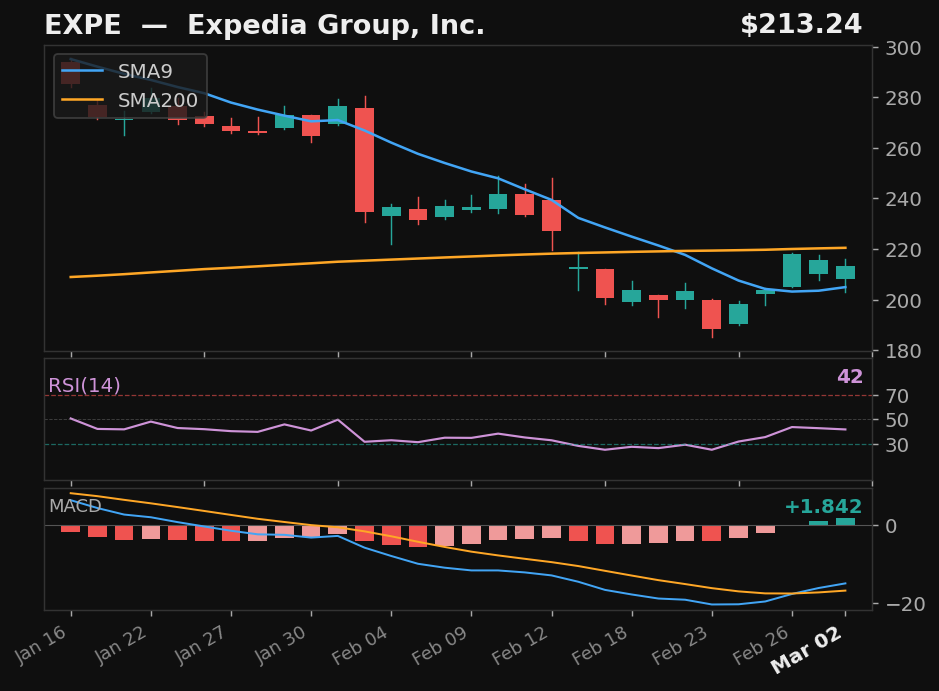
EXPE
Expedia Group, Inc.
NASDAQ
- 37.2% pullback — full candle body above SMA9
- MACD bullish cross 1 day ago
Emp Score75.3Body Above✓
Returns
StockMktDiff
1D+0.9%-0.9%+1.8%
2D+4.0%-0.2%+4.2%
3D+18.0%-0.7%+18.7%
5D+13.3%-1.2%+14.5%
10D+8.5%-2.5%+11.1%
 click to enlarge
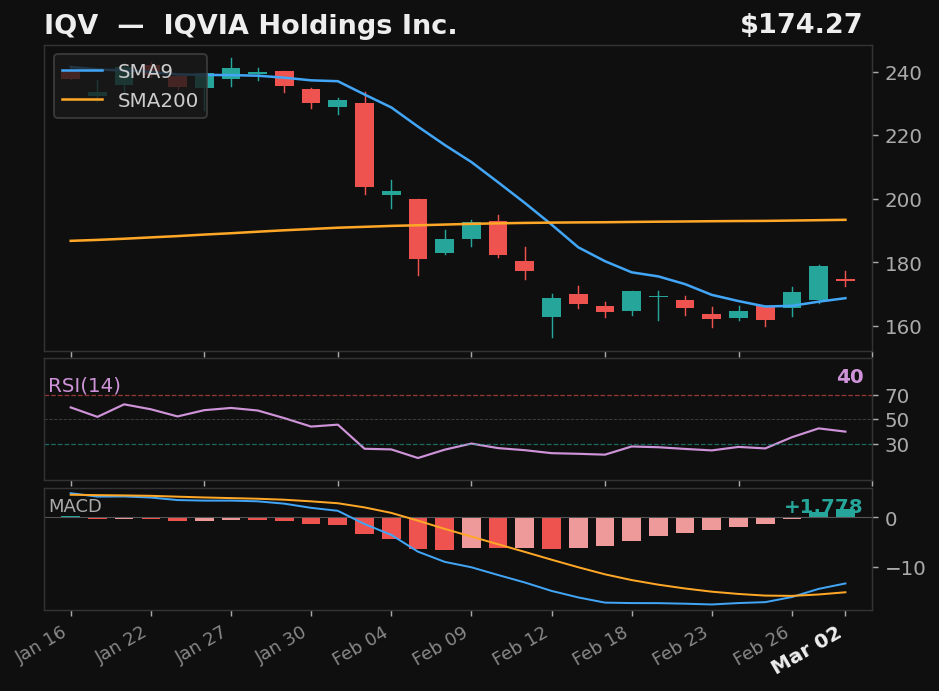
IQV
IQVIA Holdings Inc.
NYSE
- 32.5% pullback — full candle body above SMA9
- MACD bullish cross 1 day ago
- 9.9% below SMA200 — extended from trend
Emp Score67.9Body Above✓
Returns
StockMktDiff
1D-0.2%-0.9%+0.7%
2D+2.1%-0.2%+2.3%
3D+2.4%-0.7%+3.2%
5D+2.5%-1.2%+3.6%
10D-5.4%-2.5%-2.9%
 click to enlarge
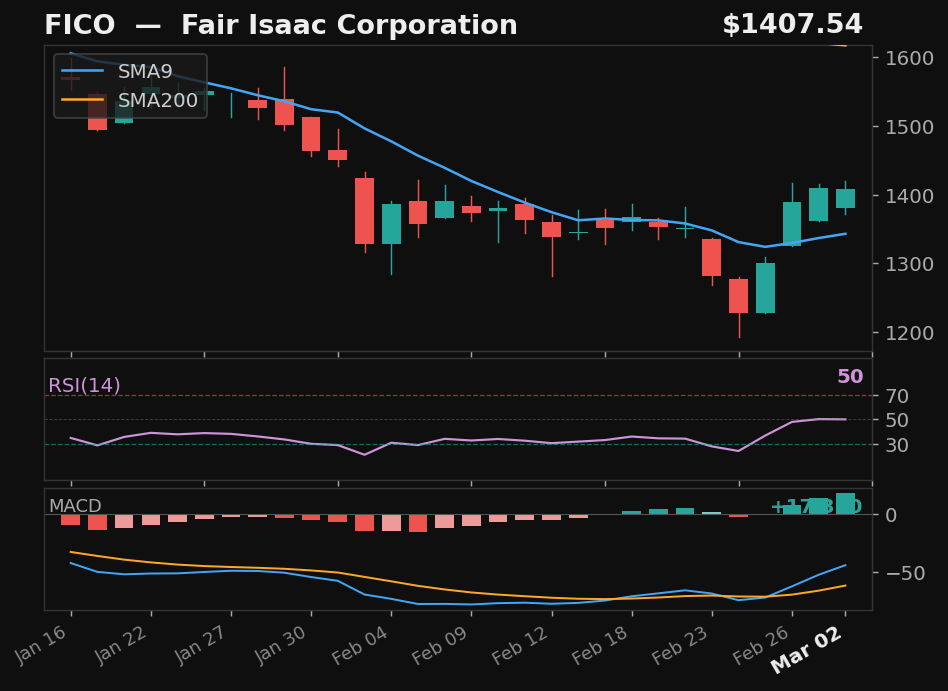
FICO
Fair Isaac Corporation
NYSE
- 30.7% pullback — full candle body above SMA9
- MACD bullish cross 2 days ago
- 13.0% below SMA200 — extended from trend
Emp Score65.3Body Above✓
Returns
StockMktDiff
1D+2.9%-0.9%+3.8%
2D+4.0%-0.2%+4.2%
3D+4.8%-0.7%+5.5%
5D+2.4%-1.2%+3.6%
10D-17.5%-2.5%-15.0%