Tuesday, March 3, 2026 · After Close
SwingTrader Setups
2 candidates
 click to enlarge
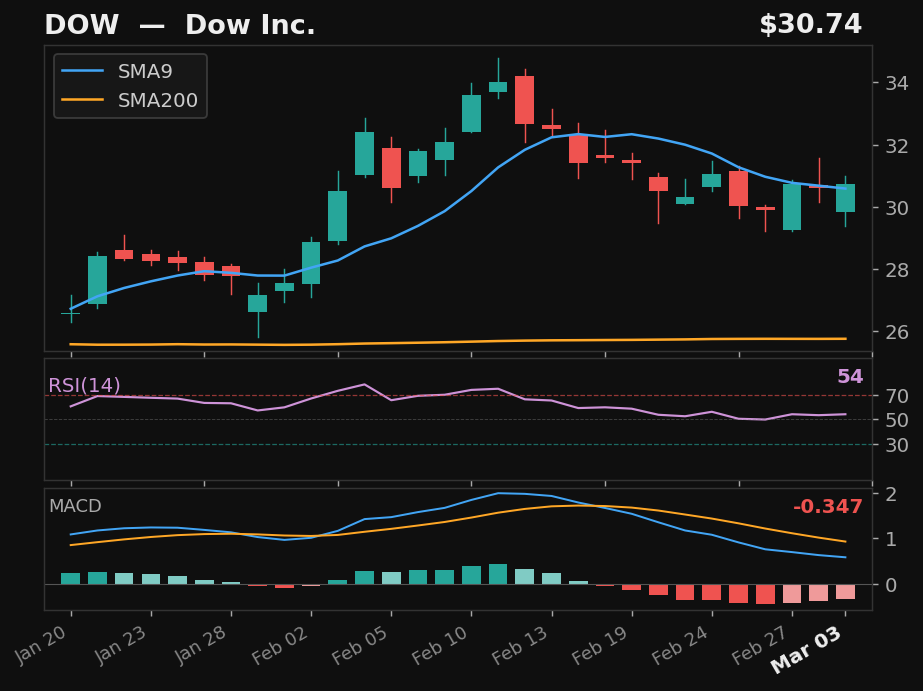
DOW
Dow Inc.
NYSE
- 8.0% pullback to SMA9 over 10 days
- Crossed back above SMA9 today
- RSI at 54, rising
- MACD histogram improving
Base✓Strict✗Score62.0
Returns
StockMktDiff
1D+5.2%+0.7%+4.5%
2D+9.7%+0.1%+9.6%
3D+8.3%-1.2%+9.4%
5D+10.2%-0.5%+10.7%
10D+20.1%-1.4%+21.5%
 click to enlarge
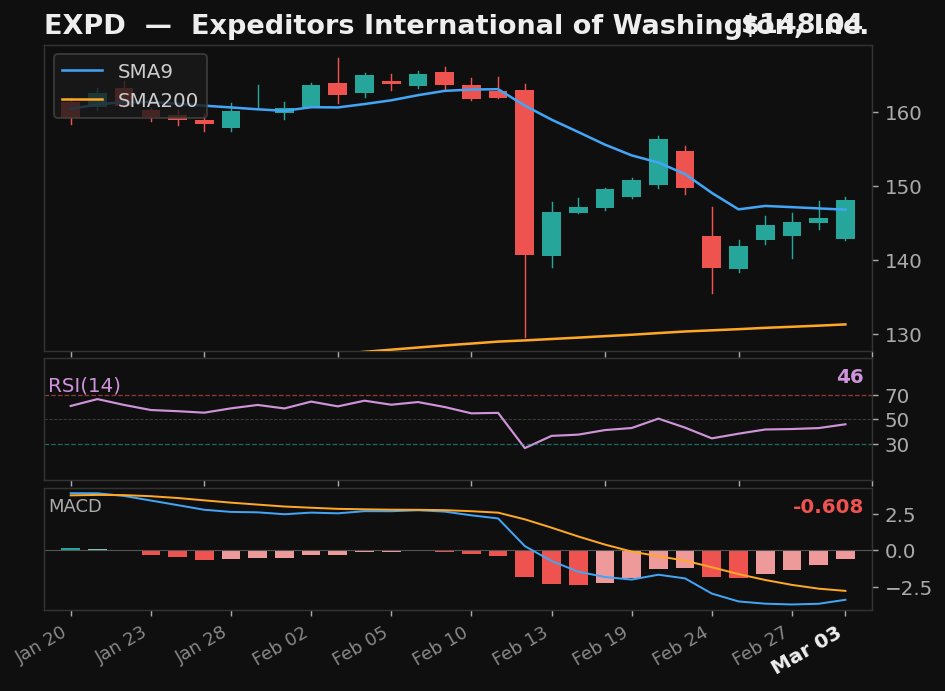
EXPD
Expeditors International of Washington, Inc.
NYSE
- 15.2% pullback to SMA9 over 6 days
- Crossed back above SMA9 today
- RSI at 46, rising
- MACD histogram improving
Base✓Strict✗Score58.0
Returns
StockMktDiff
1D-0.8%+0.7%-1.5%
2D-0.9%+0.1%-1.0%
3D-0.8%-1.2%+0.4%
5D-4.5%-0.5%-4.0%
10D-3.3%-1.4%-1.9%
Alternative Setups
3 candidates · ranked by Empirical Score
 click to enlarge
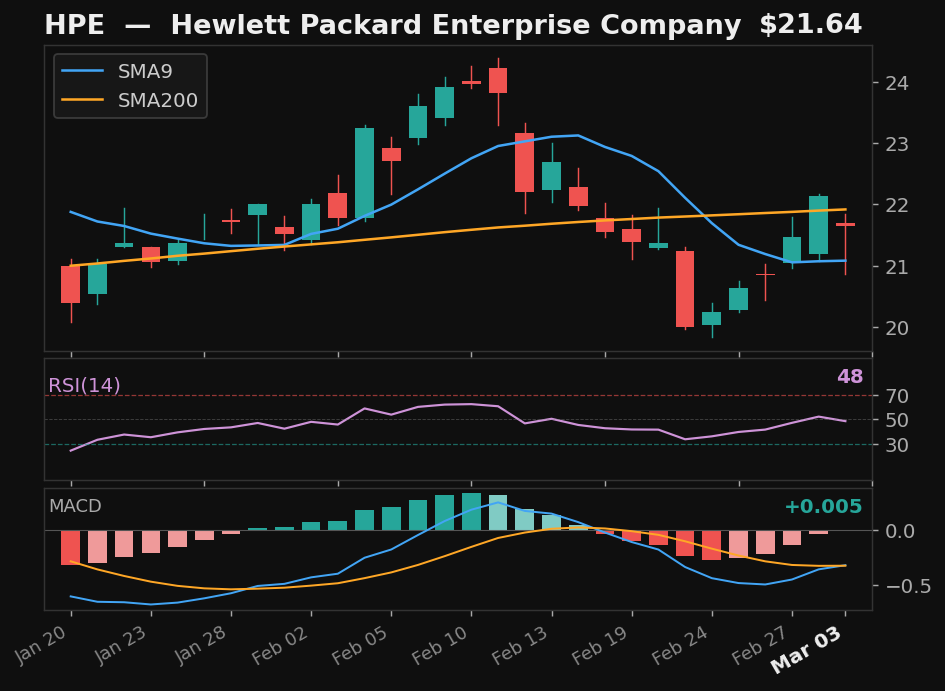
HPE
Hewlett Packard Enterprise Company
NYSE
- 16.0% pullback — full candle body above SMA9
Emp Score32.4Body Above✓
Returns
StockMktDiff
1D-0.4%+0.7%-1.1%
2D-0.8%+0.1%-0.9%
3D-2.4%-1.2%-1.2%
5D-2.5%-0.5%-2.0%
10D+0.1%-1.4%+1.5%
 click to enlarge
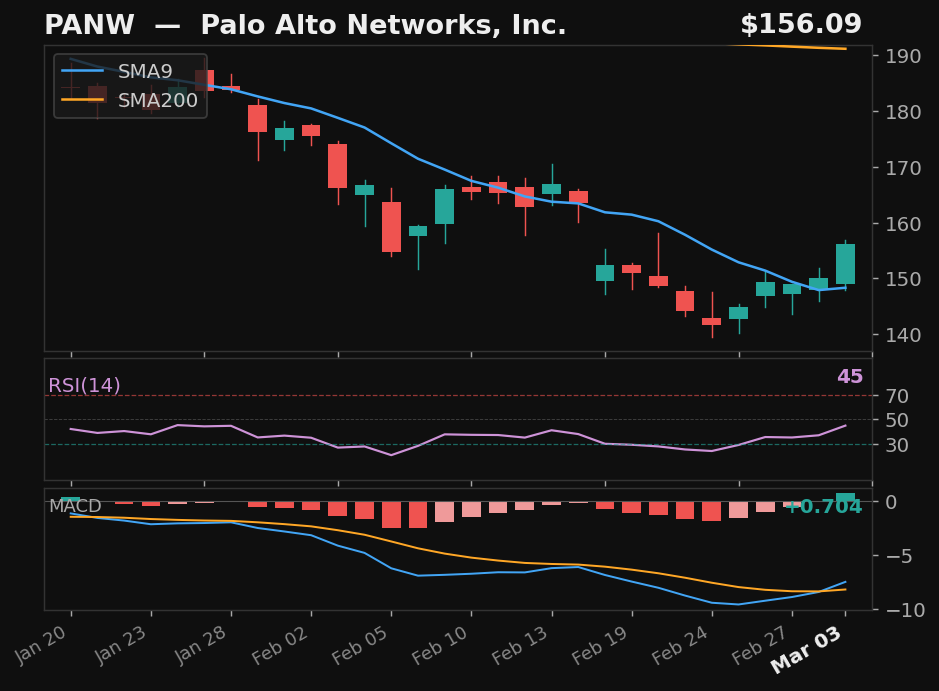
PANW
Palo Alto Networks, Inc.
NASDAQ
- 13.4% pullback — full candle body above SMA9
- RSI rising from 45
- 18.3% below SMA200 — extended from trend
Emp Score32.2Body Above✓
Returns
StockMktDiff
1D+1.6%+0.7%+0.9%
2D+4.5%+0.1%+4.4%
3D+5.7%-1.2%+6.9%
5D+6.1%-0.5%+6.5%
10D+8.4%-1.4%+9.8%
 click to enlarge
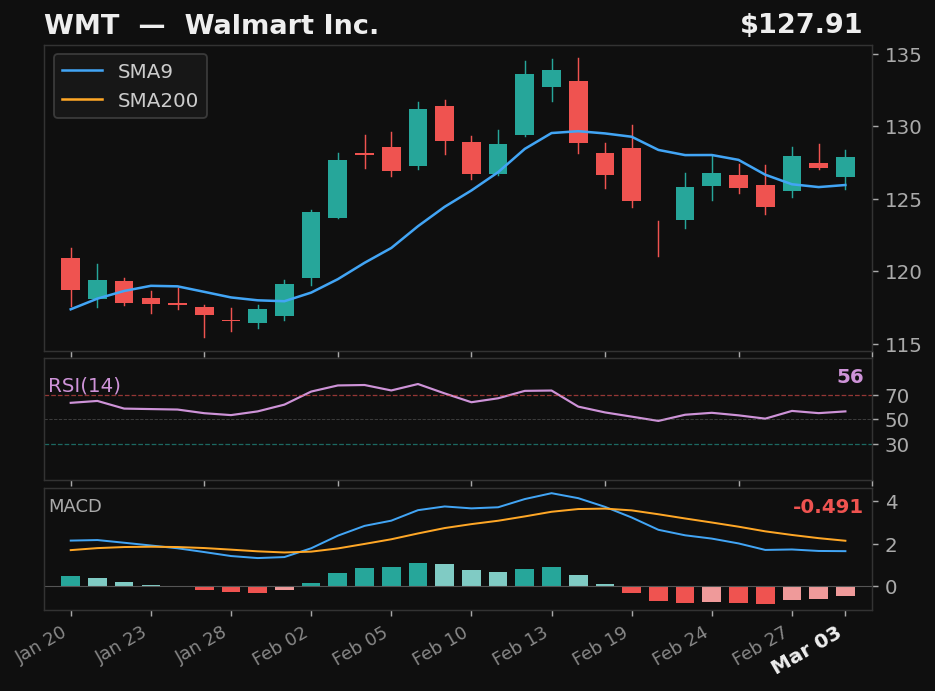
WMT
Walmart Inc.
NASDAQ
- 8.1% pullback — full candle body above SMA9
- RSI at 56 — confirmed recovery momentum
- MACD histogram rising while still negative — early recovery signal
- 20.3% above SMA200 — extended from trend
Emp Score30.4Body Above✓
Returns
StockMktDiff
1D-0.1%+0.7%-0.8%
2D-3.6%+0.1%-3.7%
3D-3.2%-1.2%-2.0%
5D-2.2%-0.5%-1.7%
10D-2.2%-1.4%-0.8%