Friday, March 6, 2026 · After Close
SwingTrader Setups
3 candidates
 click to enlarge
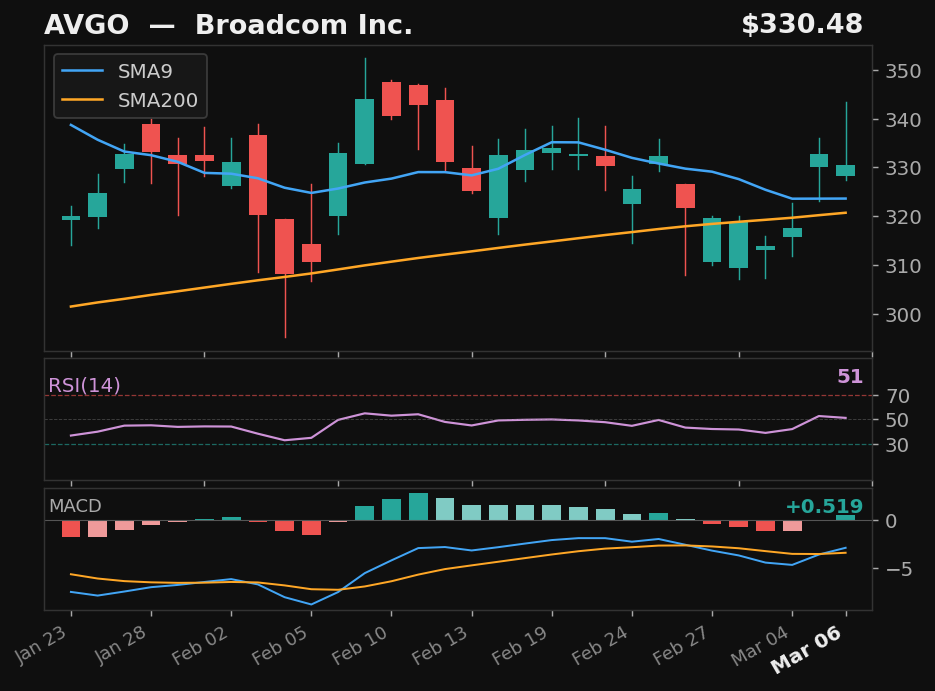
AVGO
Broadcom Inc.
NASDAQ
- 6.0% pullback to SMA9
- Crossed above SMA9 — 2 days above
- MACD histogram improving
- Long-term uptrend intact
Base✓Strict✓Score78.0
Returns
StockMktDiff
1D+4.6%+0.9%+3.7%
2D+3.7%+0.7%+2.9%
3D+3.4%+0.6%+2.8%
5D-2.5%-1.5%-1.0%
10D-6.0%-3.5%-2.5%
 click to enlarge
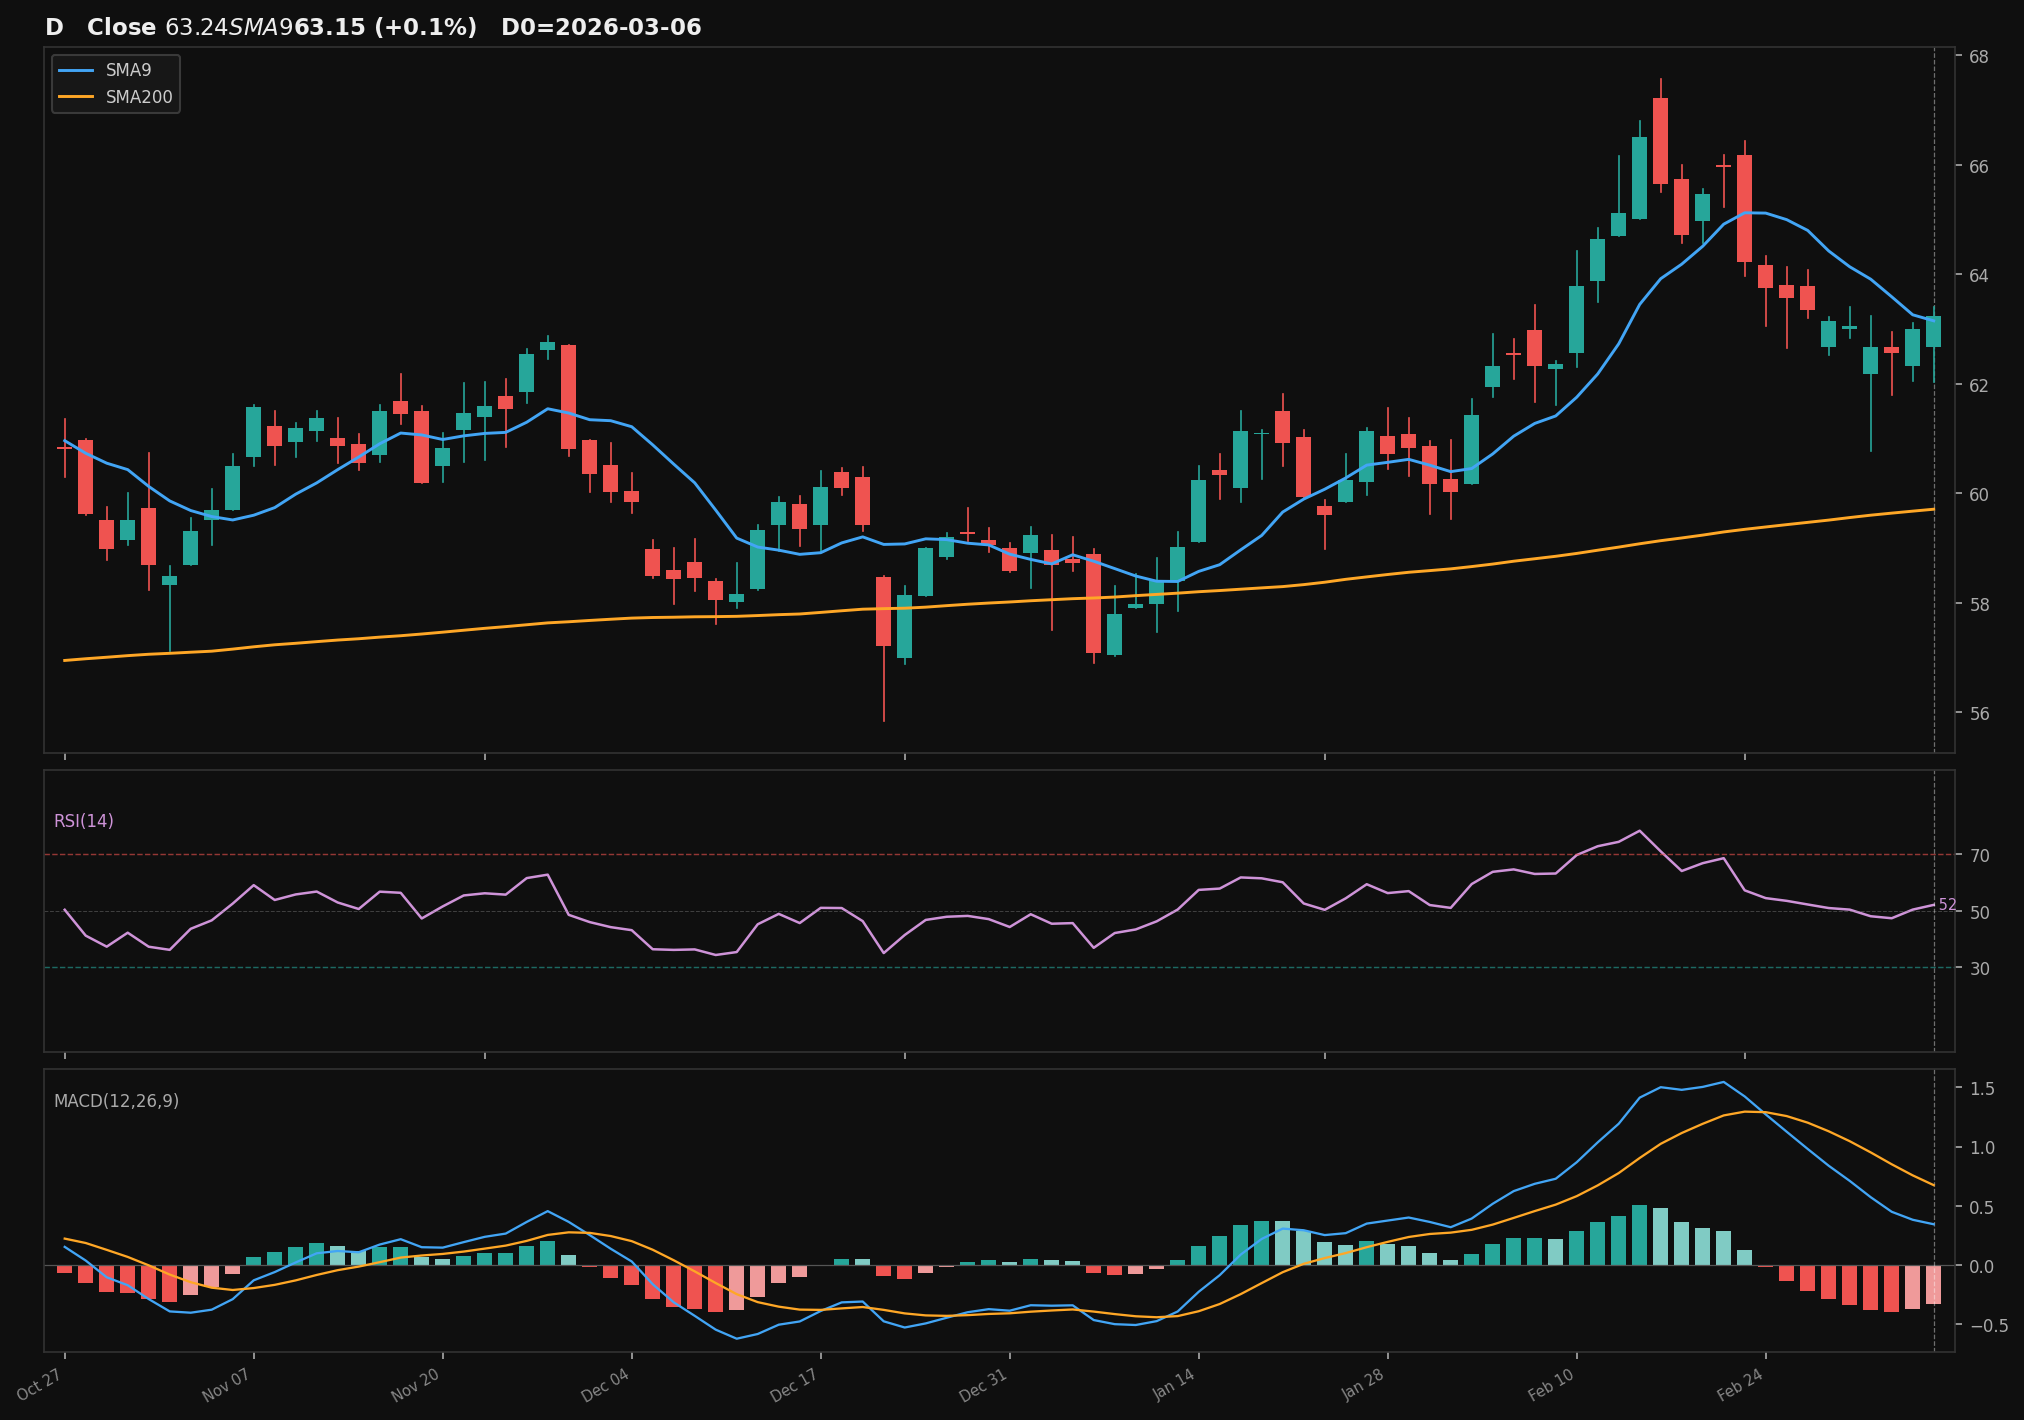
D
Dominion Energy, Inc.
NYSE
- 5.1% pullback to SMA9 over 9 days
- Crossed back above SMA9 today
- RSI at 52, rising
- MACD histogram improving
Base✓Strict✗Score70.0
Returns
StockMktDiff
1D-0.5%+0.9%-1.4%
2D-0.8%+0.7%-1.5%
3D-1.6%+0.6%-2.2%
5D-0.0%-1.5%+1.5%
10D-6.1%-3.5%-2.6%
 click to enlarge
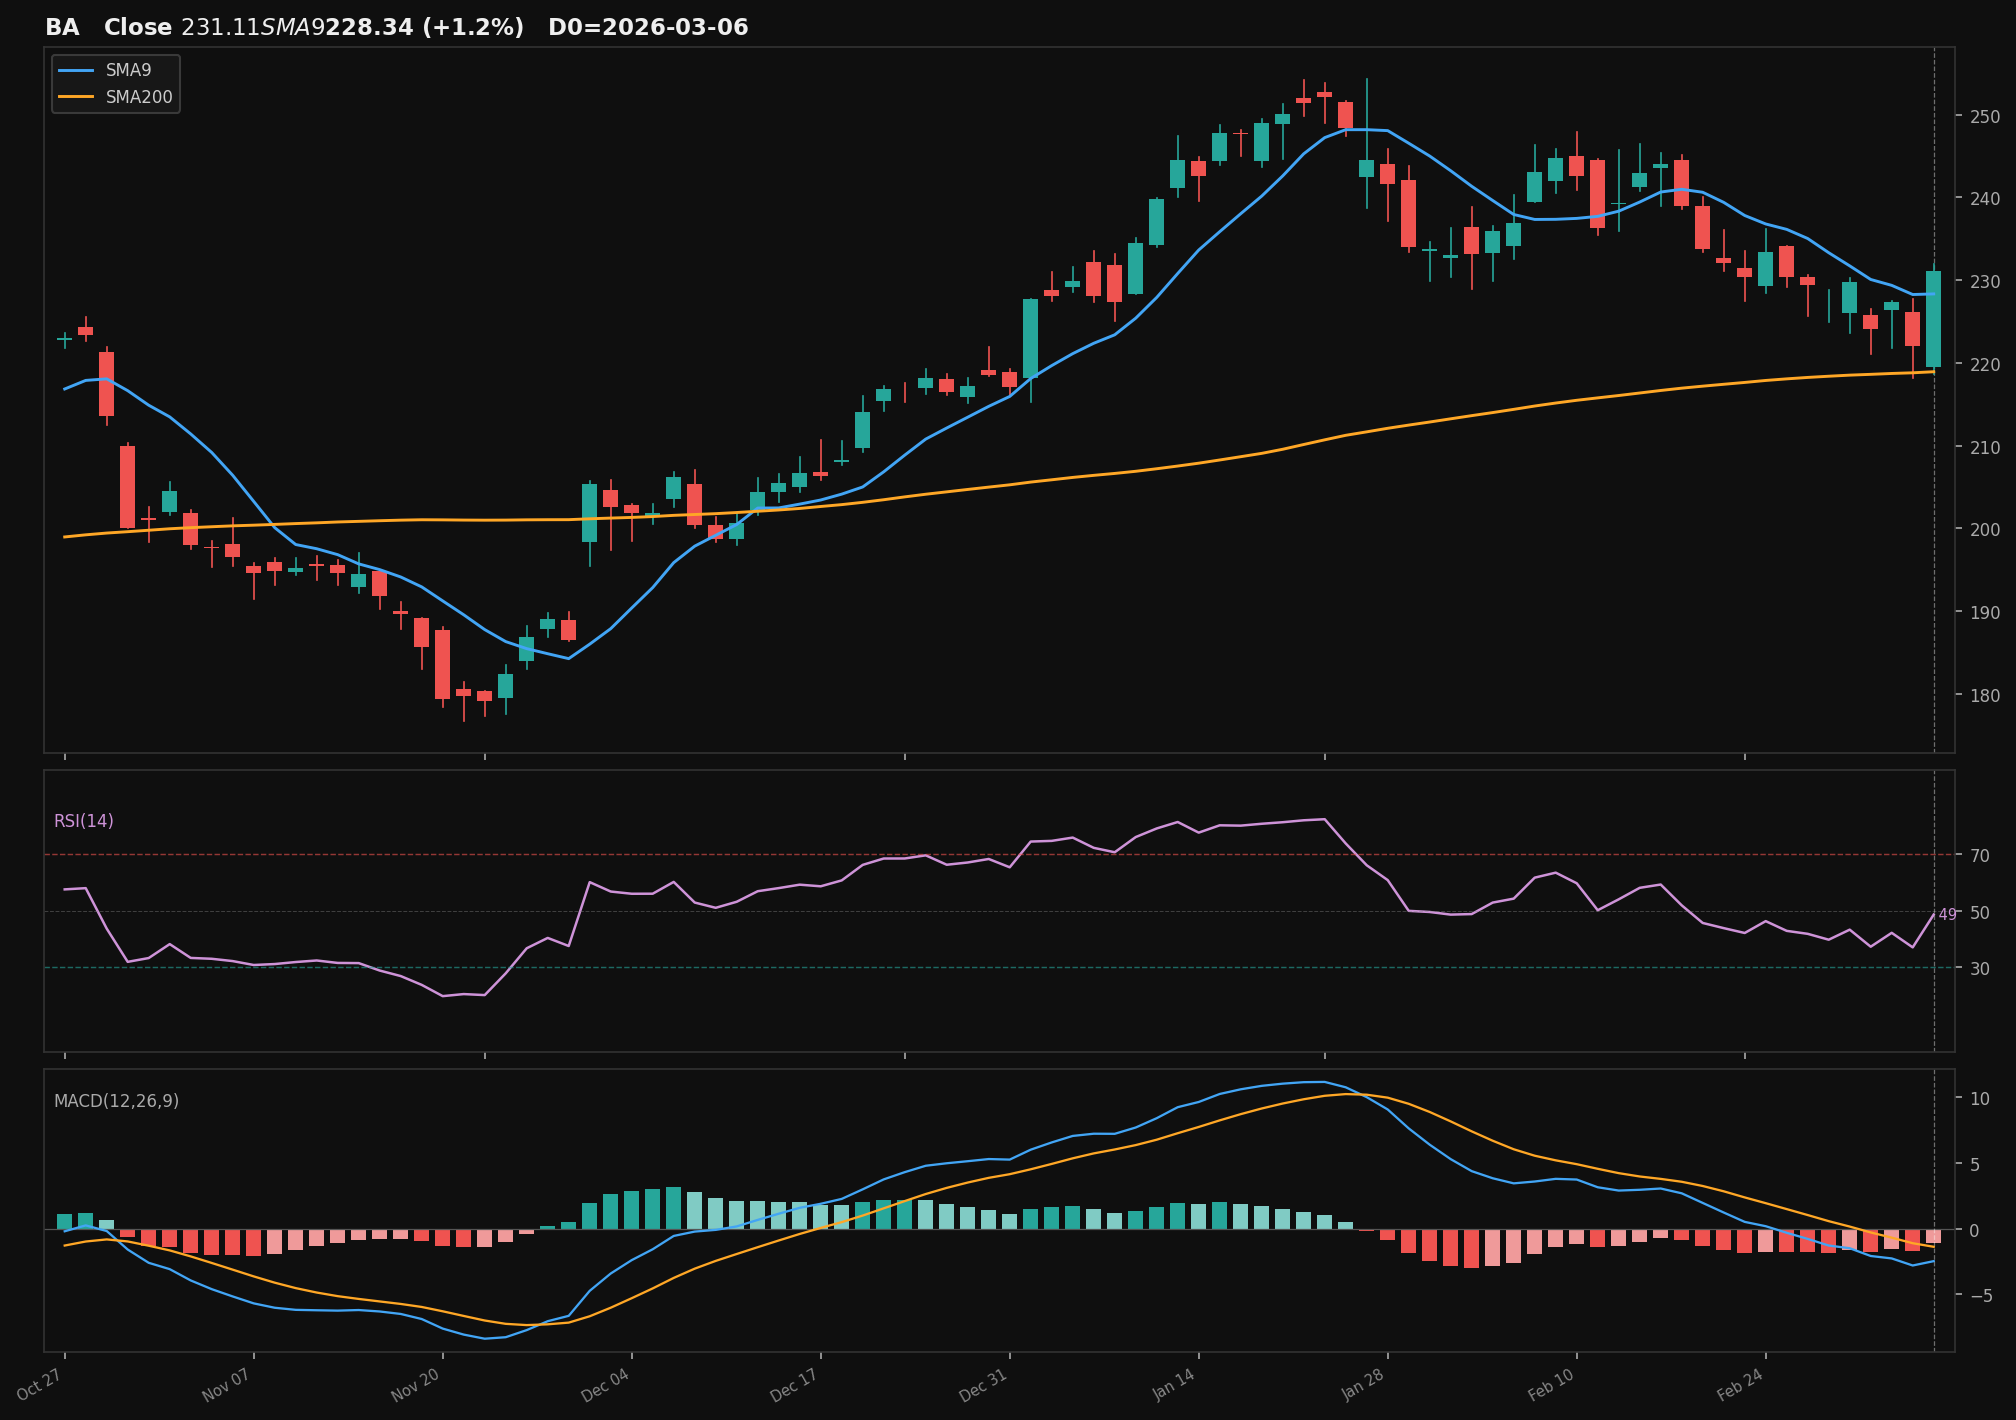
BA
The Boeing Company
NYSE
- 9.0% pullback to SMA9 over 12 days
- Crossed back above SMA9 today
- RSI at 49, rising
- MACD histogram improving
Base✓Strict✗Score60.0
Returns
StockMktDiff
1D-2.6%+0.9%-3.5%
2D-5.8%+0.7%-6.5%
3D-7.4%+0.6%-7.9%
5D-9.2%-1.5%-7.7%
10D-15.6%-3.5%-12.0%
Alternative Setups
3 candidates · ranked by Empirical Score
 click to enlarge
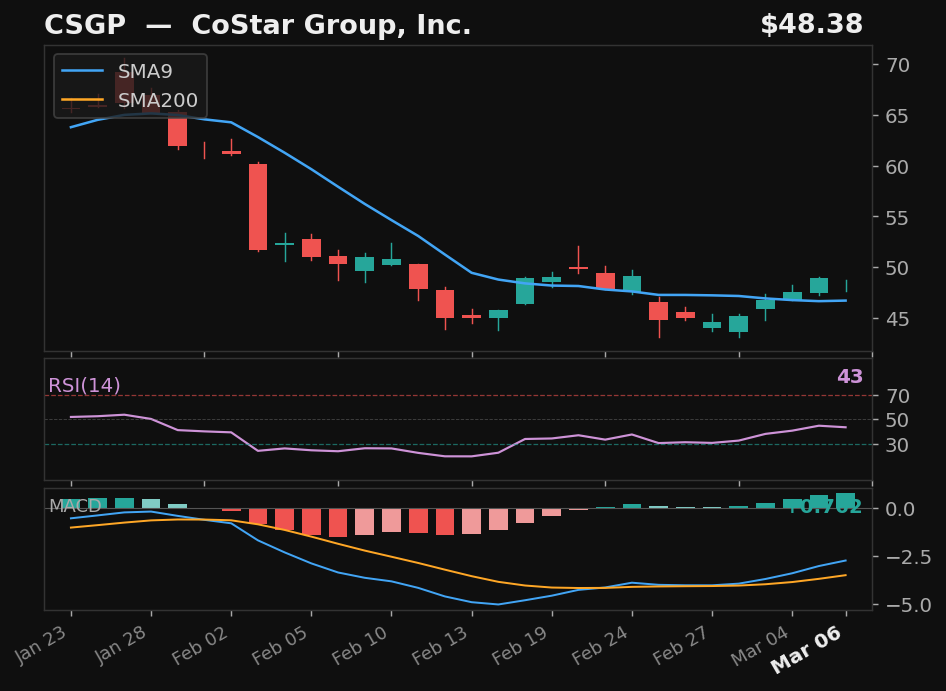
CSGP
CoStar Group, Inc.
NASDAQ
- 9.2% pullback — full candle body above SMA9
- 34.7% below SMA200 — extended from trend
Emp Score28.8Body Above✓
Returns
StockMktDiff
1D+0.1%+0.9%-0.8%
2D-4.2%+0.7%-5.0%
3D-6.3%+0.6%-6.9%
5D-9.8%-1.5%-8.3%
10D-11.3%-3.5%-7.8%
 click to enlarge
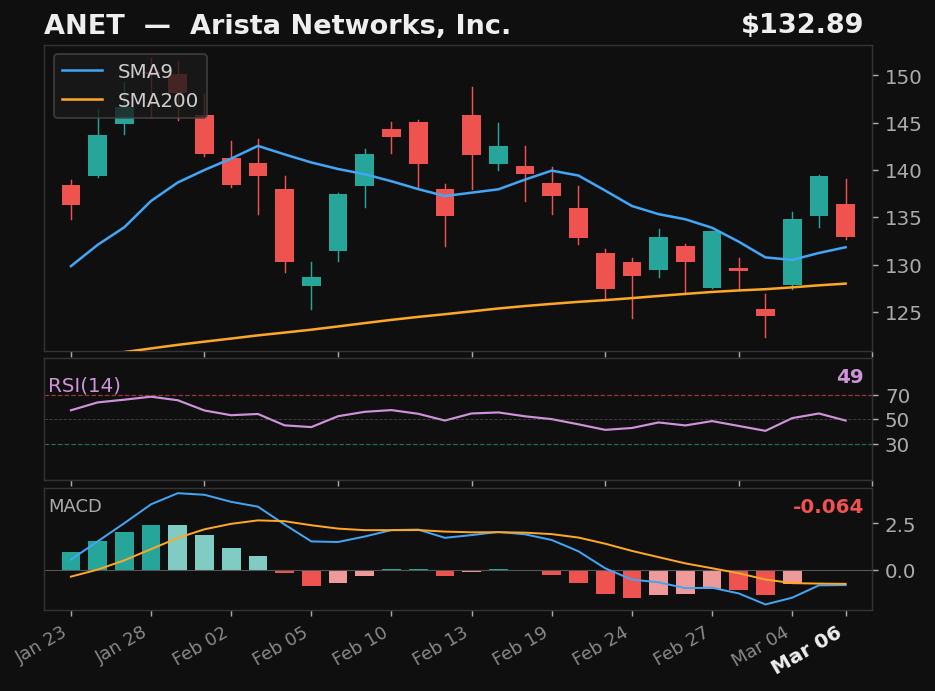
ANET
Arista Networks, Inc.
NYSE
- 10.7% pullback — full candle body above SMA9
- MACD histogram rising while still negative — early recovery signal
Emp Score25.6Body Above✓
Returns
StockMktDiff
1D+3.2%+0.9%+2.3%
2D+5.1%+0.7%+4.4%
3D+4.0%+0.6%+3.4%
5D+0.5%-1.5%+2.0%
10D-1.3%-3.5%+2.3%
 click to enlarge
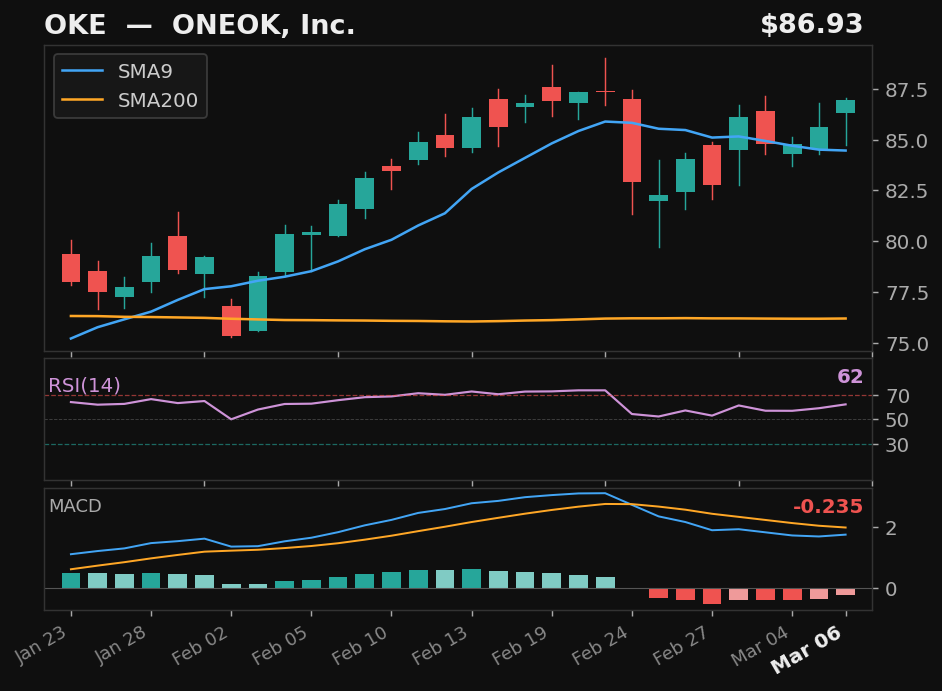
OKE
ONEOK, Inc.
NYSE
- 5.8% pullback — full candle body above SMA9
- RSI at 62 — confirmed recovery momentum
- MACD histogram rising while still negative — early recovery signal
- 14.1% above SMA200 — extended from trend
Emp Score23.8Body Above✓
Returns
StockMktDiff
1D-1.1%+0.9%-2.0%
2D-2.6%+0.7%-3.3%
3D-1.3%+0.6%-1.9%
5D-1.8%-1.5%-0.3%
10D+2.6%-3.5%+6.2%