Thursday, March 5, 2026 · After Close
SwingTrader Setups
3 candidates
 click to enlarge
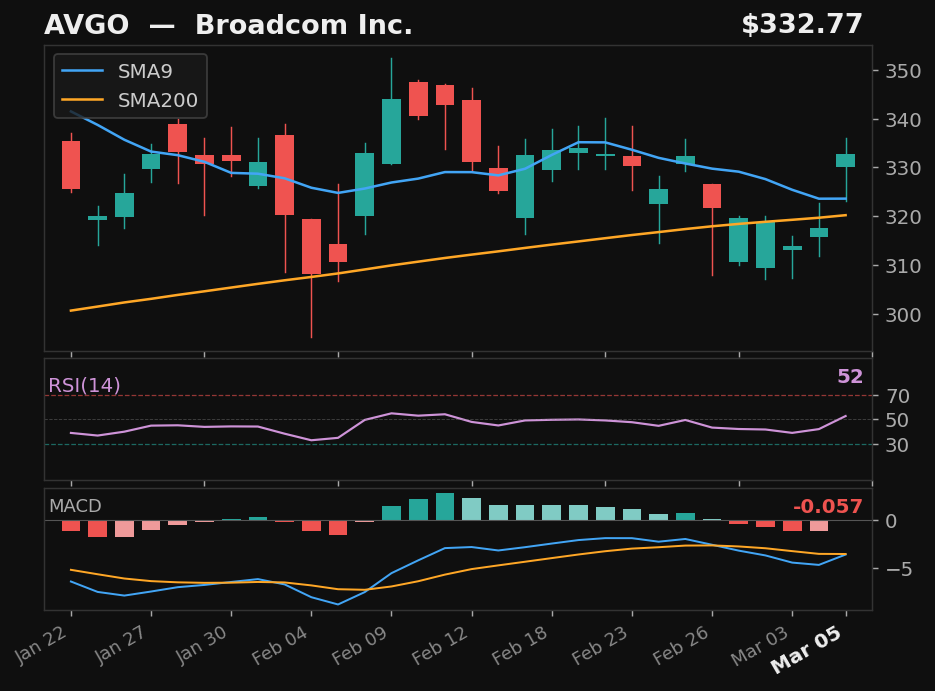
AVGO
Broadcom Inc.
NASDAQ
- 6.0% pullback to SMA9 over 5 days
- Crossed back above SMA9 today
- RSI at 52, rising
- MACD histogram improving
Base✓Strict✓Score88.0
Returns
StockMktDiff
1D-0.7%-1.3%+0.6%
2D+3.9%-0.4%+4.3%
3D+2.9%-0.6%+3.6%
5D+1.0%-2.2%+3.2%
10D-3.9%-3.2%-0.7%
 click to enlarge
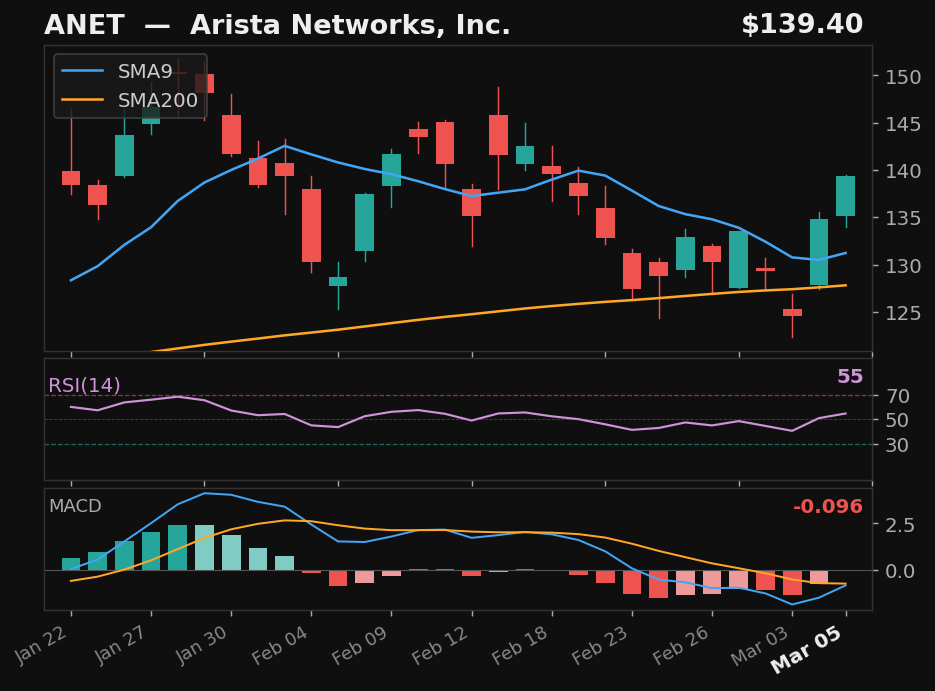
ANET
Arista Networks, Inc.
NYSE
- 10.7% pullback to SMA9
- Crossed above SMA9 — 2 days above
- RSI at 55, rising
- MACD histogram improving
Base✓Strict✓Score76.0
Returns
StockMktDiff
1D-4.7%-1.3%-3.4%
2D-1.6%-0.4%-1.2%
3D+0.2%-0.6%+0.8%
5D-3.9%-2.2%-1.6%
10D-2.3%-3.2%+0.9%
 click to enlarge
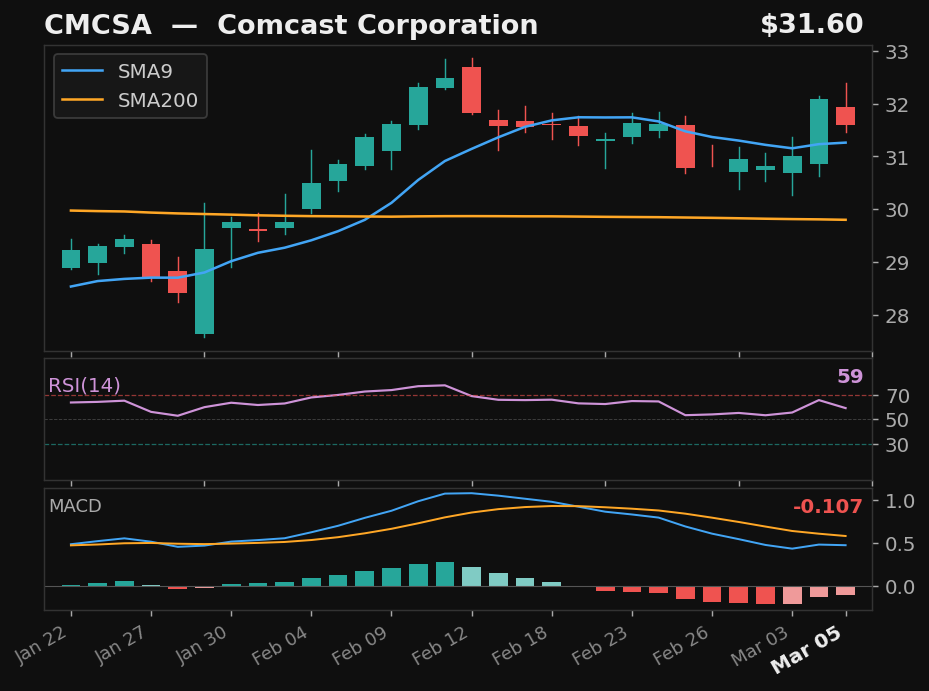
CMCSA
Comcast Corporation
NASDAQ
- 2.7% pullback to SMA9
- Crossed above SMA9 — 2 days above
- MACD histogram improving
Base✓Strict✗Score58.0
Returns
StockMktDiff
1D+1.0%-1.3%+2.3%
2D-1.8%-0.4%-1.3%
3D-1.7%-0.6%-1.1%
5D-4.6%-2.2%-2.3%
10D-8.3%-3.2%-5.1%
Alternative Setups
3 candidates · ranked by Empirical Score
 click to enlarge
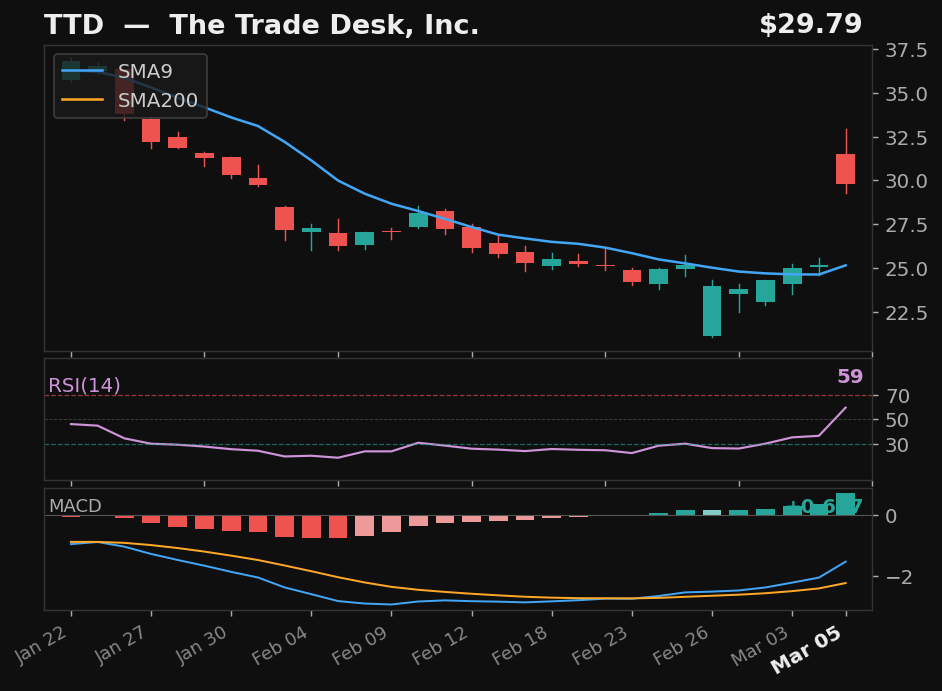
TTD
The Trade Desk, Inc.
OTHER
- 34.8% pullback — full candle body above SMA9
- RSI at 59 — confirmed recovery momentum
- 42.2% below SMA200 — extended from trend
Emp Score87.3Body Above✓
Returns
StockMktDiff
1D-1.7%-1.3%-0.4%
2D-4.1%-0.4%-3.7%
3D-7.2%-0.6%-6.5%
5D-11.0%-2.2%-8.7%
10D-21.1%-3.2%-17.9%
 click to enlarge
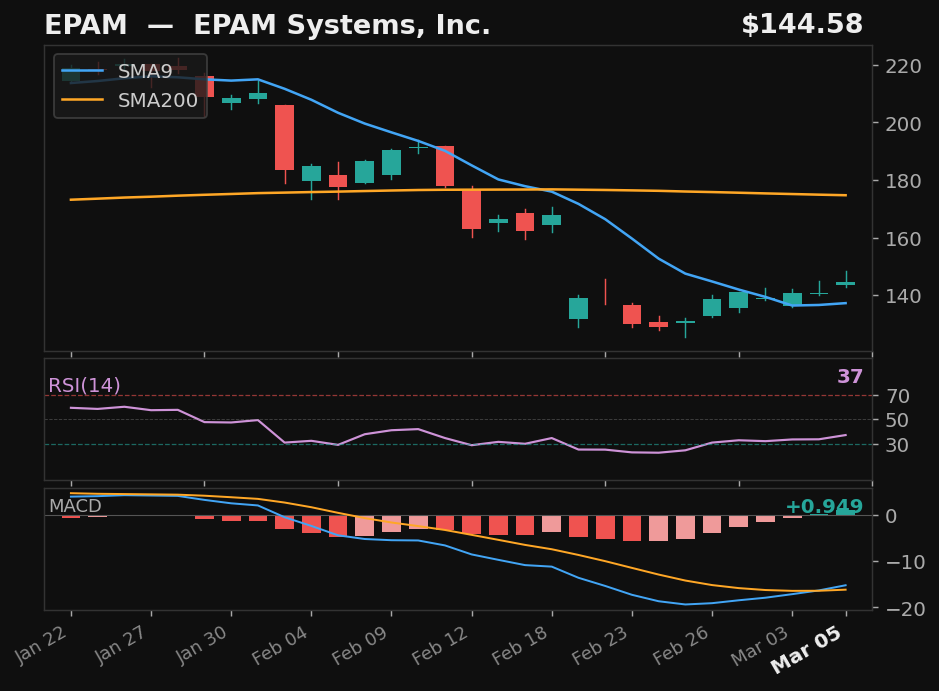
EPAM
EPAM Systems, Inc.
NYSE
- 41.0% pullback — full candle body above SMA9
- RSI rising from 37
- MACD bullish cross 1 day ago
- 17.2% below SMA200 — extended from trend
Emp Score87.2Body Above✓
Returns
StockMktDiff
1D+0.9%-1.3%+2.2%
2D+1.2%-0.4%+1.6%
3D-1.7%-0.6%-1.1%
5D-6.1%-2.2%-3.8%
10D-6.2%-3.2%-3.0%
 click to enlarge
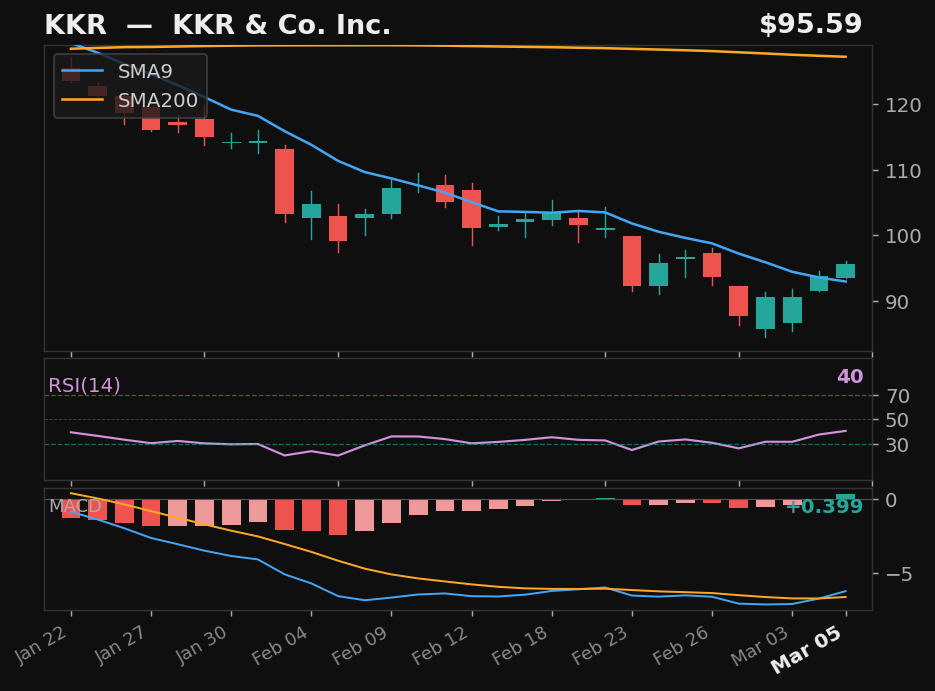
KKR
KKR & Co. Inc.
NYSE
- 34.9% pullback — full candle body above SMA9
- RSI rising from 40
- 24.9% below SMA200 — extended from trend
Emp Score77.2Body Above✓
Returns
StockMktDiff
1D-4.5%-1.3%-3.1%
2D-4.9%-0.4%-4.4%
3D-5.9%-0.6%-5.3%
5D-12.3%-2.2%-10.0%
10D-5.2%-3.2%-2.1%