Tuesday, March 10, 2026 · After Close
★ Highlights
1 in both pools
 click to enlarge
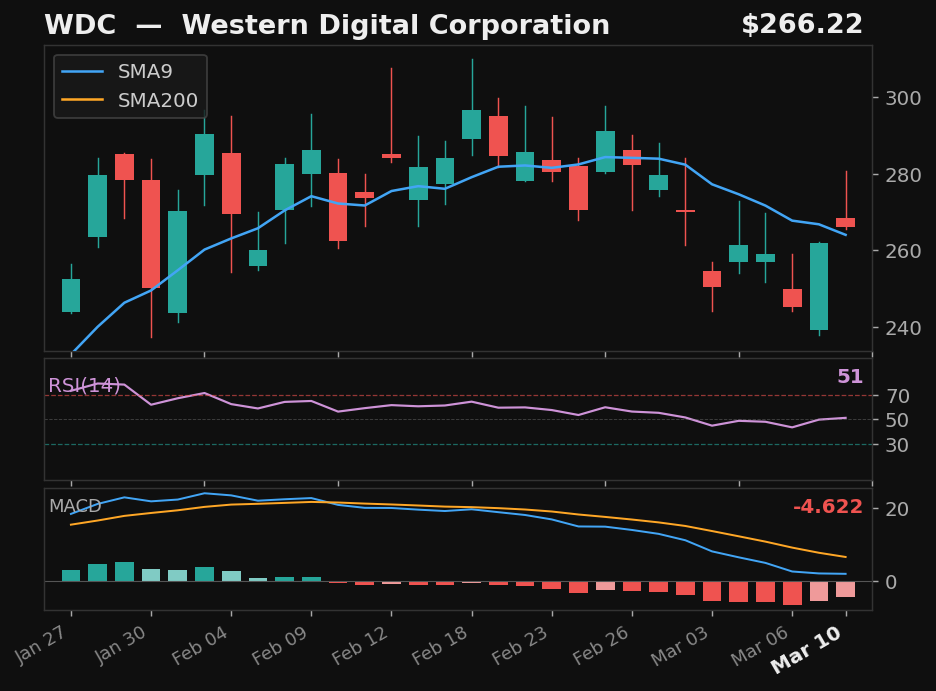
WDC
Western Digital Corporation
NASDAQ
- 15.7% pullback to SMA9 over 8 days
- Crossed back above SMA9 today
- RSI at 51, rising
- MACD histogram improving
Base✓Strict✗Score59.0
Returns
StockMktDiff
1D+1.0%-0.1%+1.1%
2D-1.9%-1.6%-0.3%
3D+2.3%-2.2%+4.5%
5D+17.9%-0.9%+18.8%
10D+13.1%-3.5%+16.6%
SwingTrader Setups
8 candidates
 click to enlarge
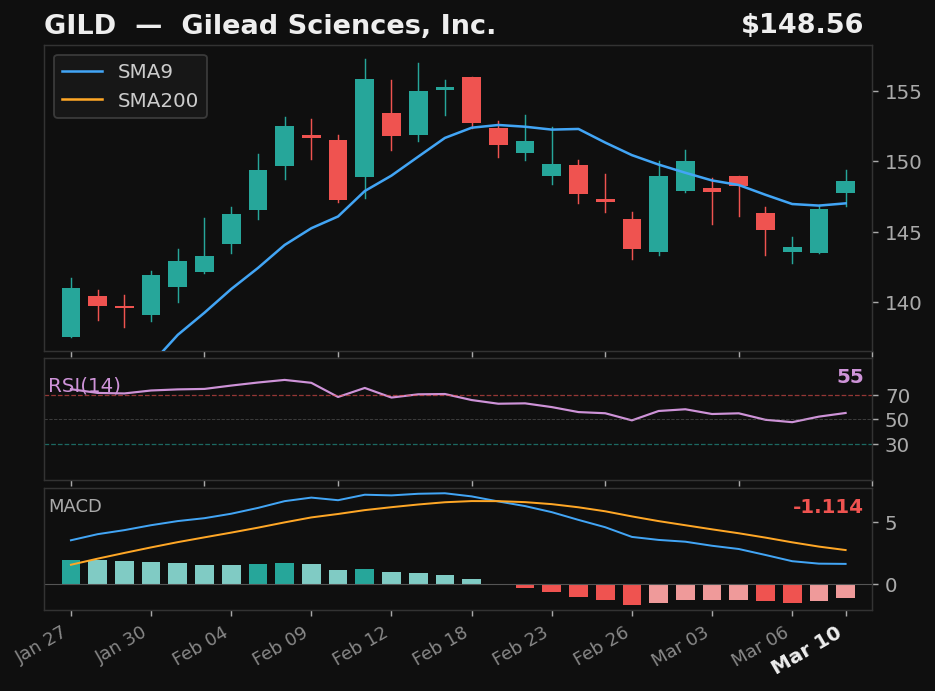
GILD
Gilead Sciences, Inc.
NASDAQ
- 5.9% pullback to SMA9 over 5 days
- Crossed back above SMA9 today
- RSI at 55, rising
- MACD histogram improving
Base✓Strict✓Score91.0
Returns
StockMktDiff
1D-1.7%-0.1%-1.6%
2D-2.3%-1.6%-0.6%
3D-2.4%-2.2%-0.2%
5D-2.8%-0.9%-1.9%
10D-7.0%-3.5%-3.5%
 click to enlarge
NVDA
NVIDIA Corporation
NASDAQ
- 9.4% pullback to SMA9 over 8 days
- Crossed back above SMA9 today
- RSI at 50, rising
- MACD histogram improving
Base✓Strict✓Score80.0
Returns
StockMktDiff
1D+0.7%-0.1%+0.8%
2D-0.9%-1.6%+0.8%
3D-2.4%-2.2%-0.2%
5D-1.5%-0.9%-0.6%
10D-5.2%-3.5%-1.6%
 click to enlarge
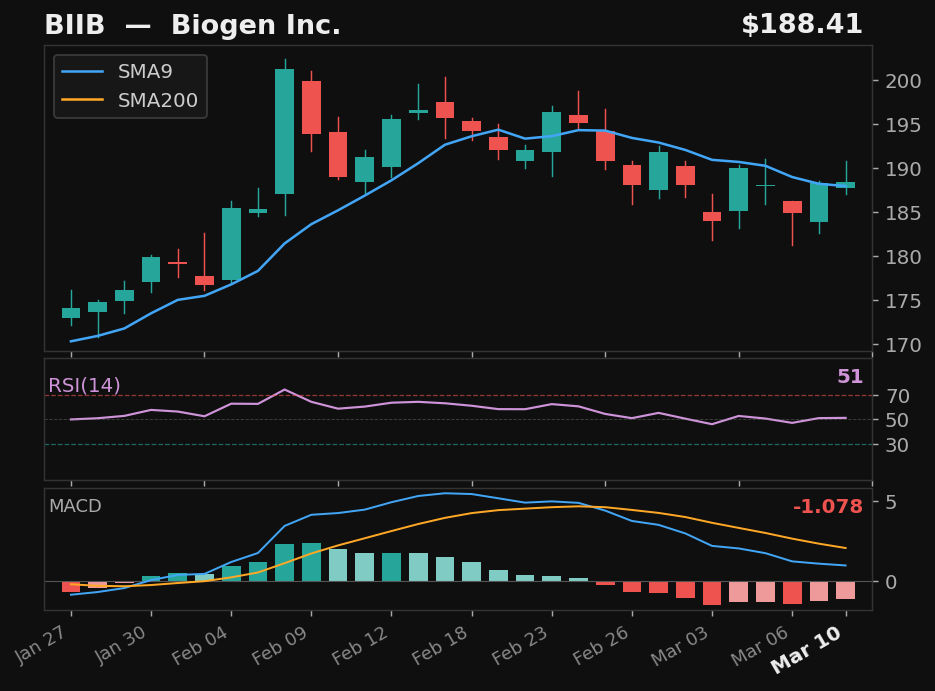
BIIB
Biogen Inc.
NASDAQ
- 5.7% pullback to SMA9
- Crossed above SMA9 — 2 days above
- RSI at 51, rising
- MACD histogram improving
Base✓Strict✗Score68.0
Returns
StockMktDiff
1D+1.1%-0.1%+1.2%
2D-1.9%-1.6%-0.2%
3D-3.6%-2.2%-1.4%
5D-1.7%-0.9%-0.7%
10D-2.4%-3.5%+1.2%
 click to enlarge
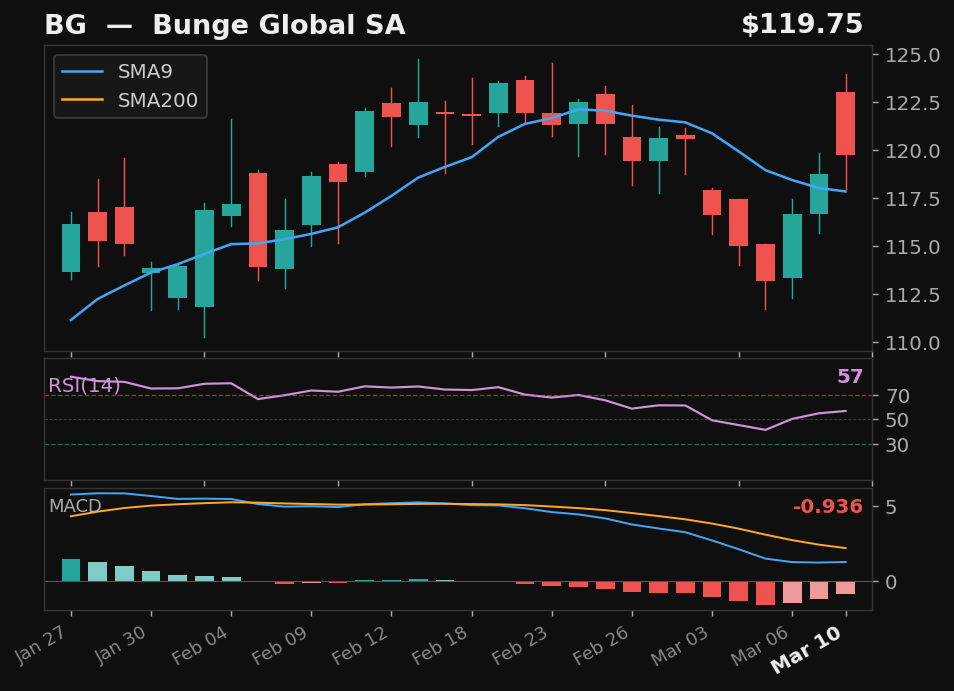
BG
Bunge Global SA
NYSE
- 7.6% pullback to SMA9
- Crossed above SMA9 — 2 days above
- RSI at 57, rising
- MACD histogram improving
Base✓Strict✗Score63.0
Returns
StockMktDiff
1D+2.5%-0.1%+2.6%
2D+5.1%-1.6%+6.7%
3D+4.2%-2.2%+6.4%
5D+5.2%-0.9%+6.1%
10D+3.6%-3.5%+7.2%
click to enlarge
WDC
Western Digital Corporation
NASDAQ
- 15.7% pullback to SMA9 over 8 days
- Crossed back above SMA9 today
- RSI at 51, rising
- MACD histogram improving
Base✓Strict✗Score59.0
Returns
StockMktDiff
1D+1.0%-0.1%+1.1%
2D-1.9%-1.6%-0.3%
3D+2.3%-2.2%+4.5%
5D+17.9%-0.9%+18.8%
10D+13.1%-3.5%+16.6%
 click to enlarge
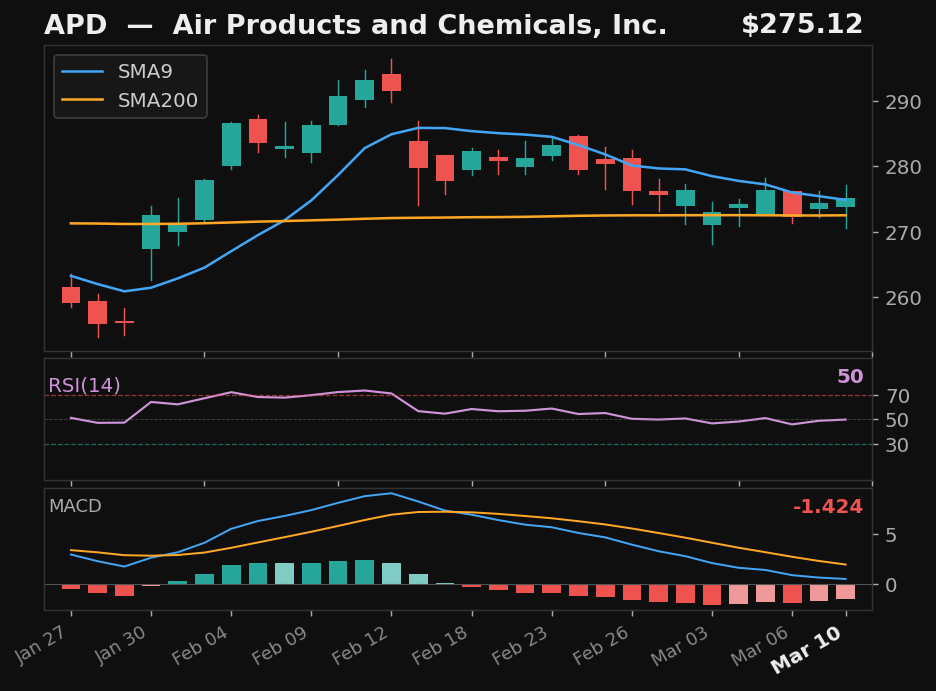
APD
Air Products and Chemicals, Inc.
NYSE
- 6.6% pullback to SMA9 over 16 days
- Crossed back above SMA9 today
- RSI at 50, rising
- MACD histogram improving
Base✓Strict✗Score58.0
Returns
StockMktDiff
1D+0.9%-0.1%+1.1%
2D+5.6%-1.6%+7.2%
3D+4.7%-2.2%+6.9%
5D+4.0%-0.9%+5.0%
10D+4.0%-3.5%+7.6%
 click to enlarge
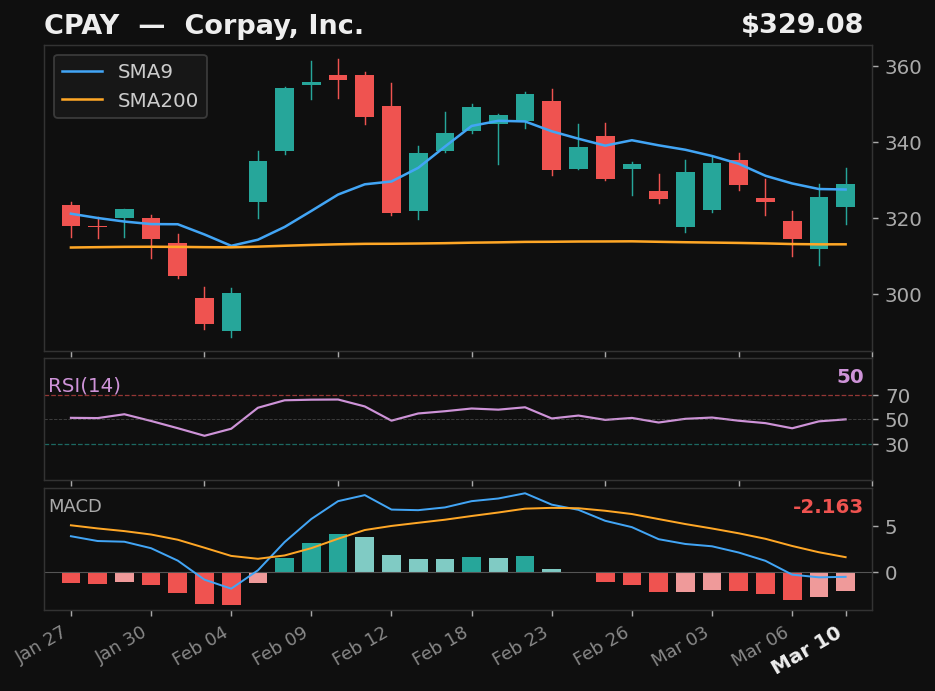
CPAY
Corpay, Inc.
NYSE
- 10.9% pullback to SMA9 over 11 days
- Crossed back above SMA9 today
- RSI at 50, rising
- MACD histogram improving
Base✓Strict✗Score57.0
Returns
StockMktDiff
1D+0.4%-0.1%+0.6%
2D-2.3%-1.6%-0.6%
3D-3.5%-2.2%-1.3%
5D-9.5%-0.9%-8.5%
10D-10.7%-3.5%-7.2%
 click to enlarge
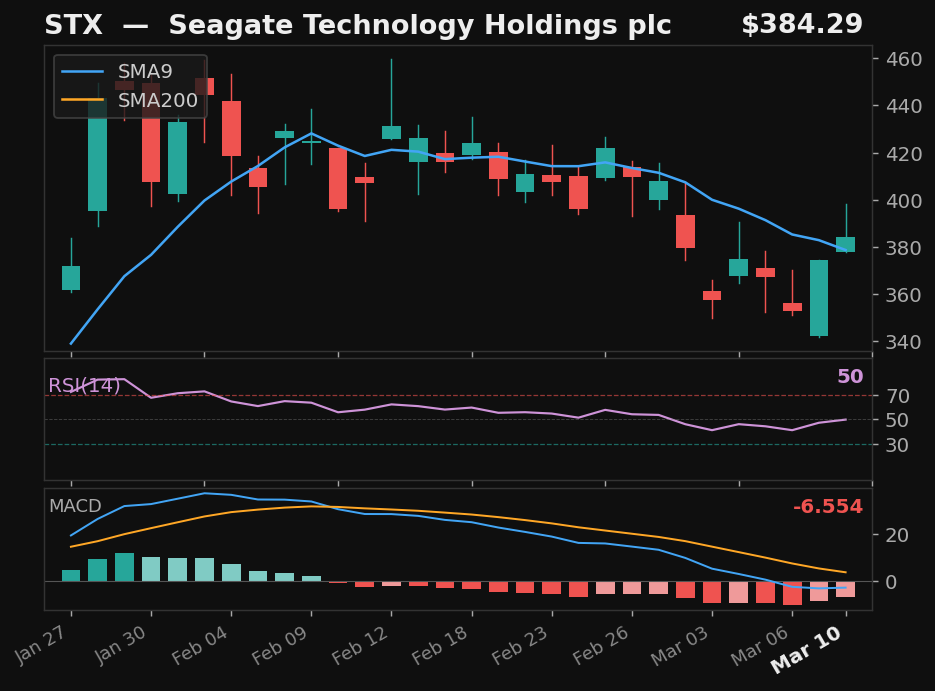
STX
Seagate Technology Holdings plc
NASDAQ
- 16.8% pullback to SMA9 over 8 days
- Crossed back above SMA9 today
- RSI at 50, rising
- MACD histogram improving
Base✓Strict✗Score57.0
Returns
StockMktDiff
1D+0.4%-0.1%+0.6%
2D-2.7%-1.6%-1.0%
3D-0.2%-2.2%+2.0%
5D+9.6%-0.9%+10.5%
10D+10.6%-3.5%+14.1%
Alternative Setups
2 candidates · ranked by Empirical Score
 click to enlarge
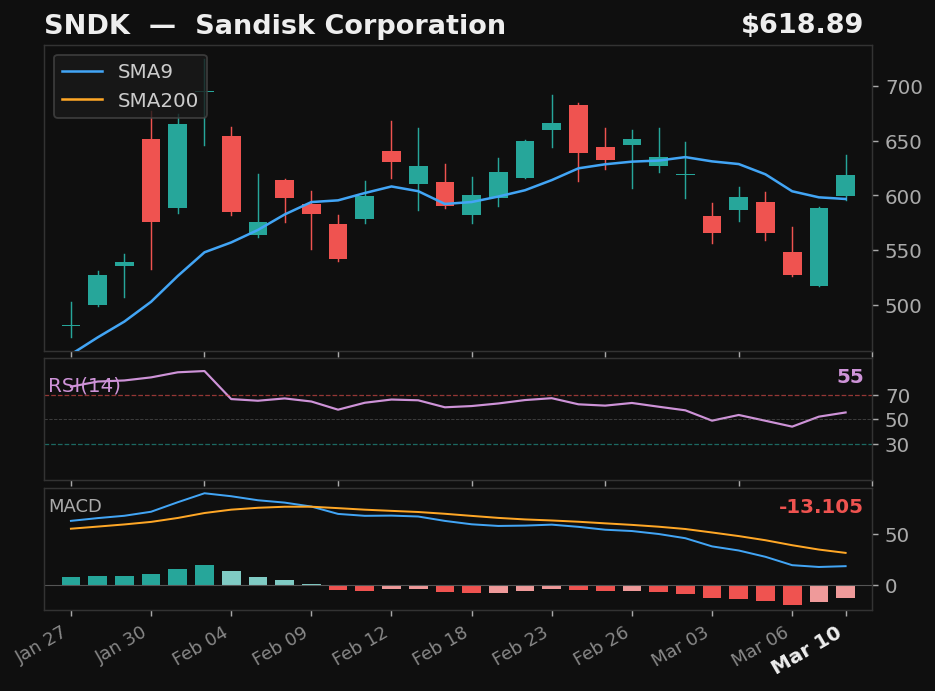
SNDK
Sandisk Corporation
NASDAQ
- 19.1% pullback over 6 days — full candle above SMA9
- RSI at 55 — confirmed recovery momentum
- MACD histogram rising while still negative — early recovery signal
- 194.7% above SMA200 — extended from trend
Emp Score104.6Body Above✓
Returns
StockMktDiff
1D+5.9%-0.1%+6.0%
2D-0.0%-1.6%+1.6%
3D+6.9%-2.2%+9.1%
5D+16.4%-0.9%+17.3%
10D+13.5%-3.5%+17.1%
click to enlarge
WDC
Western Digital Corporation
NASDAQ
- 15.7% pullback over 8 days — full candle above SMA9
- RSI at 51, rising above 50
- MACD histogram rising while still negative — early recovery signal
- 89.8% above SMA200 — extended from trend
Emp Score64.4Body Above✓
Returns
StockMktDiff
1D+1.0%-0.1%+1.1%
2D-1.9%-1.6%-0.3%
3D+2.3%-2.2%+4.5%
5D+17.9%-0.9%+18.8%
10D+13.1%-3.5%+16.6%