Wednesday, March 11, 2026 · After Close
★ Highlights
1 in both pools
 click to enlarge
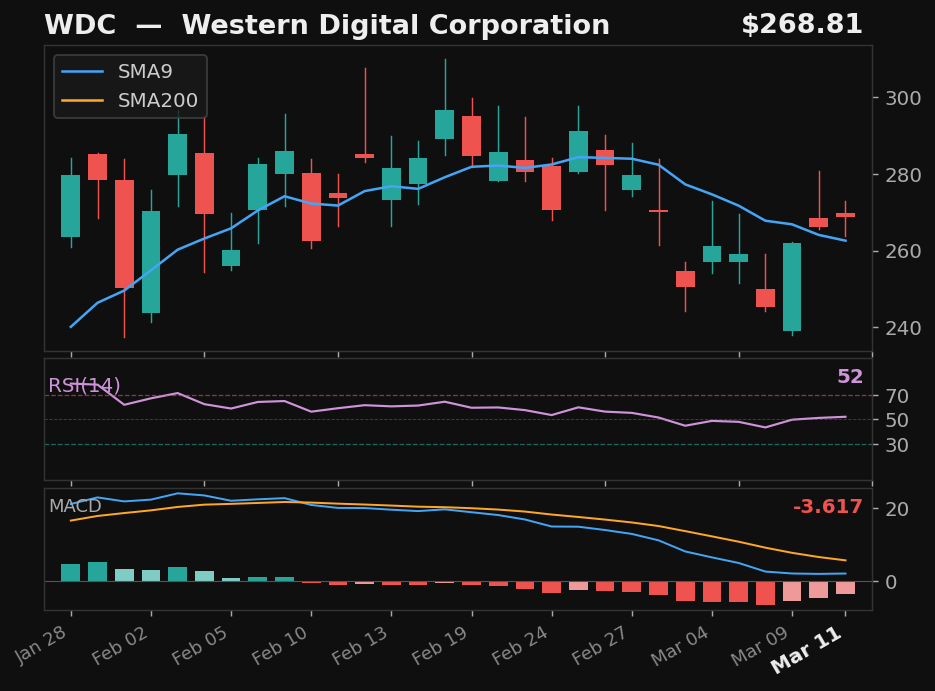
WDC
Western Digital Corporation
NASDAQ
- 15.7% pullback to SMA9
- Crossed above SMA9 — 2 days above
- RSI at 52, rising
- MACD histogram improving
Base✓Strict✗Score55.0
Returns
StockMktDiff
1D-2.8%-1.5%-1.3%
2D+1.3%-2.1%+3.4%
3D+6.5%-1.1%+7.6%
5D+13.4%-2.2%+15.6%
10D+10.2%-2.9%+13.1%
SwingTrader Setups
7 candidates
 click to enlarge
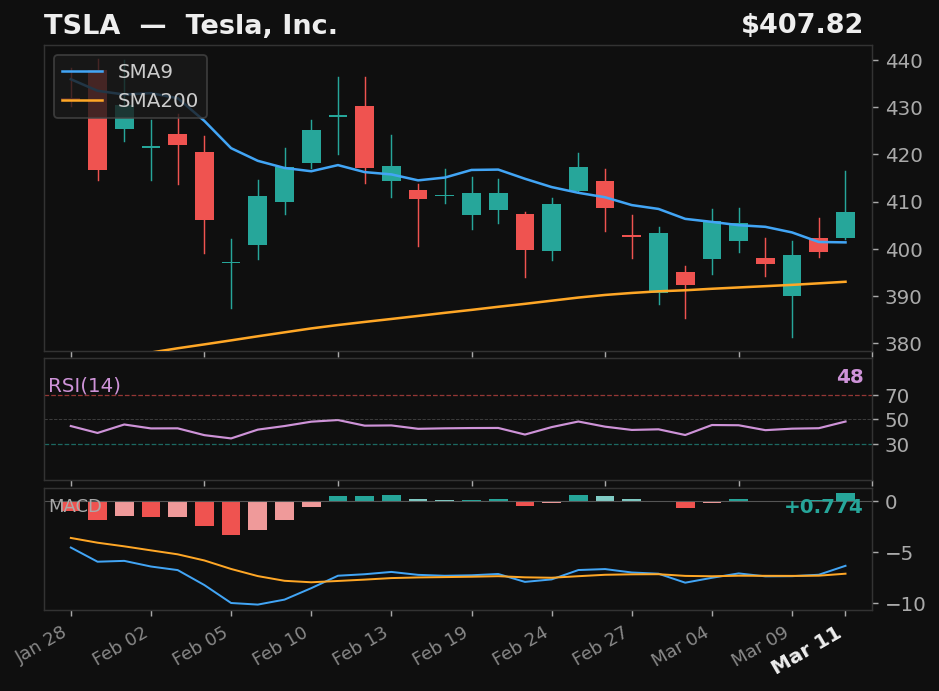
TSLA
Tesla, Inc.
NASDAQ
- Quick 6.0% pullback to SMA9 — 3 days
- Crossed back above SMA9 today
- RSI at 48, rising
- MACD bullish cross 1 day ago
Base✓Strict✓Score95.0
Returns
StockMktDiff
1D-3.1%-1.5%-1.6%
2D-4.1%-2.1%-2.0%
3D-3.0%-1.1%-1.9%
5D-3.7%-2.2%-1.5%
10D-5.4%-2.9%-2.5%
 click to enlarge
NVDA
NVIDIA Corporation
NASDAQ
- 9.4% pullback to SMA9
- Crossed above SMA9 — 2 days above
- RSI at 51, rising
- MACD histogram improving
Base✓Strict✓Score76.0
Returns
StockMktDiff
1D-1.6%-1.5%-0.0%
2D-3.1%-2.1%-1.0%
3D-1.5%-1.1%-0.4%
5D-3.0%-2.2%-0.8%
10D-4.0%-2.9%-1.1%
 click to enlarge
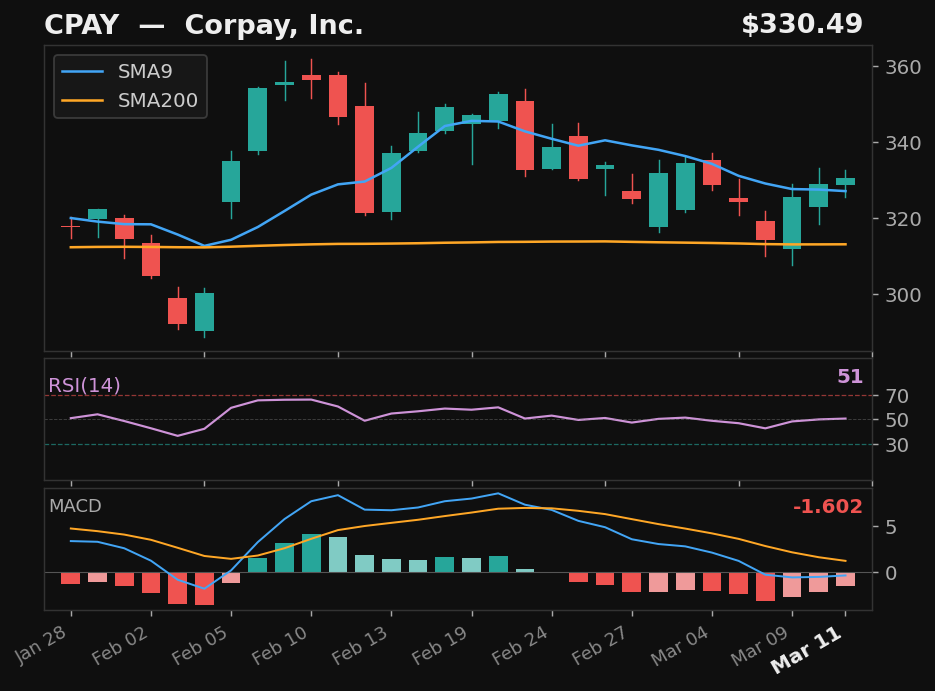
CPAY
Corpay, Inc.
NYSE
- 10.9% pullback to SMA9
- Crossed above SMA9 — 2 days above
- RSI at 51, rising
- MACD histogram improving
Base✓Strict✓Score73.0
Returns
StockMktDiff
1D-2.7%-1.5%-1.2%
2D-3.9%-2.1%-1.8%
3D-6.1%-1.1%-5.1%
5D-13.5%-2.2%-11.3%
10D-11.7%-2.9%-8.8%
 click to enlarge
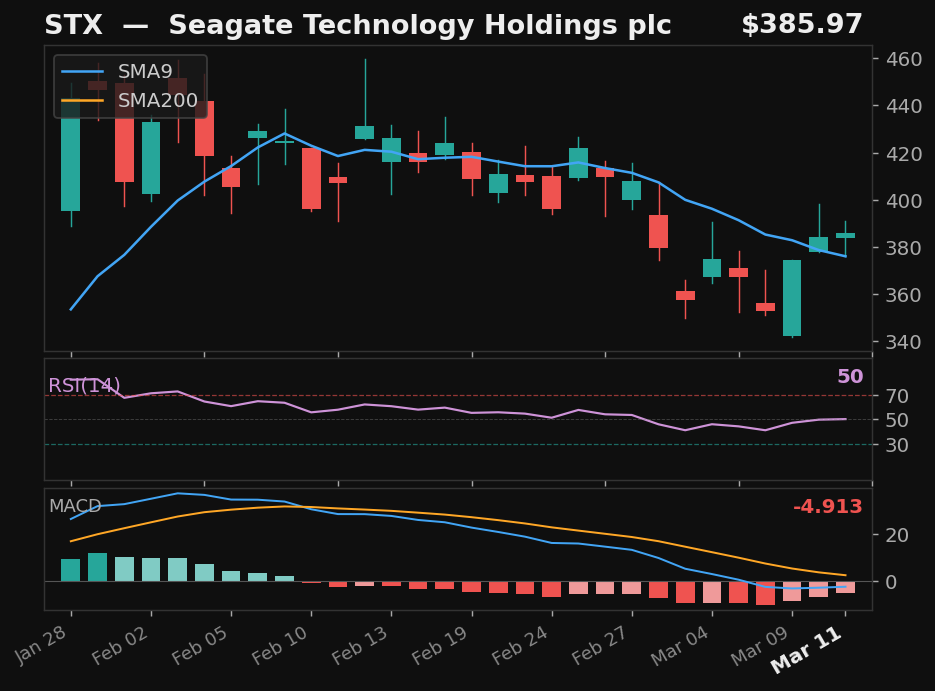
STX
Seagate Technology Holdings plc
NASDAQ
- 16.8% pullback to SMA9
- Crossed above SMA9 — 2 days above
- RSI at 50, rising
- MACD histogram improving
Base✓Strict✓Score70.0
Returns
StockMktDiff
1D-3.1%-1.5%-1.6%
2D-0.6%-2.1%+1.5%
3D+3.3%-1.1%+4.4%
5D+5.4%-2.2%+7.6%
10D+7.1%-2.9%+9.9%
 click to enlarge
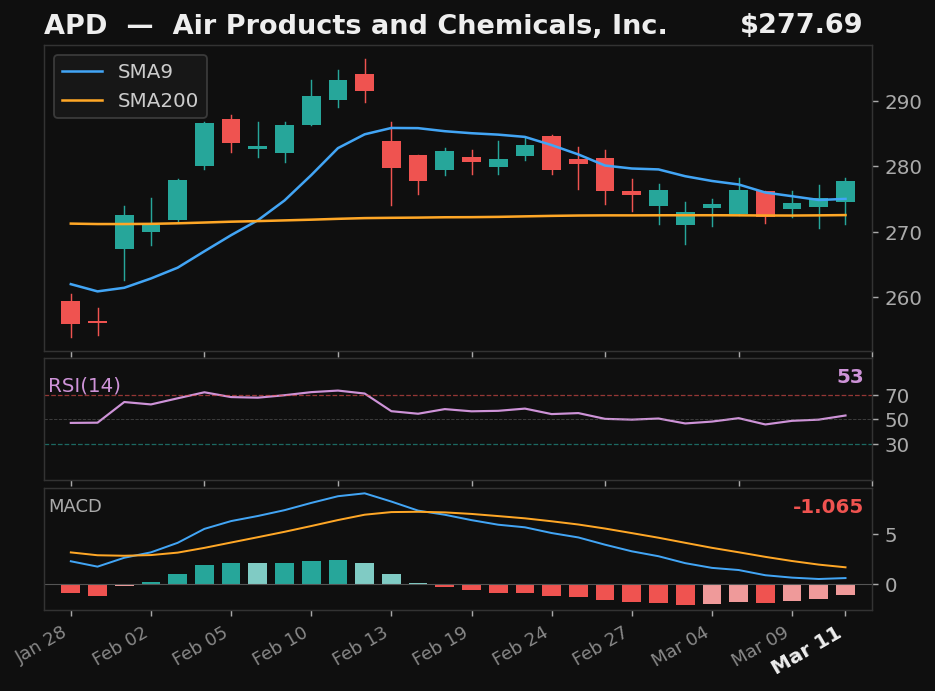
APD
Air Products and Chemicals, Inc.
NYSE
- 6.6% pullback to SMA9
- Crossed above SMA9 — 2 days above
- RSI at 53, rising
- MACD histogram improving
Base✓Strict✗Score62.0
Returns
StockMktDiff
1D+4.6%-1.5%+6.1%
2D+3.7%-2.1%+5.8%
3D+4.1%-1.1%+5.2%
5D+1.3%-2.2%+3.5%
10D+4.5%-2.9%+7.4%
click to enlarge
WDC
Western Digital Corporation
NASDAQ
- 15.7% pullback to SMA9
- Crossed above SMA9 — 2 days above
- RSI at 52, rising
- MACD histogram improving
Base✓Strict✗Score55.0
Returns
StockMktDiff
1D-2.8%-1.5%-1.3%
2D+1.3%-2.1%+3.4%
3D+6.5%-1.1%+7.6%
5D+13.4%-2.2%+15.6%
10D+10.2%-2.9%+13.1%
 click to enlarge
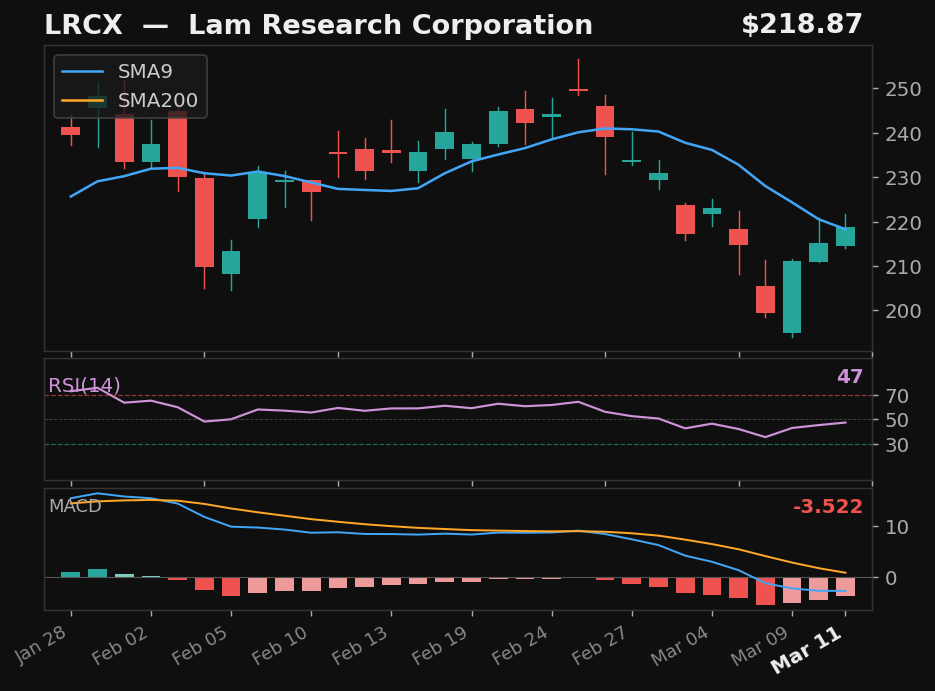
LRCX
Lam Research Corporation
NASDAQ
- 20.1% pullback to SMA9 over 9 days
- Crossed back above SMA9 today
- RSI at 47, rising
- MACD histogram improving
Base✓Strict✗Score54.0
Returns
StockMktDiff
1D-4.3%-1.5%-2.8%
2D-3.0%-2.1%-1.0%
3D+0.2%-1.1%+1.3%
5D+2.7%-2.2%+4.9%
10D+6.7%-2.9%+9.5%
Alternative Setups
3 candidates · ranked by Empirical Score
 click to enlarge
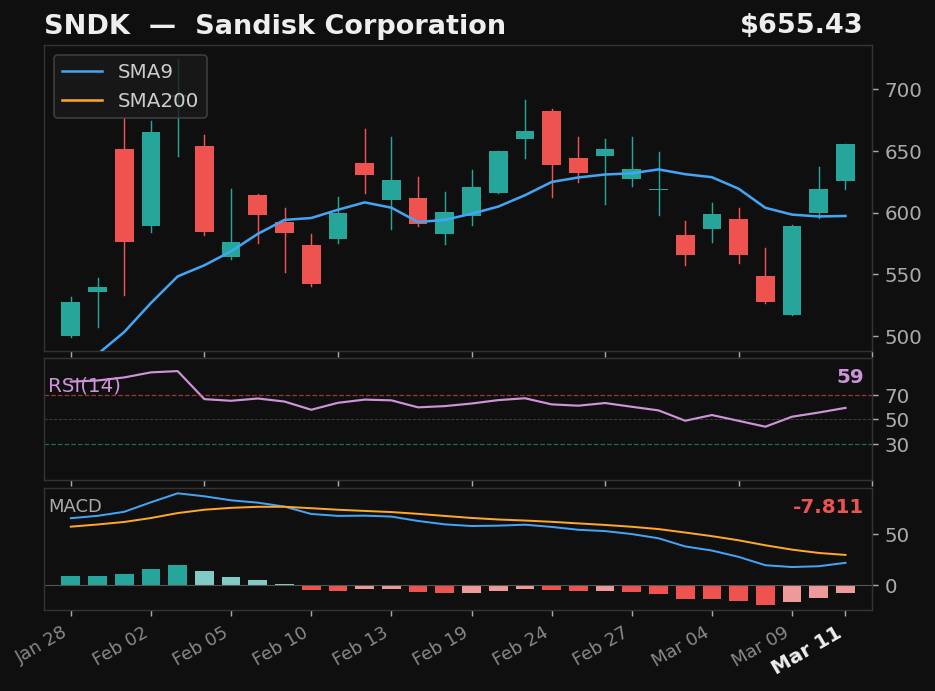
SNDK
Sandisk Corporation
NASDAQ
- 19.1% pullback — full candle body above SMA9
- RSI at 59 — confirmed recovery momentum
- MACD histogram rising while still negative — early recovery signal
- 207.6% above SMA200 — extended from trend
Emp Score108.5Body Above✓
Returns
StockMktDiff
1D-5.6%-1.5%-4.1%
2D+0.9%-2.1%+3.0%
3D+7.4%-1.1%+8.4%
5D+15.0%-2.2%+17.2%
10D+3.4%-2.9%+6.3%
 click to enlarge
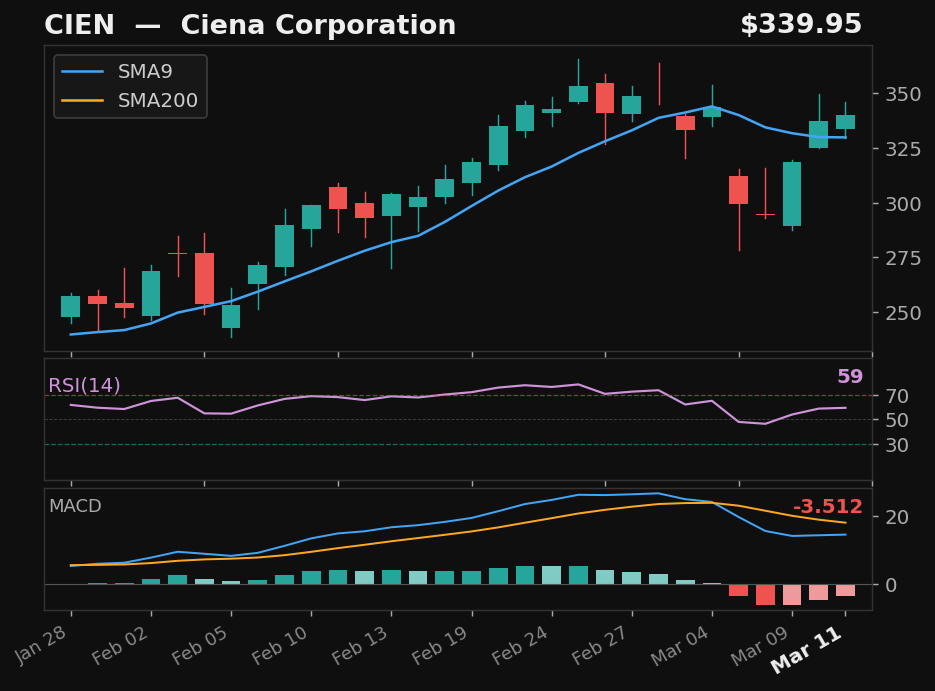
CIEN
Ciena Corporation
NYSE
- 16.8% pullback — full candle body above SMA9
- RSI at 59 — confirmed recovery momentum
- MACD histogram rising while still negative — early recovery signal
- 99.2% above SMA200 — extended from trend
Emp Score71.5Body Above✓
Returns
StockMktDiff
1D-0.9%-1.5%+0.6%
2D-0.8%-2.1%+1.3%
3D+7.0%-1.1%+8.1%
5D+13.3%-2.2%+15.5%
10D+28.8%-2.9%+31.6%
click to enlarge
WDC
Western Digital Corporation
NASDAQ
- 15.7% pullback — full candle body above SMA9
- RSI at 52, rising above 50
- MACD histogram rising while still negative — early recovery signal
- 90.2% above SMA200 — extended from trend
Emp Score64.5Body Above✓
Returns
StockMktDiff
1D-2.8%-1.5%-1.3%
2D+1.3%-2.1%+3.4%
3D+6.5%-1.1%+7.6%
5D+13.4%-2.2%+15.6%
10D+10.2%-2.9%+13.1%