Friday, March 27, 2026 · After Close
SwingTrader Setups
10 candidates
 click to enlarge
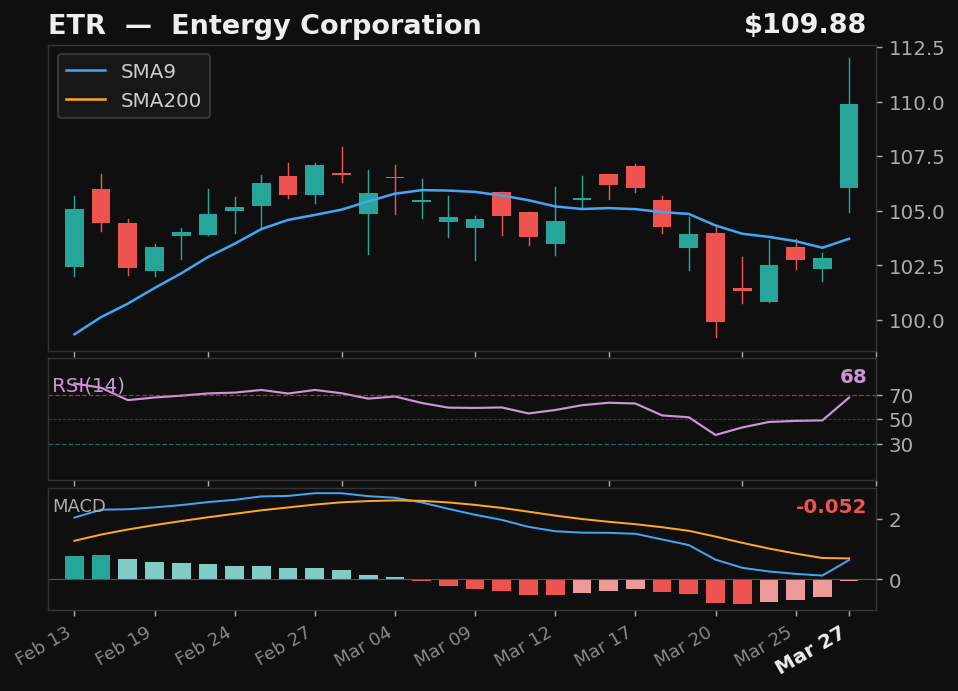
ETR
Entergy Corporation
NYSE
- 5.8% pullback to SMA9 over 7 days
- Crossed back above SMA9 today
- RSI at 68, rising
- MACD histogram improving
Base✓Strict✓Score88.0
Returns
StockMktDiff
1D———
2D———
3D———
5D———
10D———
results pending next close
 click to enlarge
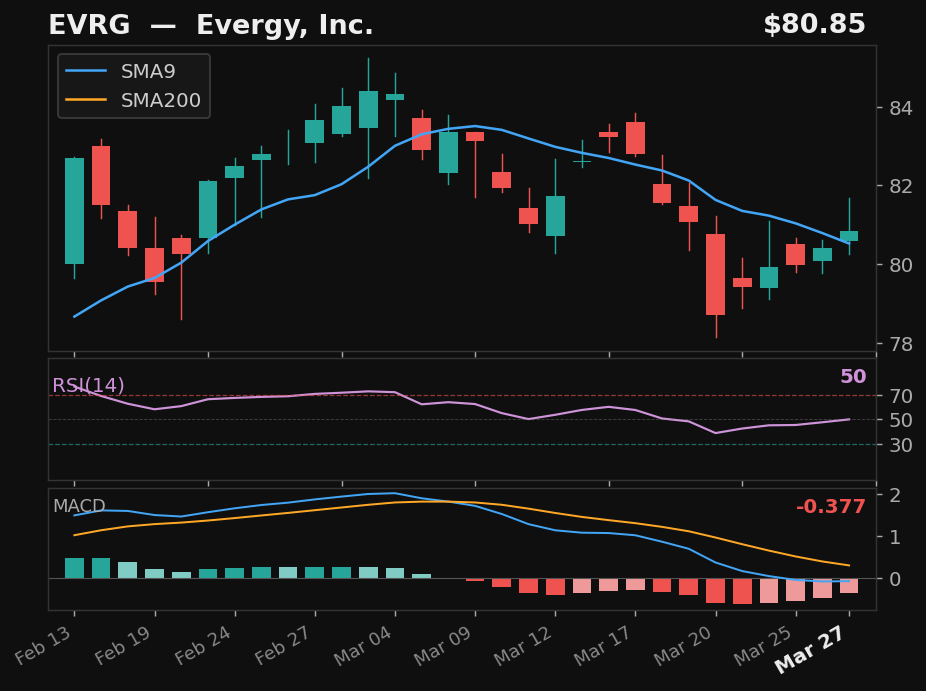
EVRG
Evergy, Inc.
NASDAQ
- 5.0% pullback to SMA9 over 7 days
- Crossed back above SMA9 today
- RSI at 50, rising
- MACD histogram improving
Base✓Strict✓Score88.0
Returns
StockMktDiff
1D———
2D———
3D———
5D———
10D———
results pending next close
 click to enlarge
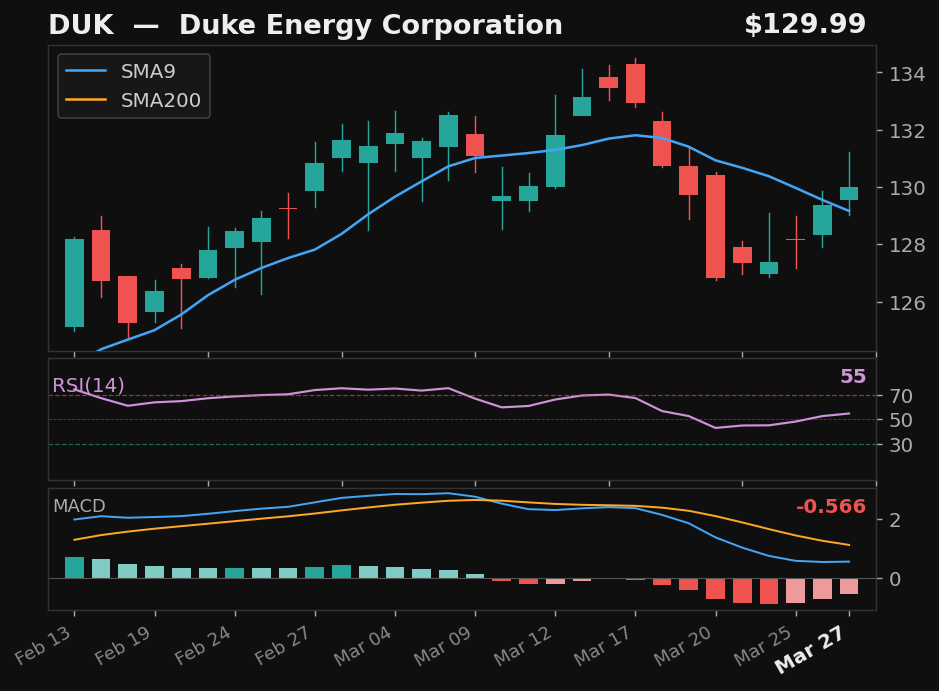
DUK
Duke Energy Corporation
NYSE
- 4.6% pullback to SMA9 over 7 days
- Crossed back above SMA9 today
- RSI at 55, rising
- MACD histogram improving
Base✓Strict✓Score87.0
Returns
StockMktDiff
1D———
2D———
3D———
5D———
10D———
results pending next close
 click to enlarge
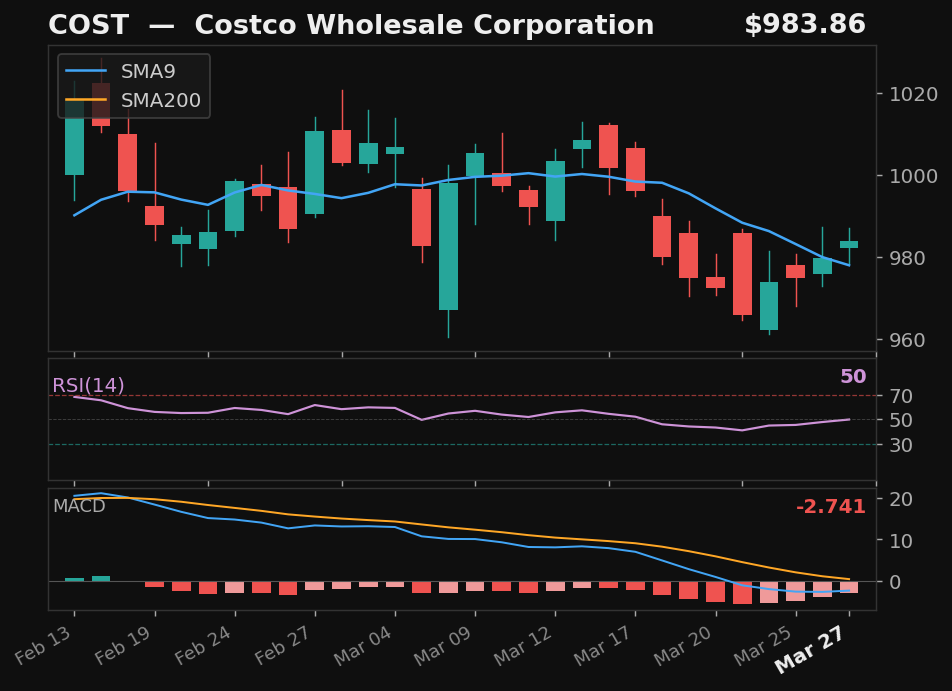
COST
Costco Wholesale Corporation
NASDAQ
- 3.6% pullback to SMA9 over 8 days
- Crossed back above SMA9 today
- RSI at 50, rising
- MACD histogram improving
Base✓Strict✓Score84.0
Returns
StockMktDiff
1D———
2D———
3D———
5D———
10D———
results pending next close
 click to enlarge
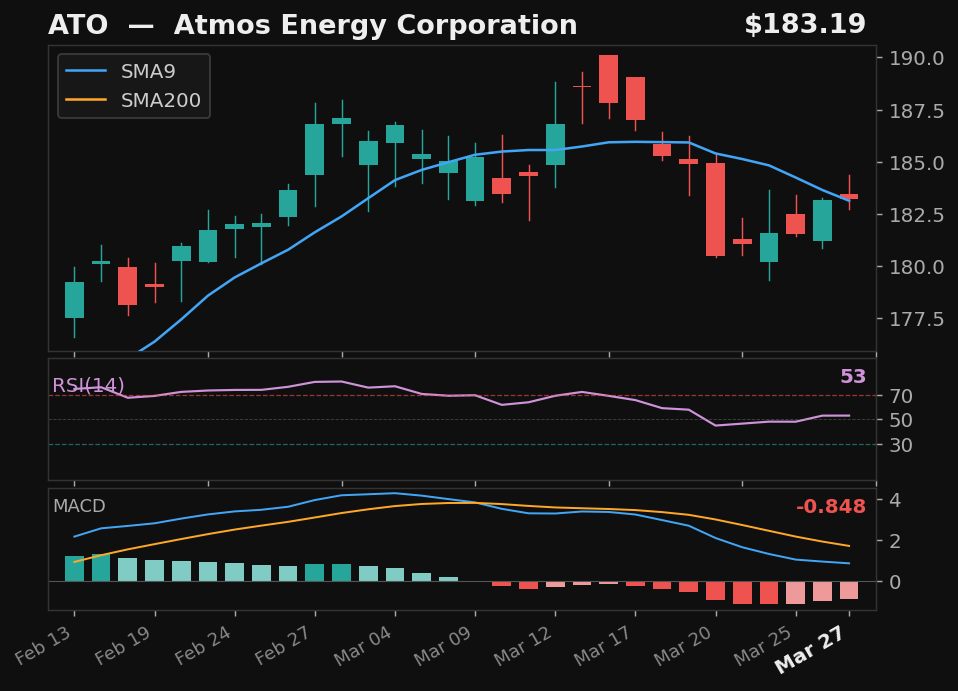
ATO
Atmos Energy Corporation
NYSE
- 3.5% pullback to SMA9 over 7 days
- Crossed back above SMA9 today
- RSI at 53, rising
- MACD histogram improving
Base✓Strict✗Score73.0
Returns
StockMktDiff
1D———
2D———
3D———
5D———
10D———
results pending next close
 click to enlarge
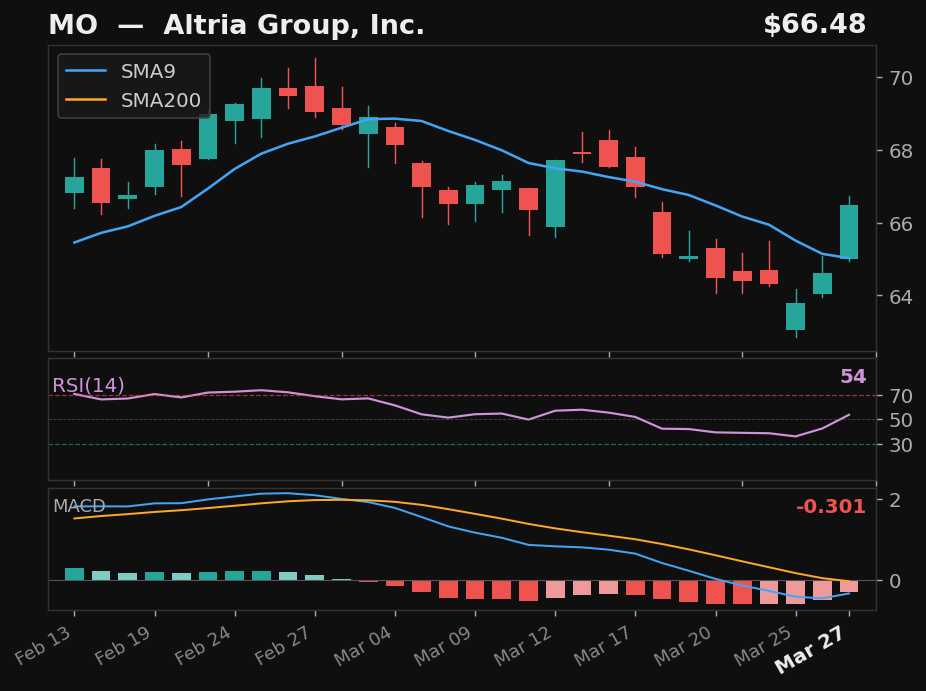
MO
Altria Group, Inc.
NYSE
- 5.6% pullback to SMA9 over 8 days
- Crossed back above SMA9 today
- RSI at 54, rising
- MACD histogram improving
Base✓Strict✗Score73.0
Returns
StockMktDiff
1D———
2D———
3D———
5D———
10D———
results pending next close
 click to enlarge
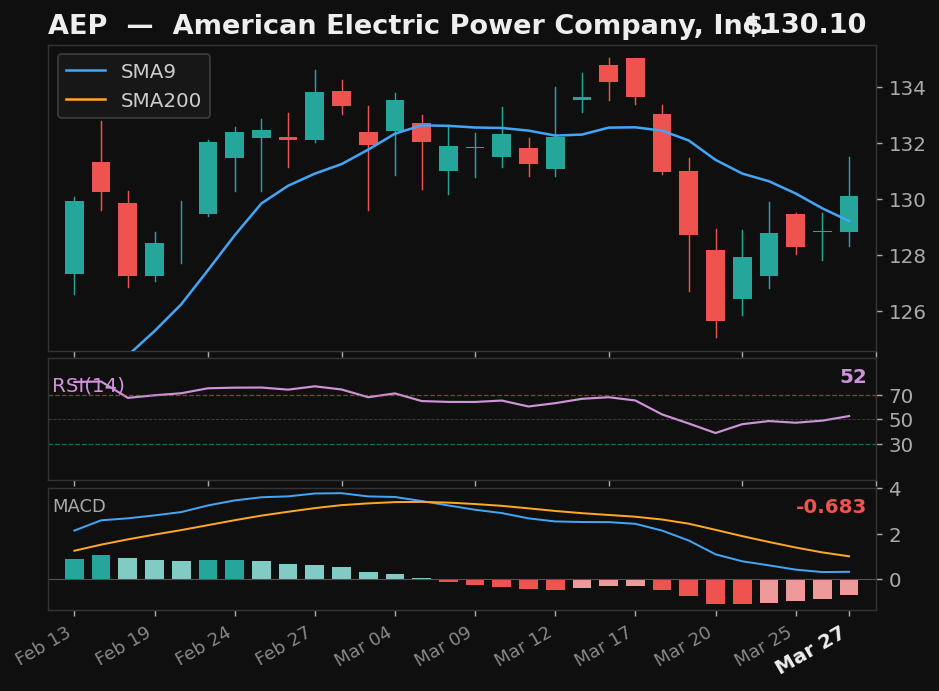
AEP
American Electric Power Company, Inc.
NASDAQ
- 6.0% pullback to SMA9 over 7 days
- Crossed back above SMA9 today
- RSI at 53, rising
- MACD histogram improving
Base✓Strict✗Score72.0
Returns
StockMktDiff
1D———
2D———
3D———
5D———
10D———
results pending next close
 click to enlarge
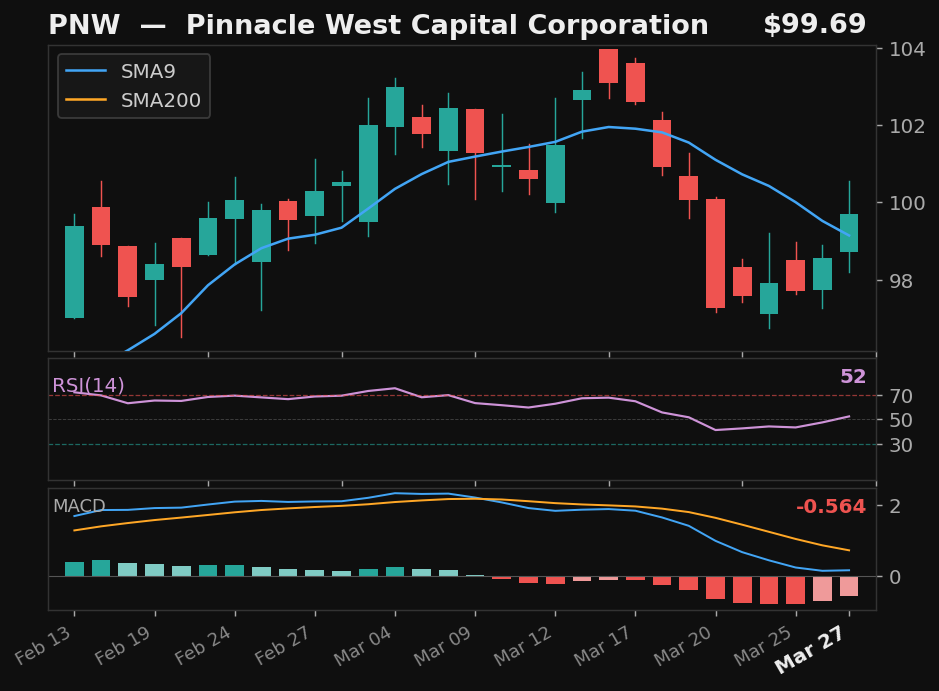
PNW
Pinnacle West Capital Corporation
NYSE
- 5.2% pullback to SMA9 over 7 days
- Crossed back above SMA9 today
- RSI at 52, rising
- MACD histogram improving
Base✓Strict✗Score72.0
Returns
StockMktDiff
1D———
2D———
3D———
5D———
10D———
results pending next close
 click to enlarge
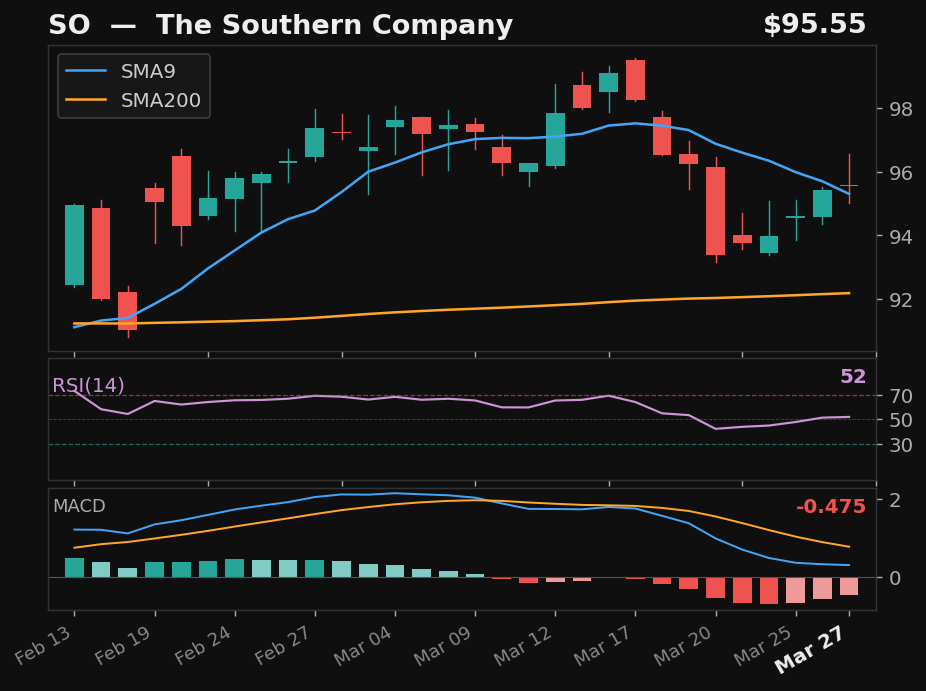
SO
The Southern Company
NYSE
- 5.0% pullback to SMA9 over 7 days
- Crossed back above SMA9 today
- RSI at 52, rising
- MACD histogram improving
Base✓Strict✗Score72.0
Returns
StockMktDiff
1D———
2D———
3D———
5D———
10D———
results pending next close
 click to enlarge
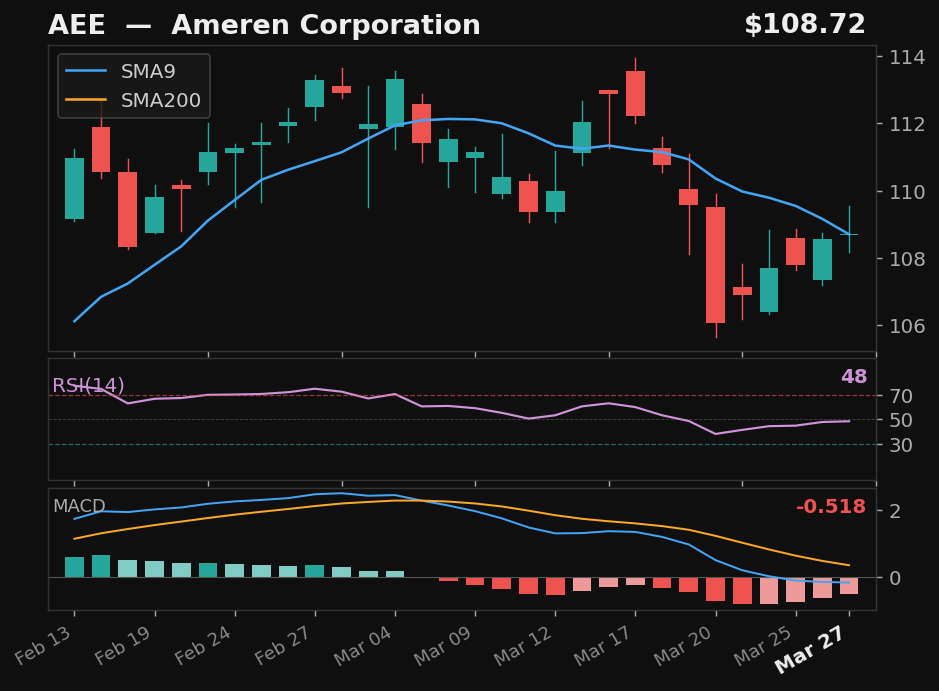
AEE
Ameren Corporation
NYSE
- 5.5% pullback to SMA9 over 7 days
- Crossed back above SMA9 today
- RSI at 48, rising
- MACD histogram improving
Base✓Strict✗Score71.0
Returns
StockMktDiff
1D———
2D———
3D———
5D———
10D———
results pending next close
Alternative Setups
3 candidates · ranked by Empirical Score
 click to enlarge
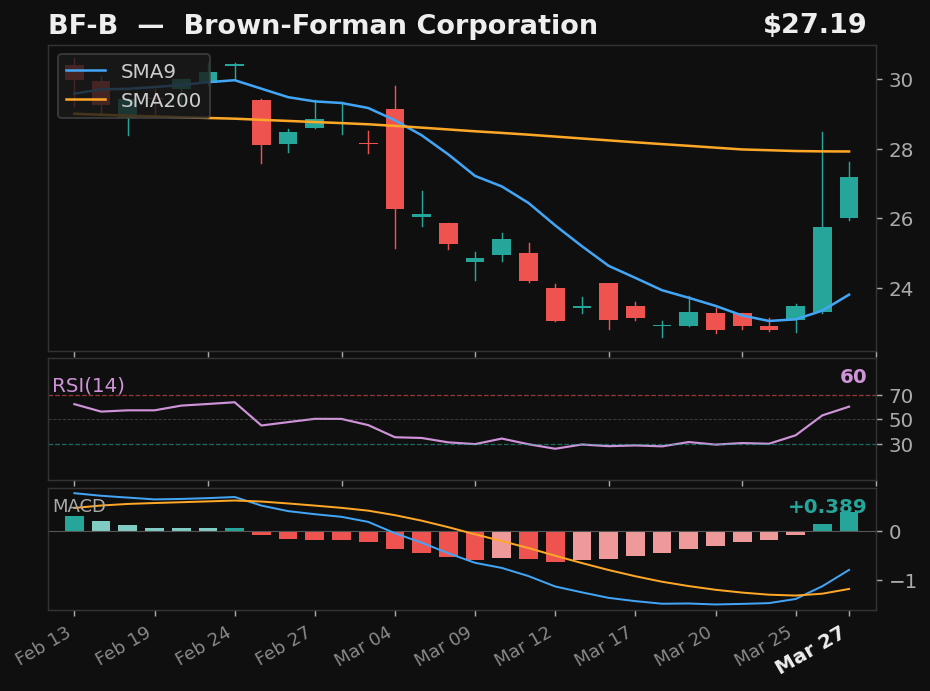
BF-B
Brown-Forman Corporation
NYSE
- 25.0% pullback — full candle body above SMA9
- RSI at 60 — confirmed recovery momentum
- MACD bullish cross 1 day ago
Emp Score55.9Body Above✓
Returns
StockMktDiff
1D———
2D———
3D———
5D———
10D———
results pending next close
 click to enlarge
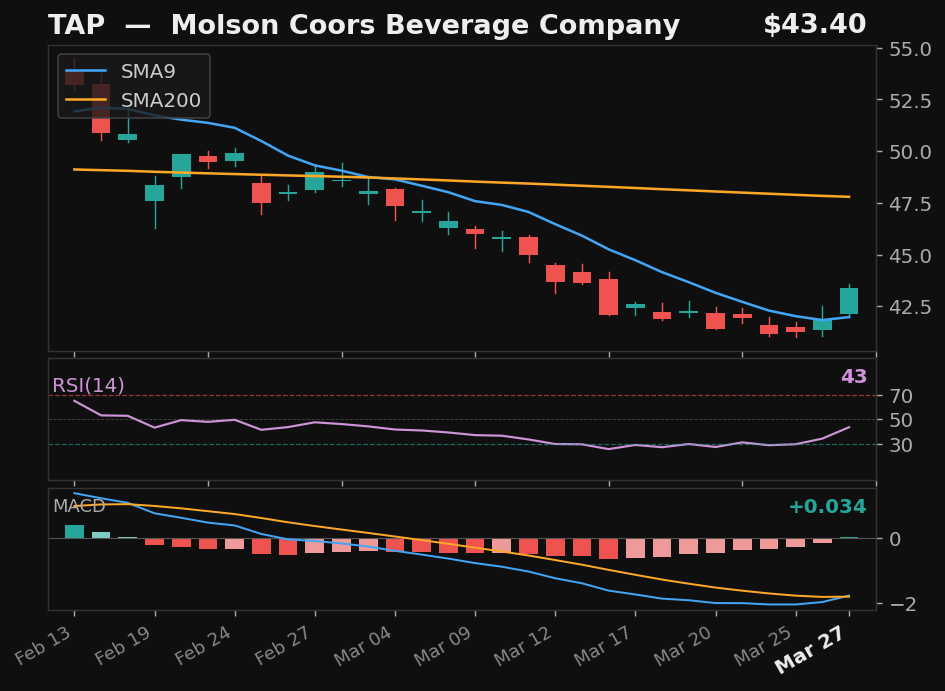
TAP
Molson Coors Beverage Company
NYSE
- 22.7% pullback — full candle body above SMA9
- RSI rising from 43
- 9.2% below SMA200 — extended from trend
Emp Score48.1Body Above✓
Returns
StockMktDiff
1D———
2D———
3D———
5D———
10D———
results pending next close
 click to enlarge
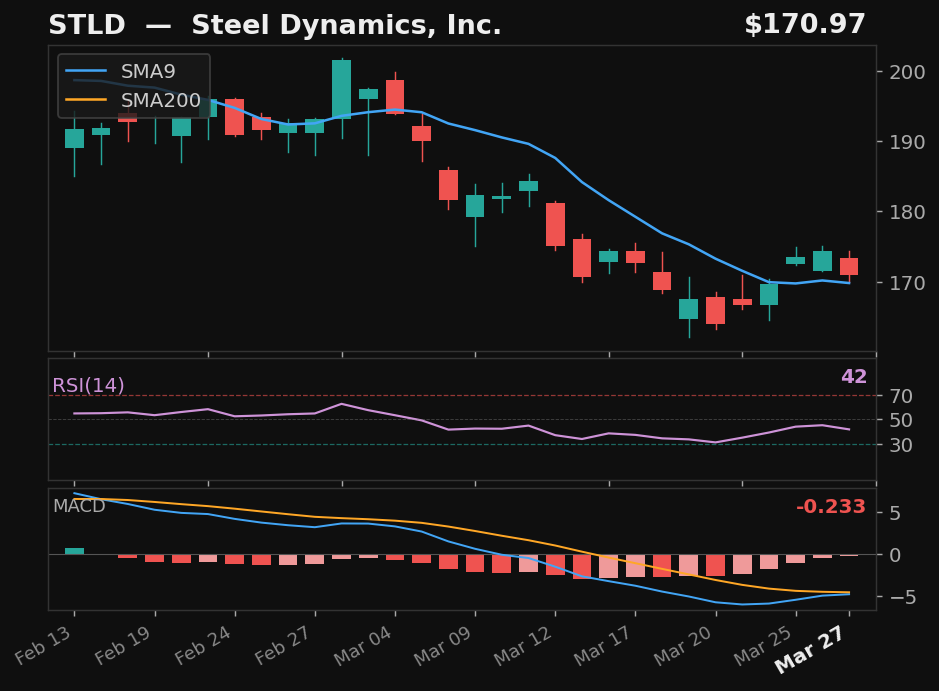
STLD
Steel Dynamics, Inc.
NASDAQ
- 17.0% pullback — full candle body above SMA9
- MACD histogram rising while still negative — early recovery signal
- 10.3% above SMA200 — extended from trend
Emp Score40.0Body Above✓
Returns
StockMktDiff
1D———
2D———
3D———
5D———
10D———
results pending next close