Thursday, March 26, 2026 · After Close
SwingTrader Setups
10 candidates
 click to enlarge
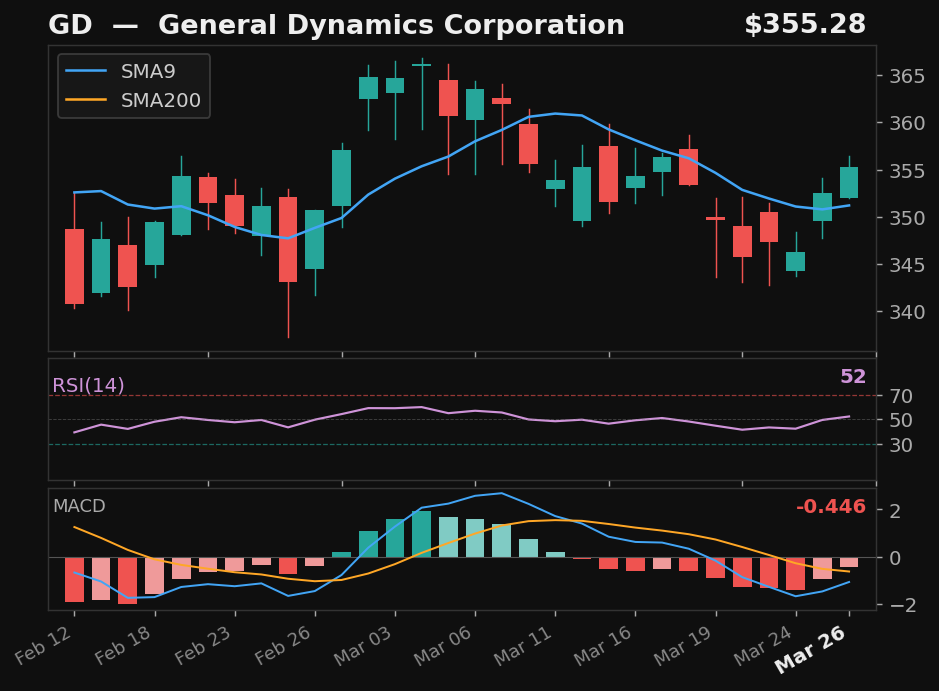
GD
General Dynamics Corporation
NYSE
- 4.5% pullback to SMA9
- Crossed above SMA9 — 2 days above
- RSI at 52, rising
- MACD histogram improving
Base✓Strict✓Score85.0
Returns
StockMktDiff
1D-2.4%-1.7%-0.7%
2D———
3D———
5D———
10D———
 click to enlarge
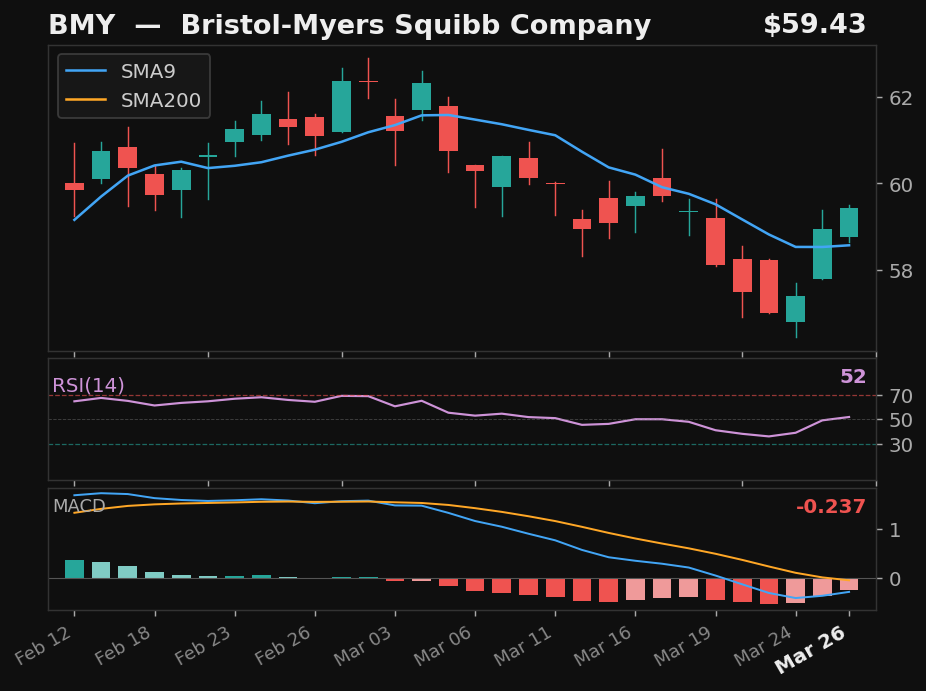
BMY
Bristol-Myers Squibb Company
NYSE
- 8.6% pullback to SMA9
- Crossed above SMA9 — 2 days above
- RSI at 52, rising
- MACD histogram improving
Base✓Strict✓Score78.0
Returns
StockMktDiff
1D-1.5%-1.7%+0.2%
2D———
3D———
5D———
10D———
 click to enlarge
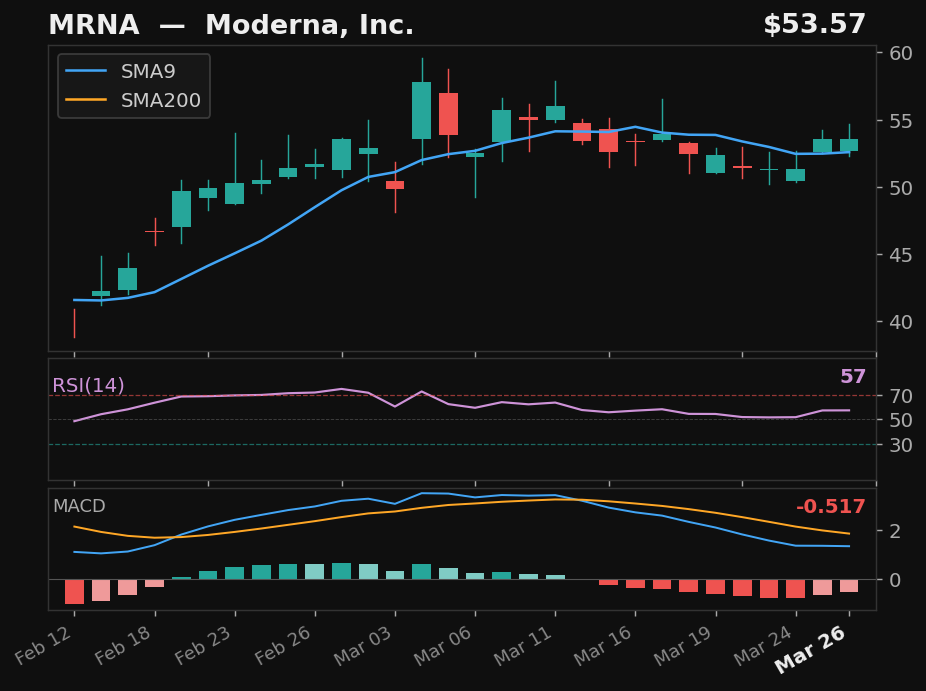
MRNA
Moderna, Inc.
NASDAQ
- 8.4% pullback to SMA9
- Crossed above SMA9 — 2 days above
- RSI at 57, rising
- MACD histogram improving
Base✓Strict✓Score78.0
Returns
StockMktDiff
1D-7.5%-1.7%-5.8%
2D———
3D———
5D———
10D———
 click to enlarge
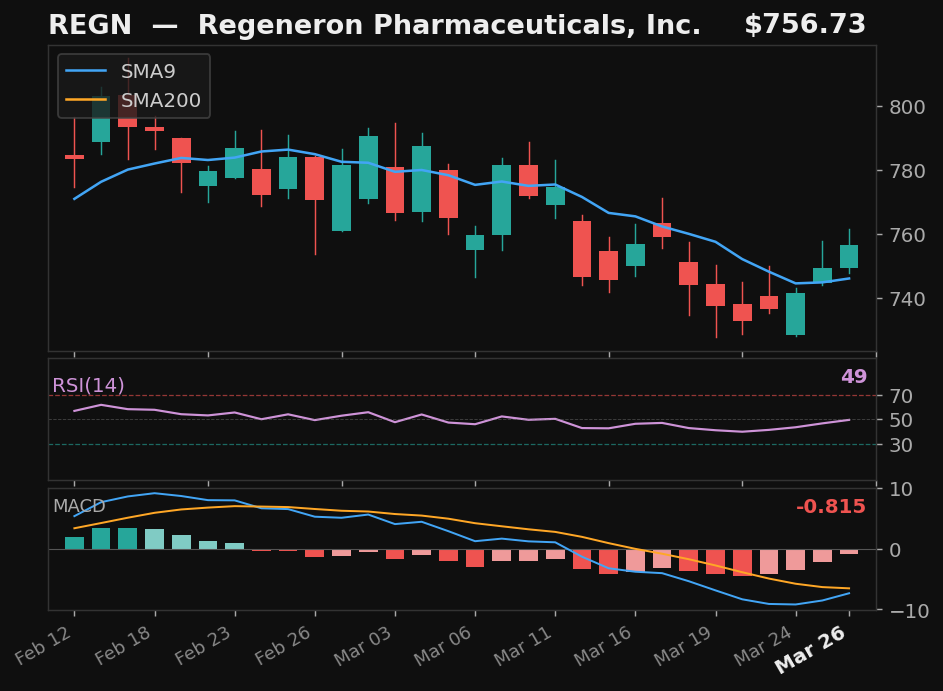
REGN
Regeneron Pharmaceuticals, Inc.
NASDAQ
- 7.5% pullback to SMA9
- Crossed above SMA9 — 2 days above
- RSI at 49, rising
- MACD histogram improving
Base✓Strict✓Score77.0
Returns
StockMktDiff
1D-2.5%-1.7%-0.8%
2D———
3D———
5D———
10D———
 click to enlarge
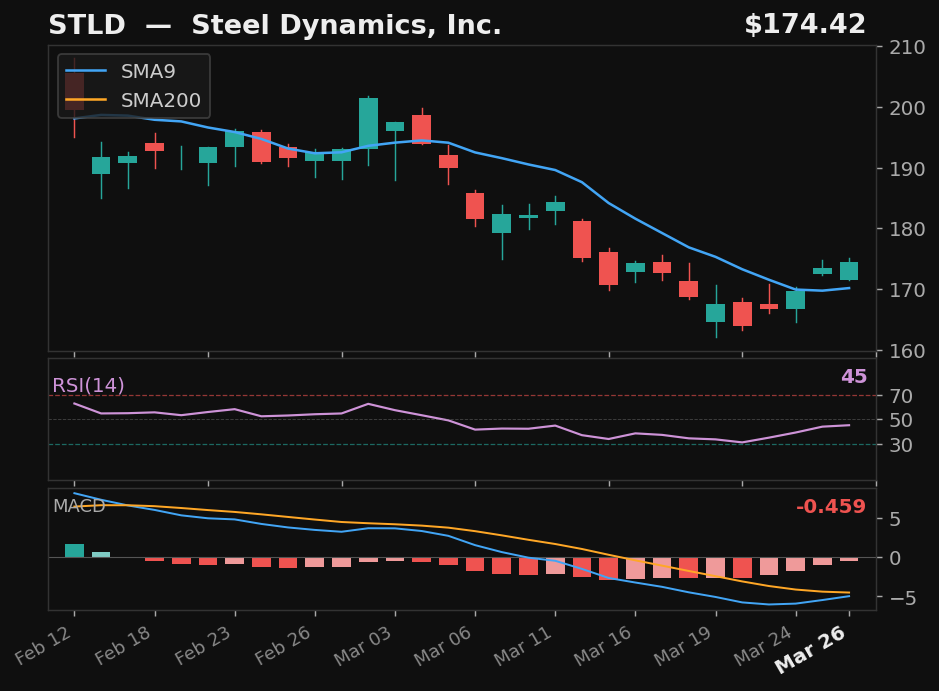
STLD
Steel Dynamics, Inc.
NASDAQ
- 17.0% pullback to SMA9
- Crossed above SMA9 — 2 days above
- RSI rising from 45 — recovering momentum
- MACD histogram improving
Base✓Strict✓Score69.0
Returns
StockMktDiff
1D-2.0%-1.7%-0.3%
2D———
3D———
5D———
10D———
 click to enlarge
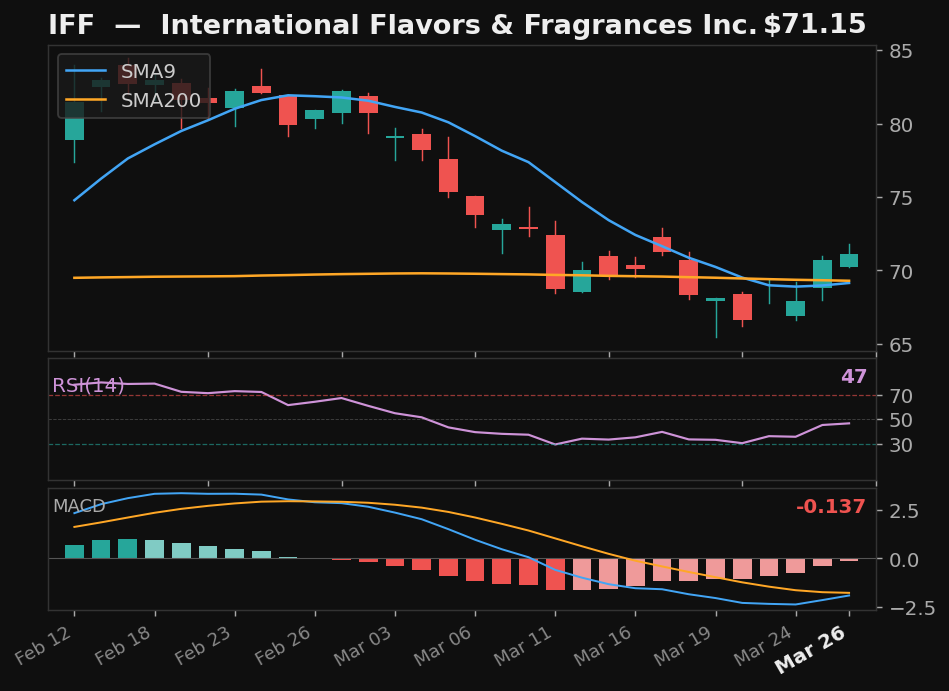
IFF
International Flavors & Fragrances Inc.
NYSE
- 19.0% pullback to SMA9
- Crossed above SMA9 — 2 days above
- RSI at 47, rising
- MACD histogram improving
Base✓Strict✓Score67.0
Returns
StockMktDiff
1D-0.2%-1.7%+1.5%
2D———
3D———
5D———
10D———
 click to enlarge
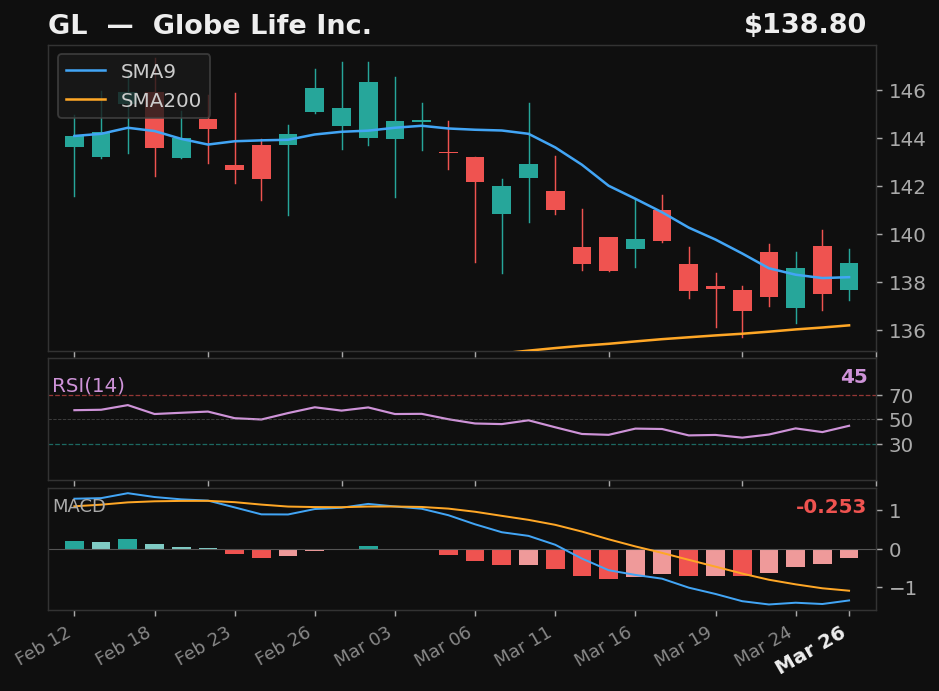
GL
Globe Life Inc.
NYSE
- 5.5% pullback to SMA9 — 1 day
- Crossed back above SMA9 today
- RSI rising from 45 — recovering momentum
- MACD histogram improving
Base✓Strict✗Score73.0
Returns
StockMktDiff
1D-2.7%-1.7%-1.0%
2D———
3D———
5D———
10D———
 click to enlarge
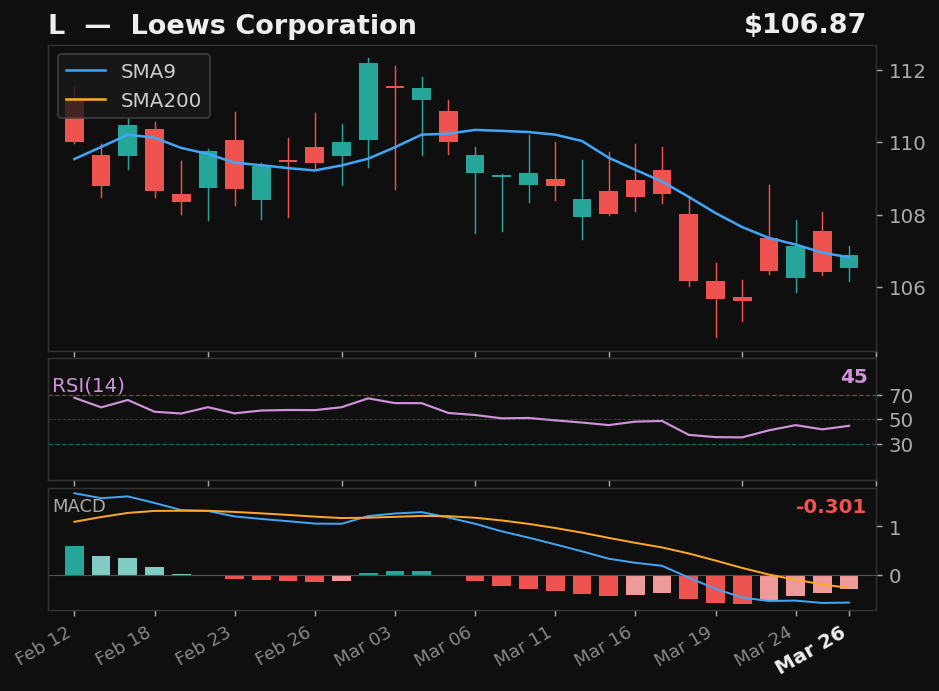
L
Loews Corporation
NYSE
- 5.3% pullback to SMA9 over 15 days
- Crossed back above SMA9 today
- RSI rising from 45 — recovering momentum
- MACD histogram improving
Base✓Strict✗Score66.0
Returns
StockMktDiff
1D-2.6%-1.7%-0.9%
2D———
3D———
5D———
10D———
 click to enlarge
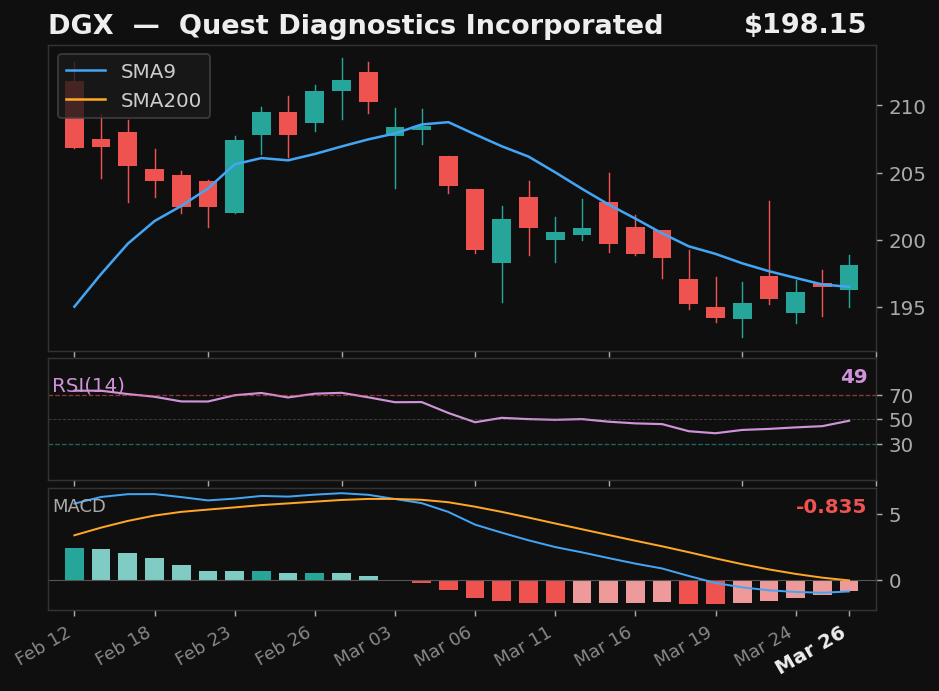
DGX
Quest Diagnostics Incorporated
NYSE
- 7.7% pullback to SMA9 over 16 days
- Crossed back above SMA9 today
- RSI at 49, rising
- MACD histogram improving
Base✓Strict✗Score60.0
Returns
StockMktDiff
1D-1.3%-1.7%+0.4%
2D———
3D———
5D———
10D———
 click to enlarge
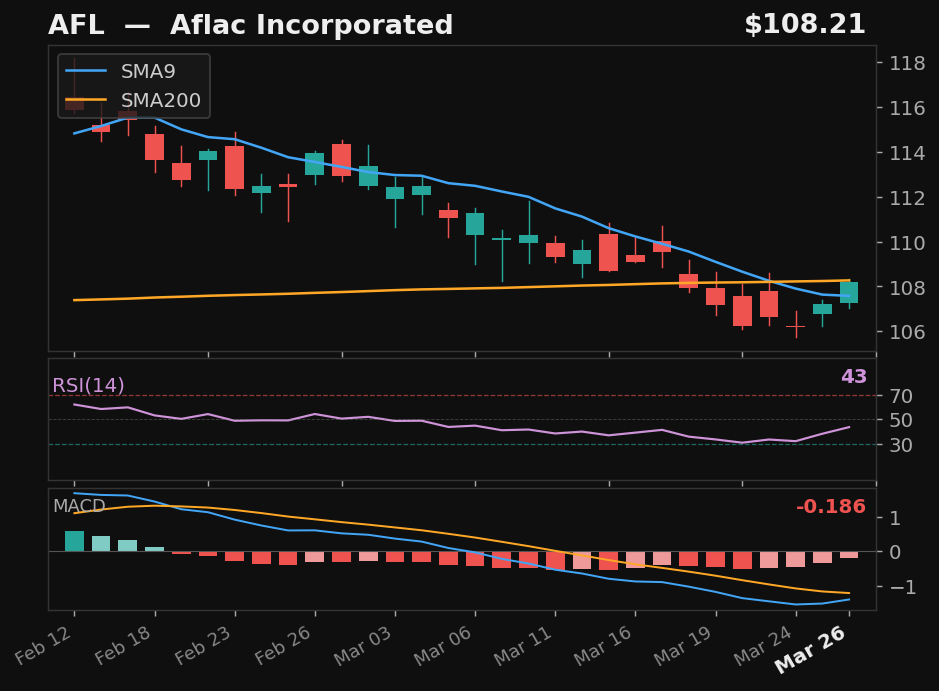
AFL
Aflac Incorporated
NYSE
- 8.4% pullback to SMA9 over 17 days
- Crossed back above SMA9 today
- RSI rising from 43 — recovering momentum
- MACD histogram improving
Base✓Strict✗Score59.0
Returns
StockMktDiff
1D-1.7%-1.7%+0.0%
2D———
3D———
5D———
10D———
Alternative Setups
3 candidates · ranked by Empirical Score
 click to enlarge
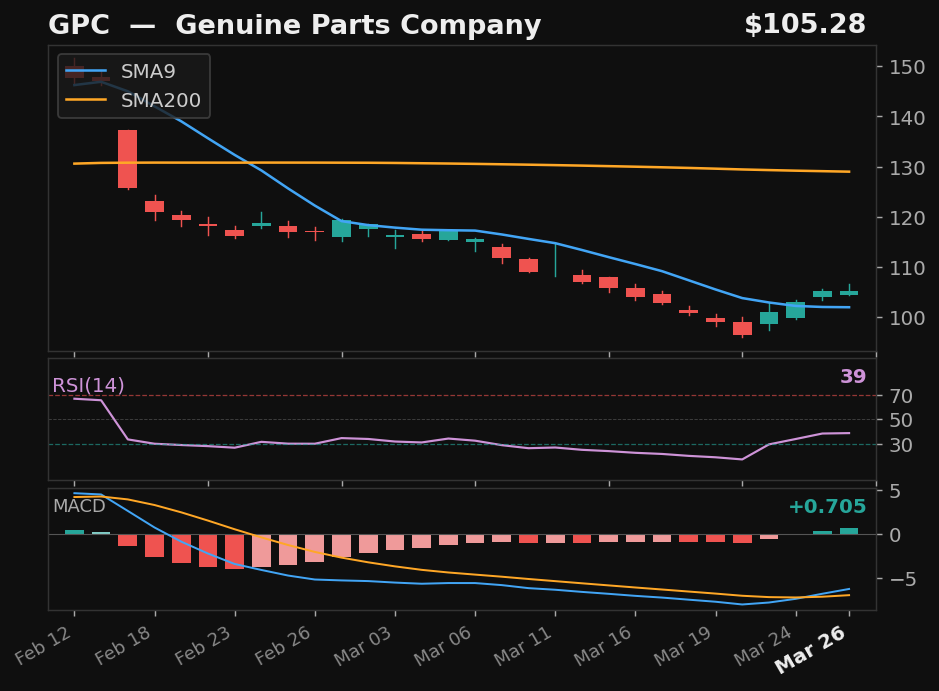
GPC
Genuine Parts Company
NYSE
- 34.5% pullback — full candle body above SMA9
- RSI rising from 39
- MACD bullish cross 1 day ago
- 18.4% below SMA200 — extended from trend
Emp Score74.5Body Above✓
Returns
StockMktDiff
1D-0.2%-1.7%+1.5%
2D———
3D———
5D———
10D———
 click to enlarge
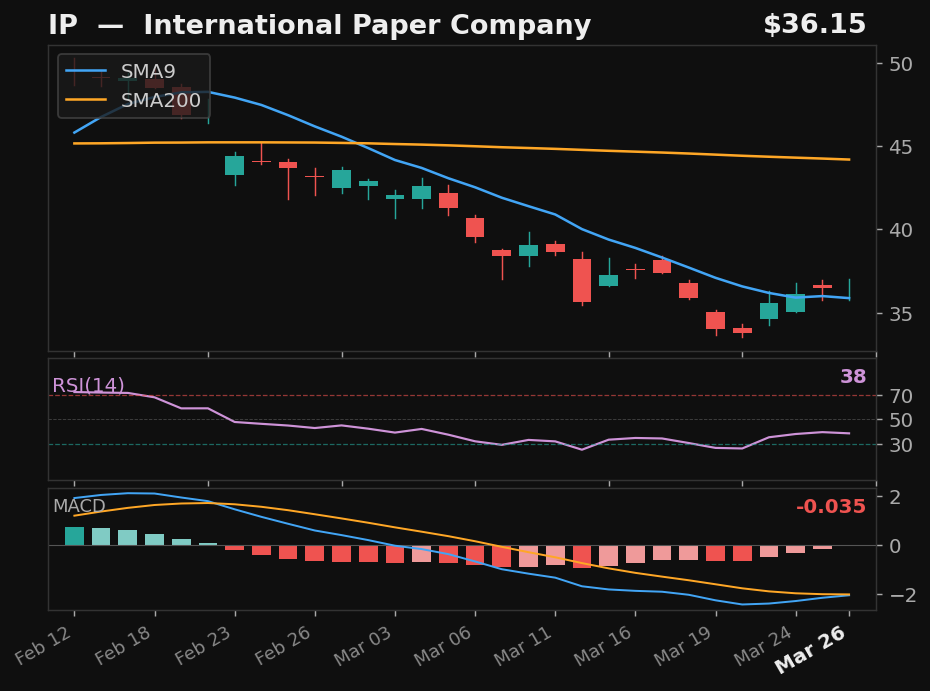
IP
International Paper Company
NYSE
- 30.4% pullback — full candle body above SMA9
- MACD histogram rising while still negative — early recovery signal
- 18.2% below SMA200 — extended from trend
Emp Score69.2Body Above✓
Returns
StockMktDiff
1D-1.9%-1.7%-0.2%
2D———
3D———
5D———
10D———
 click to enlarge
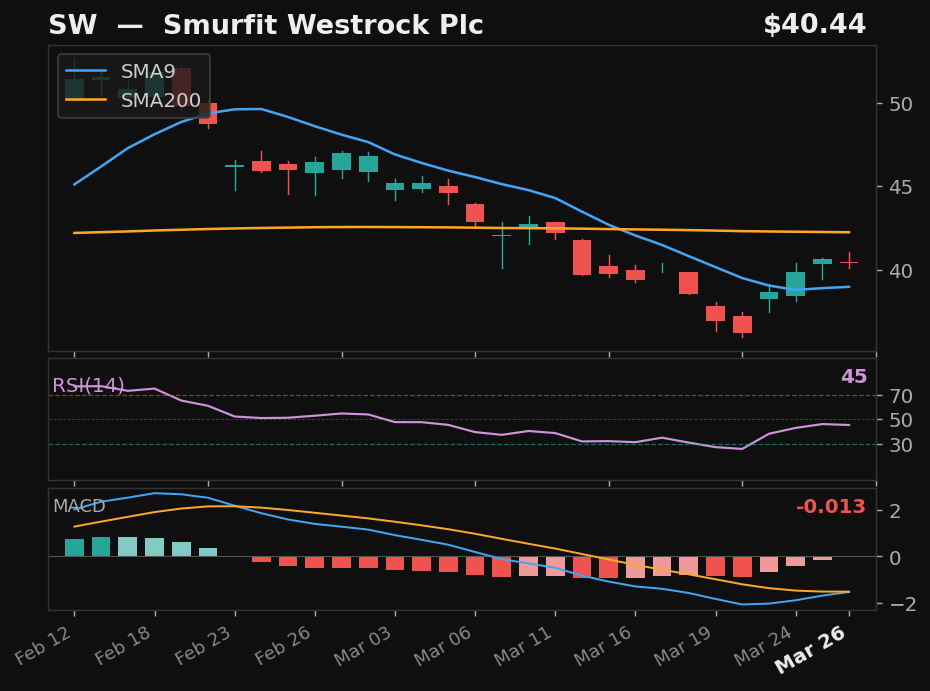
SW
Smurfit Westrock Plc
NYSE
- 27.3% pullback — full candle body above SMA9
- MACD histogram rising while still negative — early recovery signal
Emp Score58.8Body Above✓
Returns
StockMktDiff
1D-2.5%-1.7%-0.8%
2D———
3D———
5D———
10D———