Wednesday, April 1, 2026 · After Close
SwingTrader Setups
10 candidates
 click to enlarge
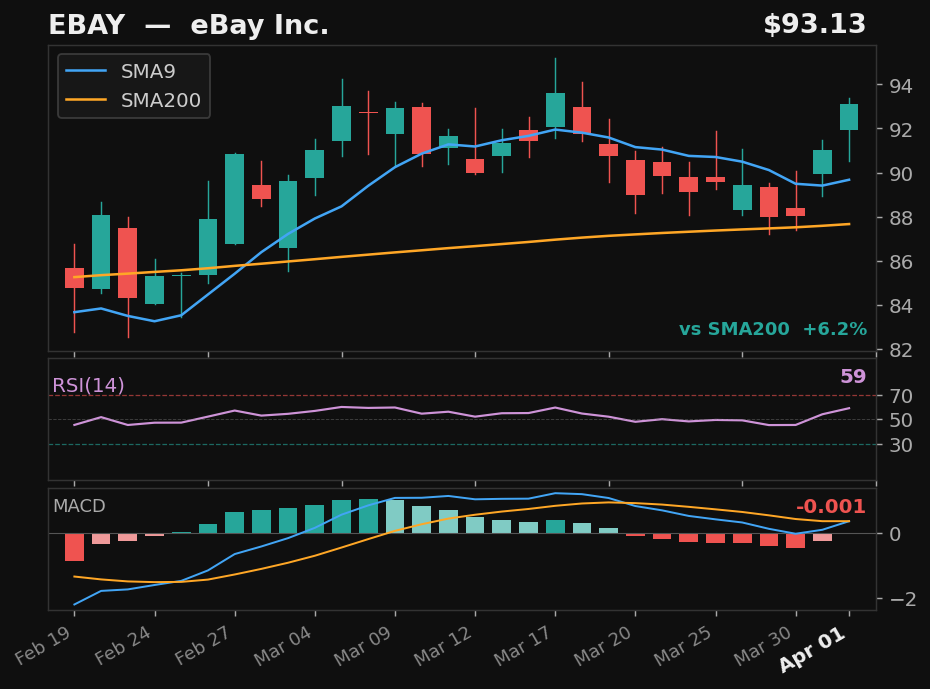
EBAY
eBay Inc.
NASDAQ
- 6.0% pullback to SMA9
- Crossed above SMA9 — 2 days above
- RSI at 58, rising
- MACD histogram improving
Base✓Strict✓Score84.0
Returns
StockMktDiff
1D———
2D———
3D———
5D———
10D———
results pending next close
 click to enlarge
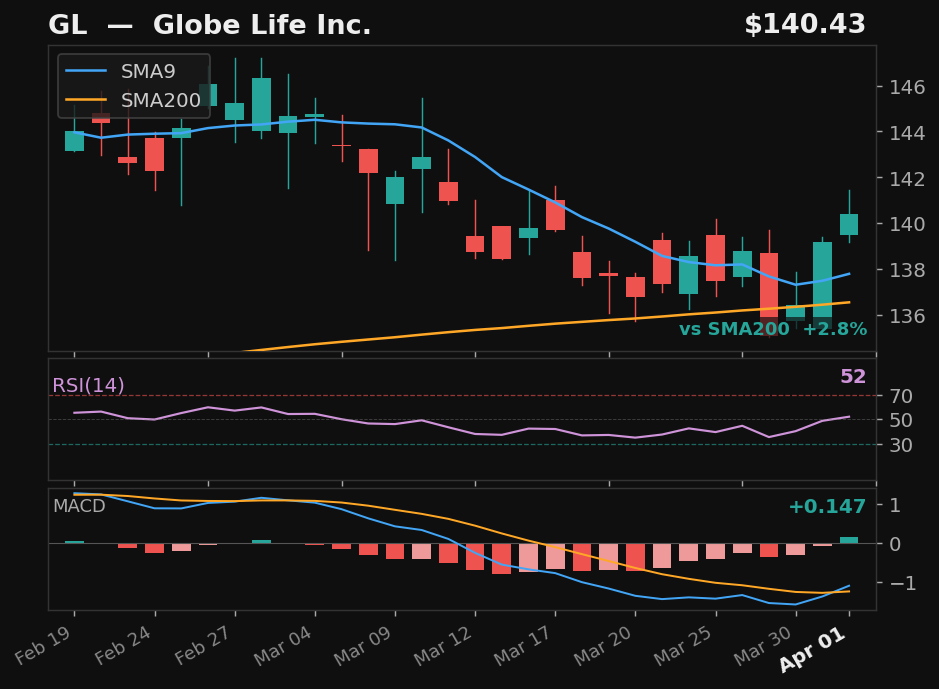
GL
Globe Life Inc.
NYSE
- 6.7% pullback to SMA9
- Crossed above SMA9 — 2 days above
- RSI at 52, rising
- MACD histogram improving
Base✓Strict✓Score83.0
Returns
StockMktDiff
1D———
2D———
3D———
5D———
10D———
results pending next close
 click to enlarge
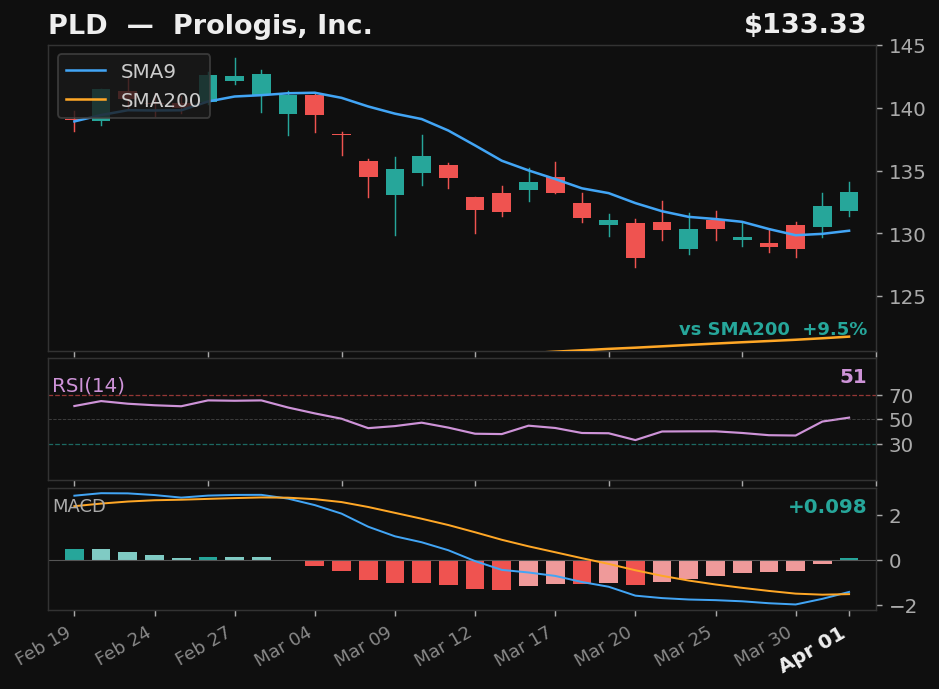
PLD
Prologis, Inc.
NYSE
- 10.3% pullback to SMA9
- Crossed above SMA9 — 2 days above
- RSI at 51, rising
- MACD histogram improving
Base✓Strict✓Score80.0
Returns
StockMktDiff
1D———
2D———
3D———
5D———
10D———
results pending next close
 click to enlarge
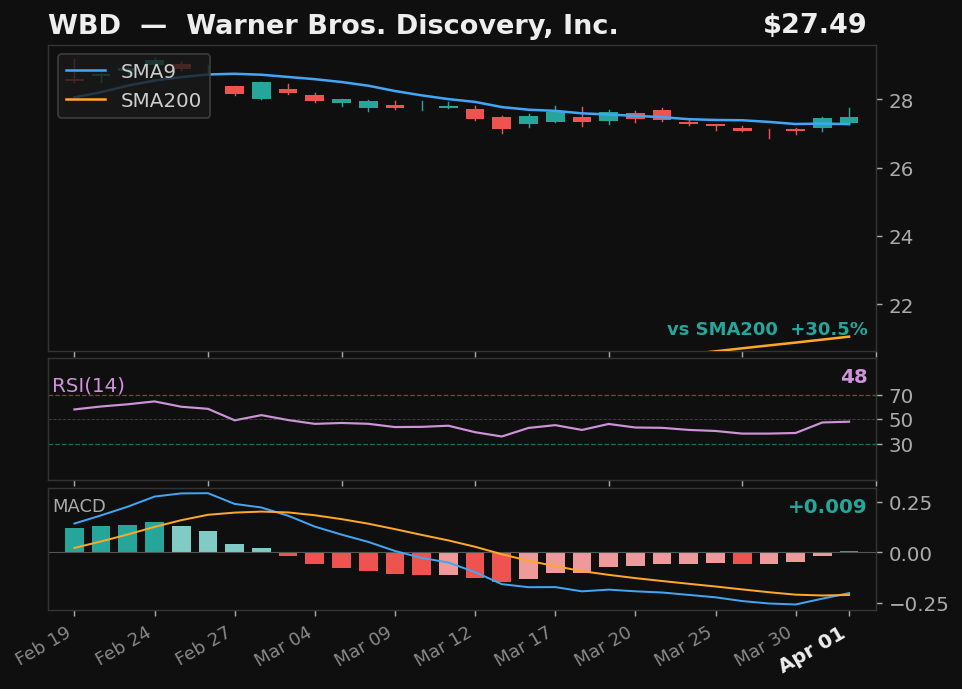
WBD
Warner Bros. Discovery, Inc.
NASDAQ
- 6.0% pullback to SMA9
- Crossed above SMA9 — 2 days above
- RSI at 47, rising
- MACD histogram improving
Base✓Strict✓Score80.0
Returns
StockMktDiff
1D———
2D———
3D———
5D———
10D———
results pending next close
 click to enlarge
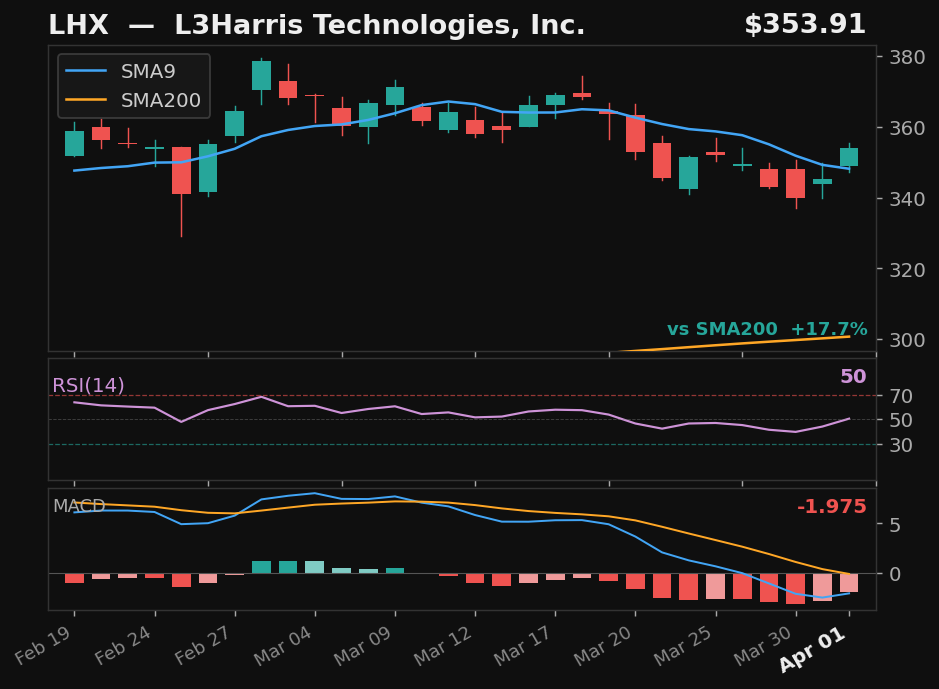
LHX
L3Harris Technologies, Inc.
NYSE
- 7.7% pullback to SMA9 over 9 days
- Crossed back above SMA9 today
- RSI at 50, rising
- MACD histogram improving
Base✓Strict✓Score78.0
Returns
StockMktDiff
1D———
2D———
3D———
5D———
10D———
results pending next close
 click to enlarge
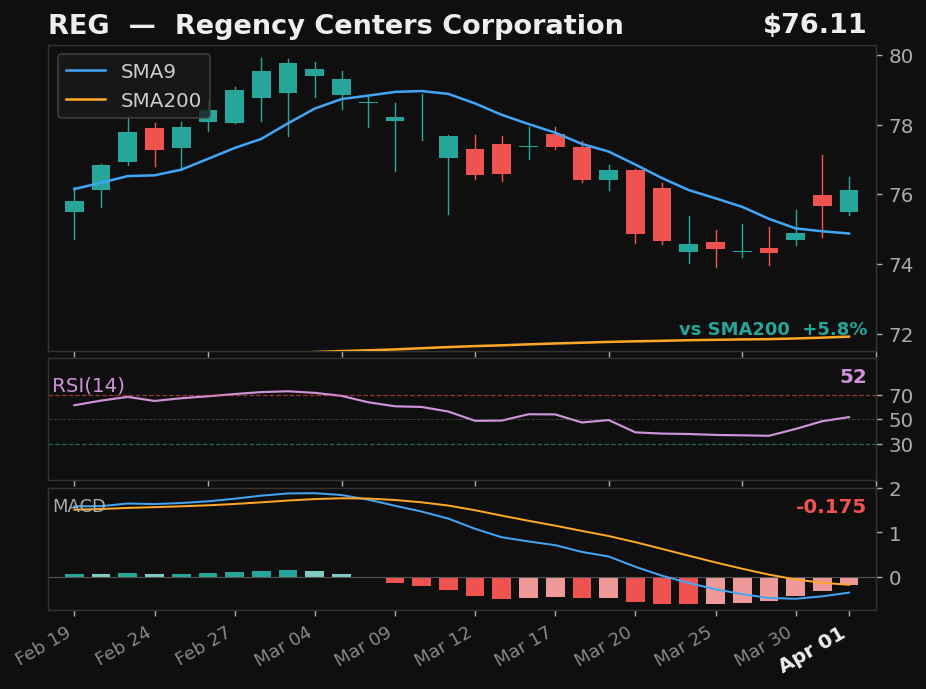
REG
Regency Centers Corporation
NASDAQ
- 6.3% pullback to SMA9
- Crossed above SMA9 — 2 days above
- RSI at 52, rising
- MACD histogram improving
Base✓Strict✓Score78.0
Returns
StockMktDiff
1D———
2D———
3D———
5D———
10D———
results pending next close
 click to enlarge
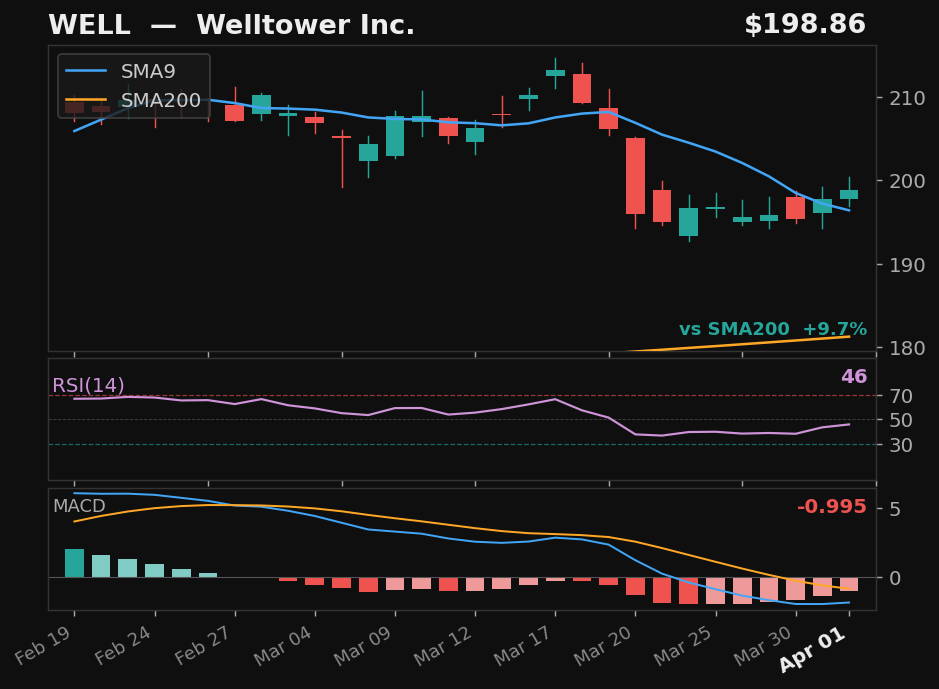
WELL
Welltower Inc.
NYSE
- 6.8% pullback to SMA9
- Crossed above SMA9 — 2 days above
- RSI at 45, rising
- MACD histogram improving
Base✓Strict✓Score78.0
Returns
StockMktDiff
1D———
2D———
3D———
5D———
10D———
results pending next close
 click to enlarge
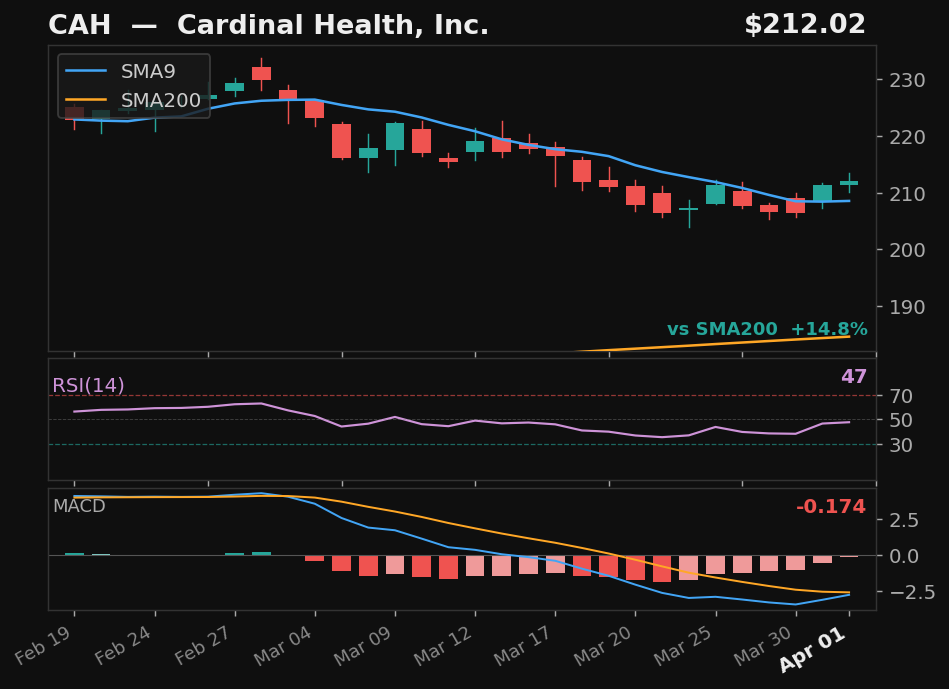
CAH
Cardinal Health, Inc.
NYSE
- 8.9% pullback to SMA9
- Crossed above SMA9 — 2 days above
- RSI at 47, rising
- MACD histogram improving
Base✓Strict✓Score77.0
Returns
StockMktDiff
1D———
2D———
3D———
5D———
10D———
results pending next close
 click to enlarge
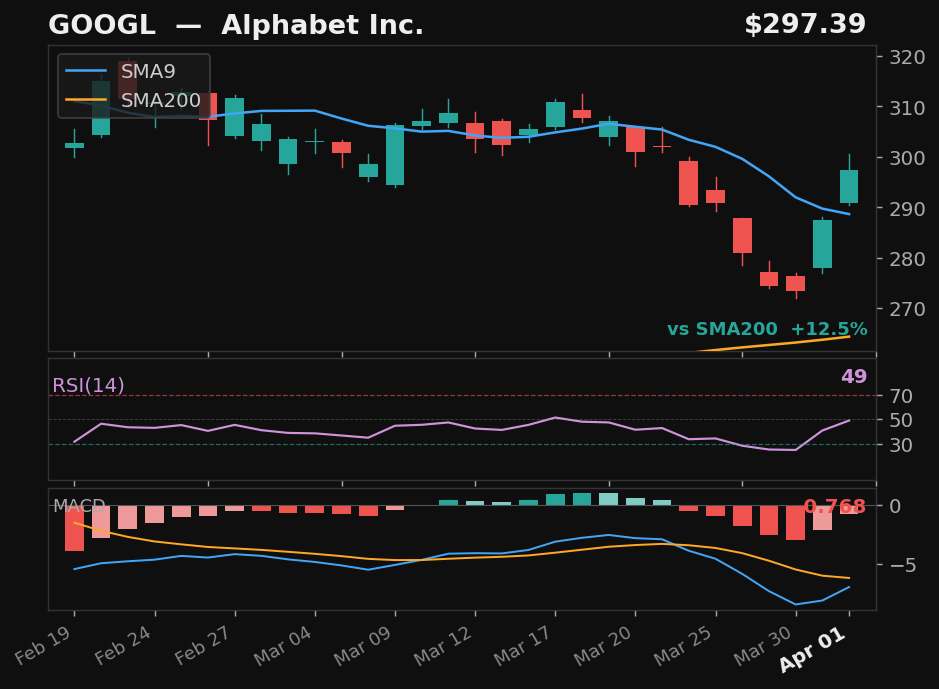
GOOGL
Alphabet Inc.
NASDAQ
- 11.1% pullback to SMA9 over 8 days
- Crossed back above SMA9 today
- RSI at 49, rising
- MACD histogram improving
Base✓Strict✓Score77.0
Returns
StockMktDiff
1D———
2D———
3D———
5D———
10D———
results pending next close
 click to enlarge
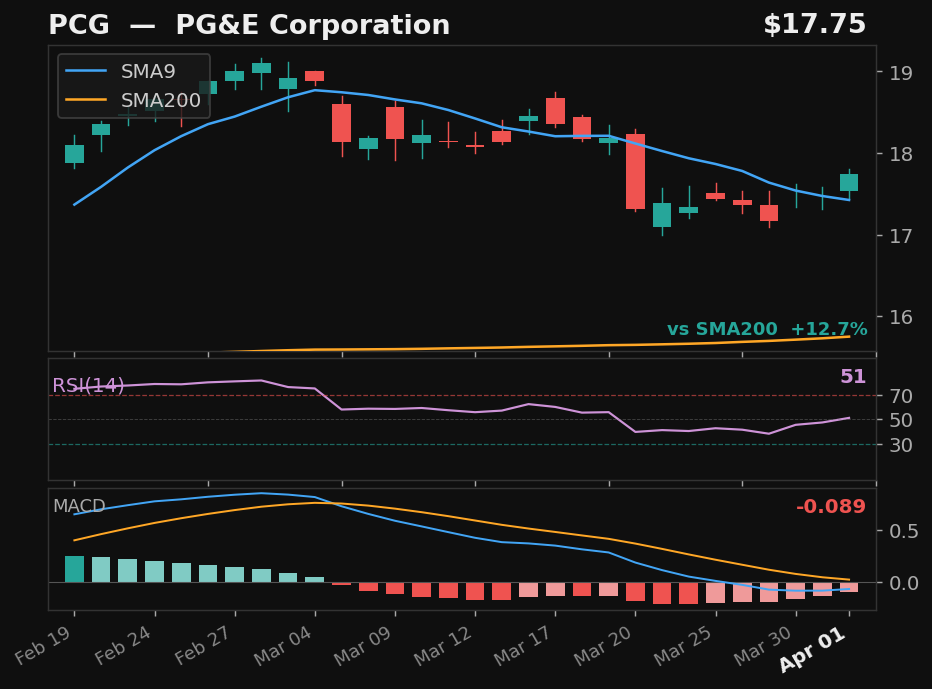
PCG
PG&E Corporation
NYSE
- 6.5% pullback to SMA9
- Crossed above SMA9 — 2 days above
- RSI at 51, rising
- MACD histogram improving
Base✓Strict✓Score77.0
Returns
StockMktDiff
1D———
2D———
3D———
5D———
10D———
results pending next close
Alternative Setups
3 candidates · ranked by Empirical Score
 click to enlarge
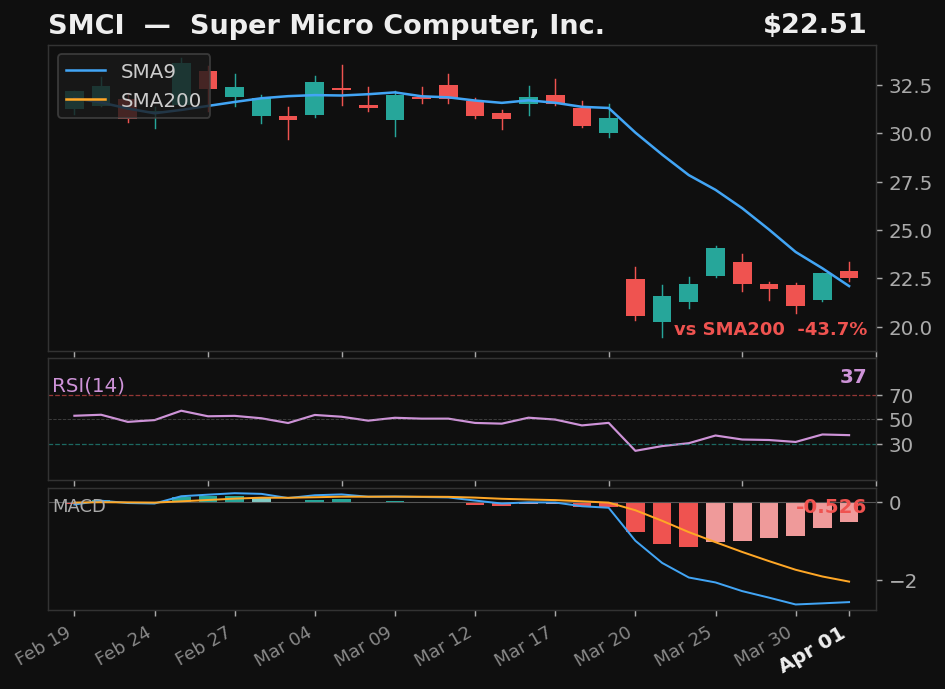
SMCI
Super Micro Computer, Inc.
NASDAQ
- 36.3% pullback over 11 days — full candle above SMA9
- MACD histogram rising while still negative — early recovery signal
- 43.7% below SMA200 — extended from trend
Emp Score88.8Body Above✓
Returns
StockMktDiff
1D———
2D———
3D———
5D———
10D———
results pending next close
 click to enlarge
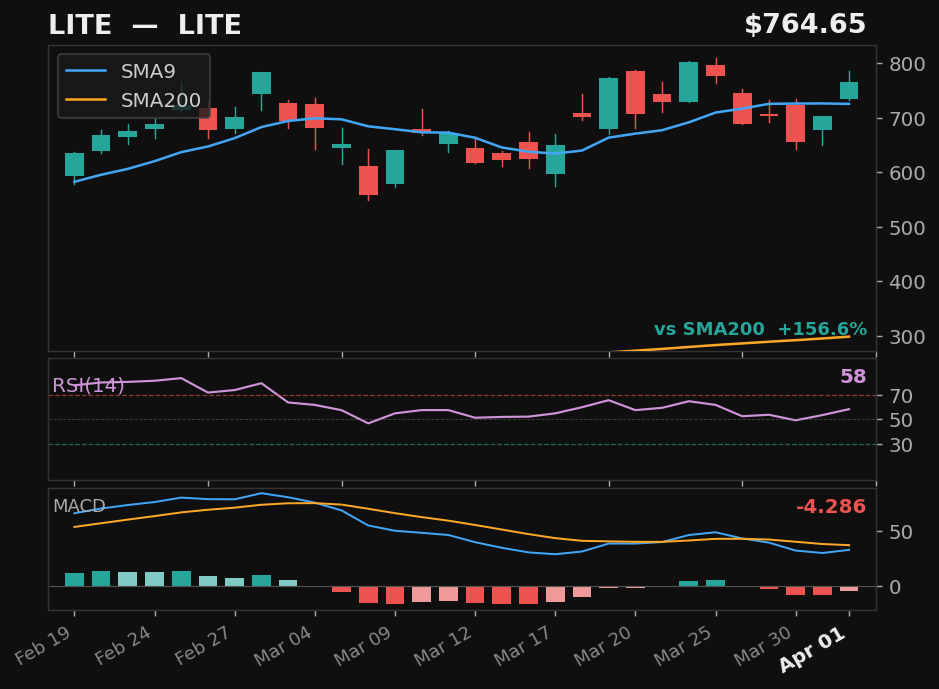
LITE
LITE
NASDAQ
- 15.7% pullback over 4 days — full candle above SMA9
- RSI at 58 — confirmed recovery momentum
- MACD histogram rising while still negative — early recovery signal
- 156.6% above SMA200 — extended from trend
Emp Score86.5Body Above✓
Returns
StockMktDiff
1D———
2D———
3D———
5D———
10D———
results pending next close
 click to enlarge
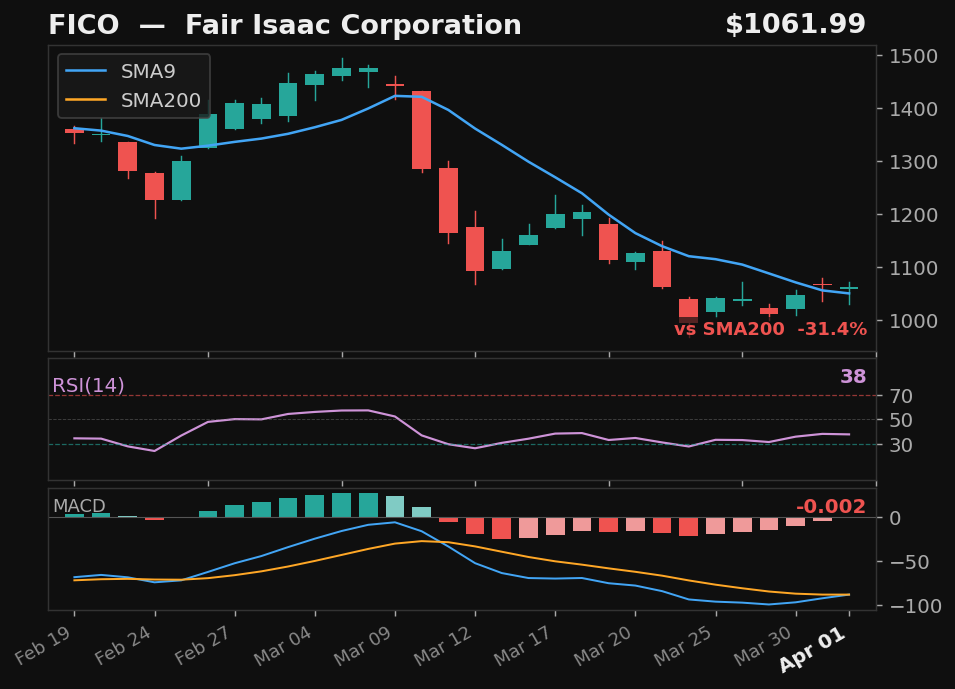
FICO
Fair Isaac Corporation
NYSE
- 31.0% pullback — full candle body above SMA9
- MACD histogram rising while still negative — early recovery signal
- 31.4% below SMA200 — extended from trend
Emp Score74.3Body Above✓
Returns
StockMktDiff
1D———
2D———
3D———
5D———
10D———
results pending next close