Thursday, April 2, 2026 · After Close
SwingTrader Setups
10 candidates
 click to enlarge
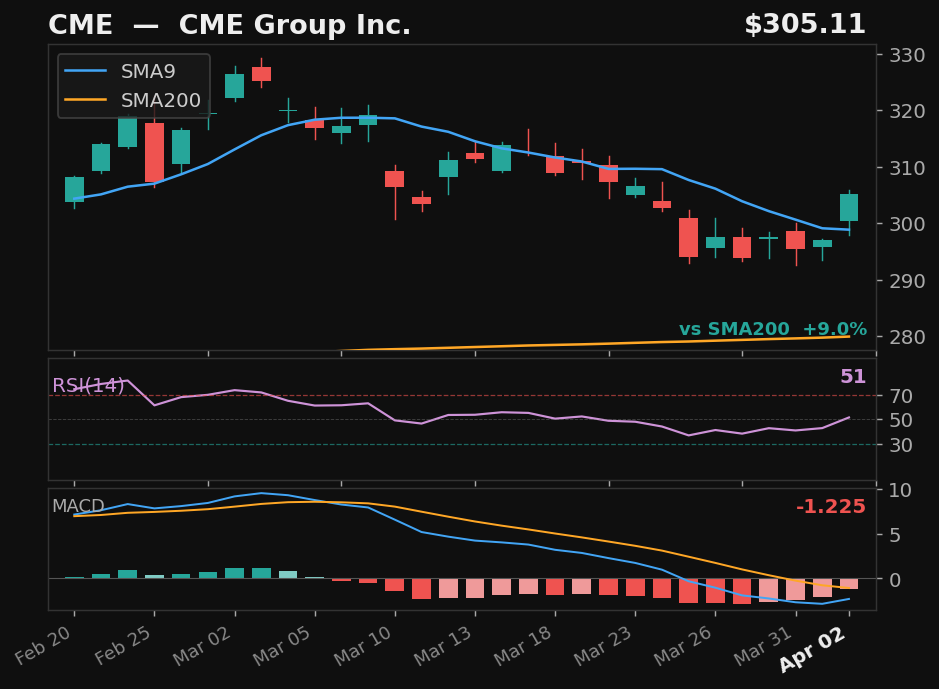
CME
CME Group Inc.
NASDAQ
- 6.2% pullback to SMA9 over 11 days
- Crossed back above SMA9 today
- RSI at 52, rising
- MACD histogram improving
Base✓Strict✓Score80.0
Returns
StockMktDiff
1D———
2D———
3D———
5D———
10D———
results pending next close
 click to enlarge
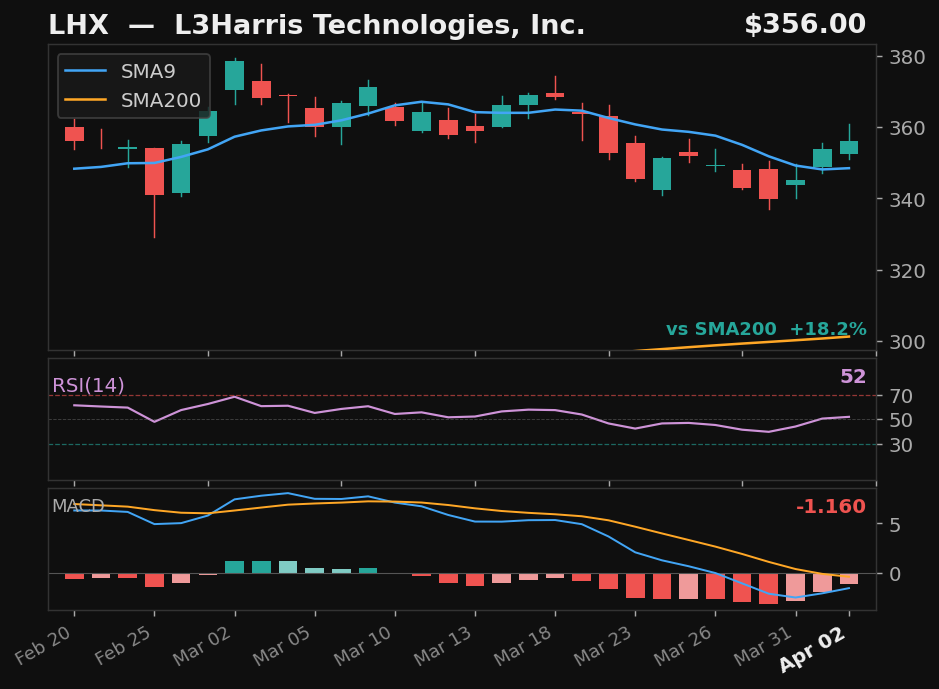
LHX
L3Harris Technologies, Inc.
NYSE
- 7.7% pullback to SMA9
- Crossed above SMA9 — 2 days above
- RSI at 52, rising
- MACD histogram improving
Base✓Strict✓Score79.0
Returns
StockMktDiff
1D———
2D———
3D———
5D———
10D———
results pending next close
 click to enlarge
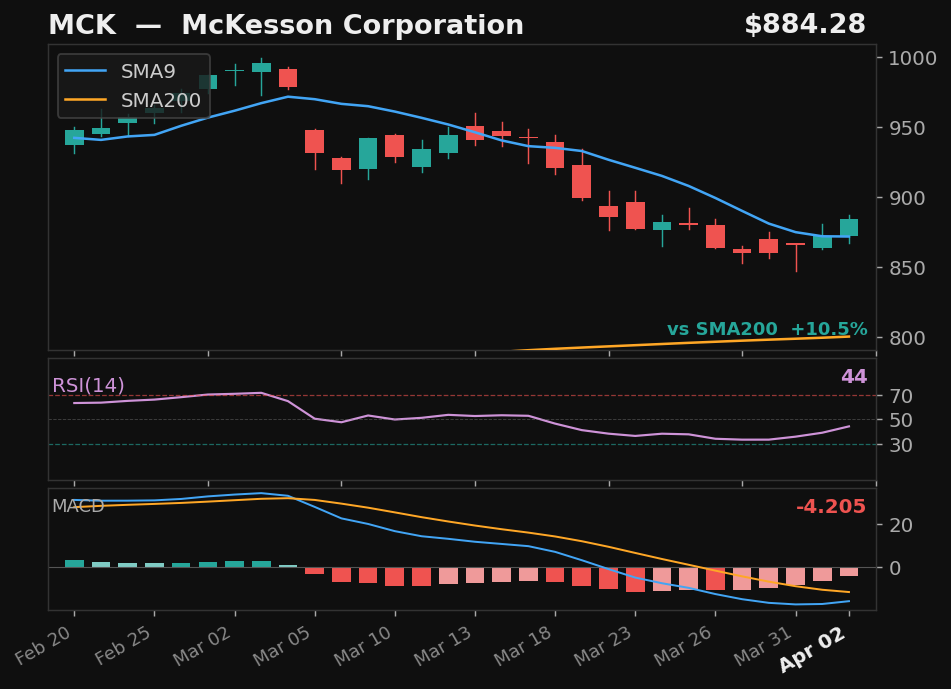
MCK
McKesson Corporation
NYSE
- 8.7% pullback to SMA9
- Crossed above SMA9 — 2 days above
- RSI rising from 45 — recovering momentum
- MACD histogram improving
Base✓Strict✓Score77.0
Returns
StockMktDiff
1D———
2D———
3D———
5D———
10D———
results pending next close
 click to enlarge
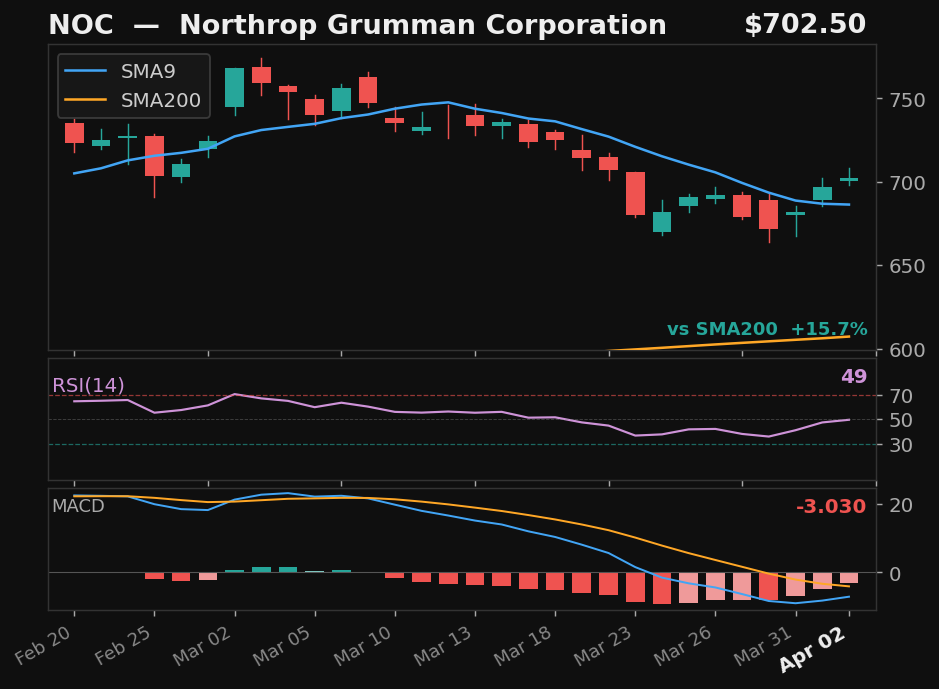
NOC
Northrop Grumman Corporation
NYSE
- 10.1% pullback to SMA9
- Crossed above SMA9 — 2 days above
- RSI at 49, rising
- MACD histogram improving
Base✓Strict✓Score73.0
Returns
StockMktDiff
1D———
2D———
3D———
5D———
10D———
results pending next close
 click to enlarge
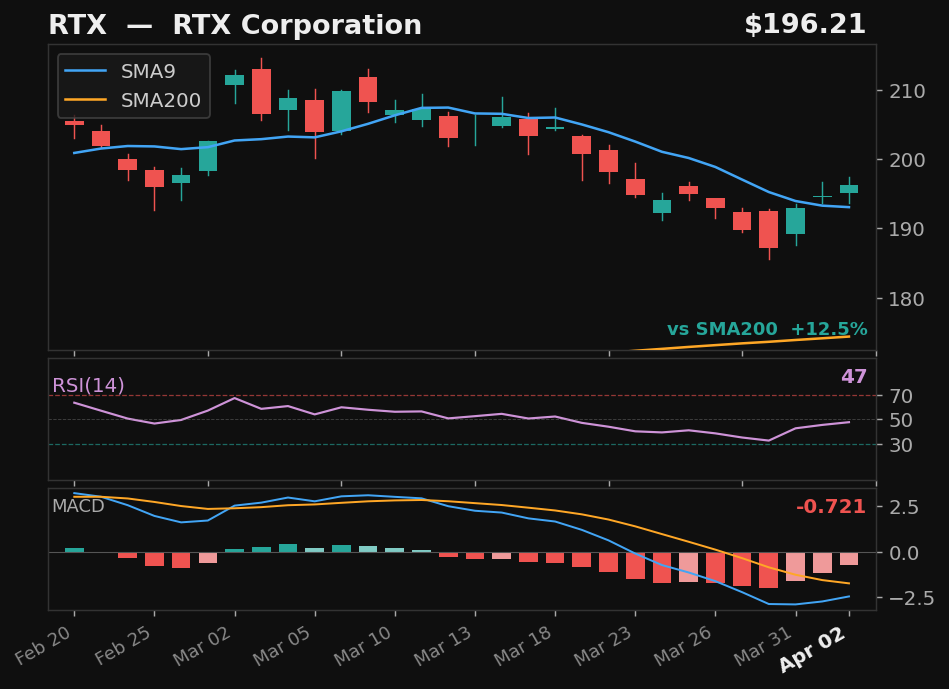
RTX
RTX Corporation
NYSE
- 9.7% pullback to SMA9
- Crossed above SMA9 — 2 days above
- RSI at 47, rising
- MACD histogram improving
Base✓Strict✓Score73.0
Returns
StockMktDiff
1D———
2D———
3D———
5D———
10D———
results pending next close
 click to enlarge
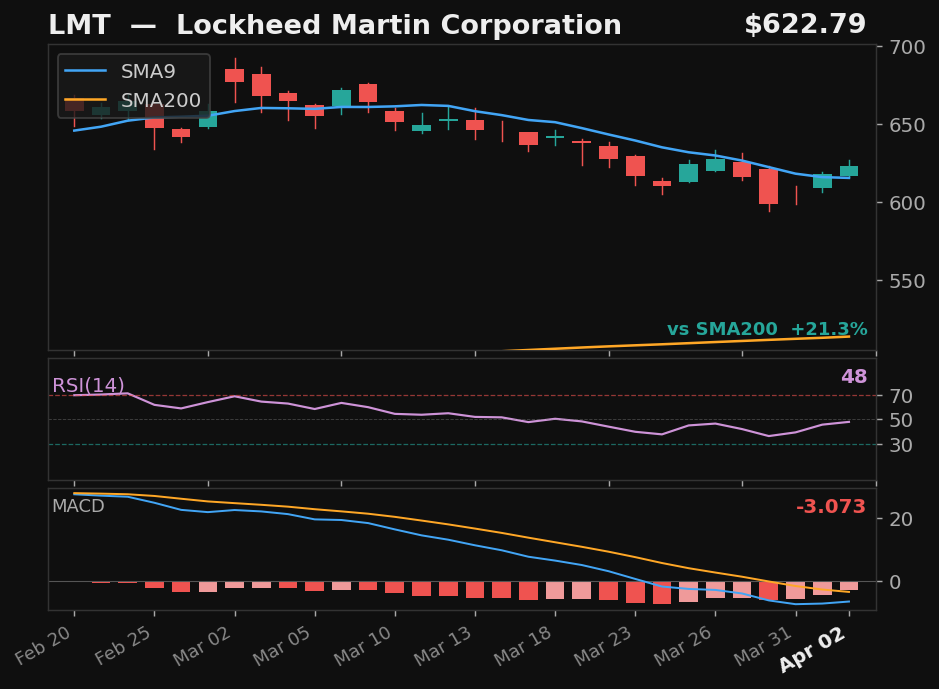
LMT
Lockheed Martin Corporation
NYSE
- 9.9% pullback to SMA9
- Crossed above SMA9 — 2 days above
- RSI at 48, rising
- MACD histogram improving
Base✓Strict✓Score72.0
Returns
StockMktDiff
1D———
2D———
3D———
5D———
10D———
results pending next close
 click to enlarge
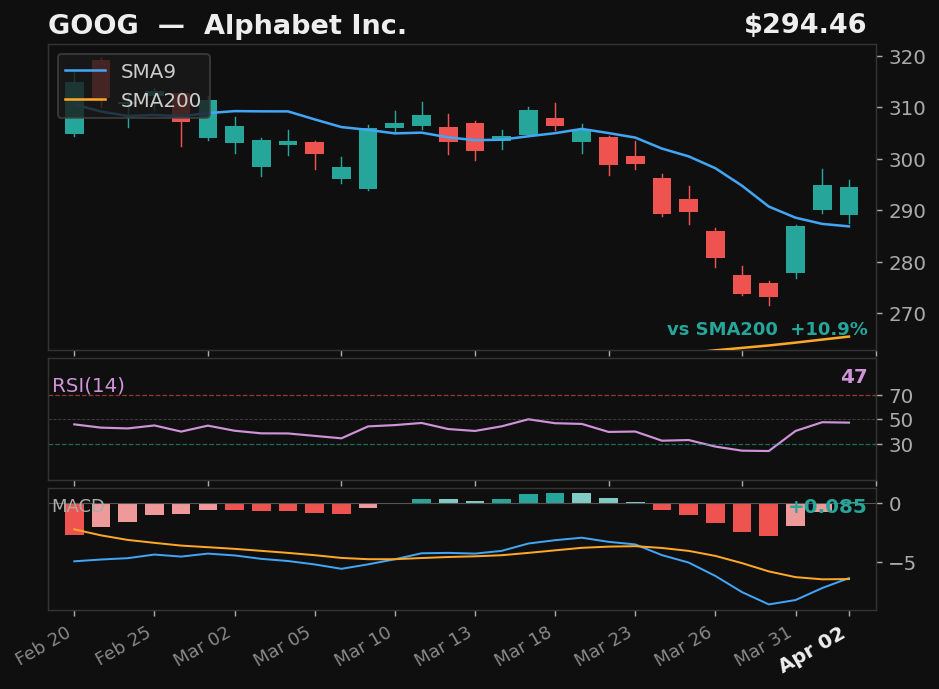
GOOG
Alphabet Inc.
NASDAQ
- 10.8% pullback to SMA9
- Crossed above SMA9 — 2 days above
- MACD histogram improving
- Long-term uptrend intact
Base✓Strict✓Score71.0
Returns
StockMktDiff
1D———
2D———
3D———
5D———
10D———
results pending next close
 click to enlarge
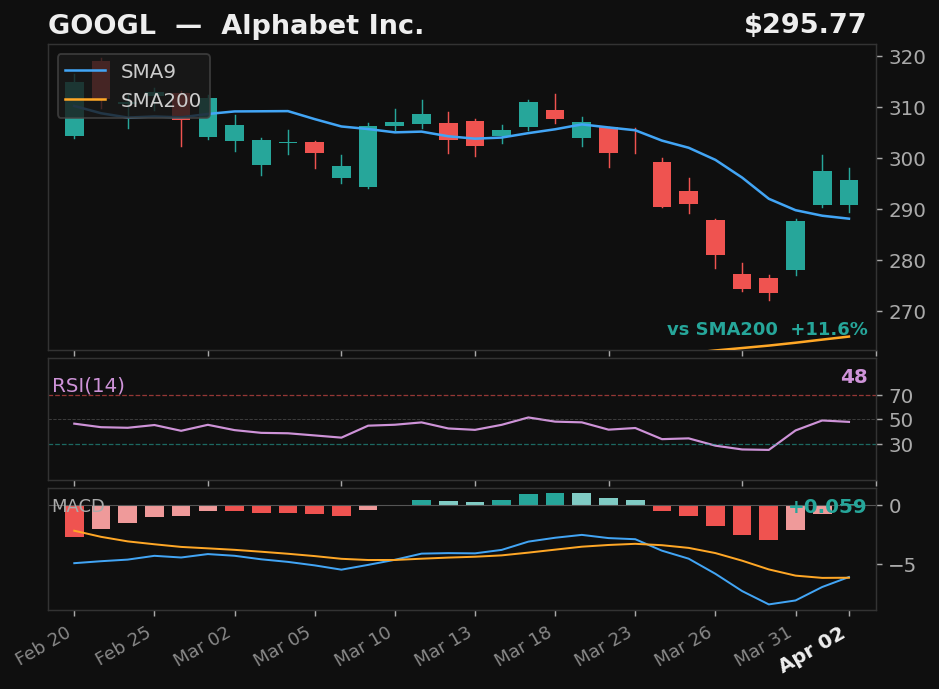
GOOGL
Alphabet Inc.
NASDAQ
- 11.1% pullback to SMA9
- Crossed above SMA9 — 2 days above
- MACD histogram improving
- Long-term uptrend intact
Base✓Strict✓Score71.0
Returns
StockMktDiff
1D———
2D———
3D———
5D———
10D———
results pending next close
 click to enlarge
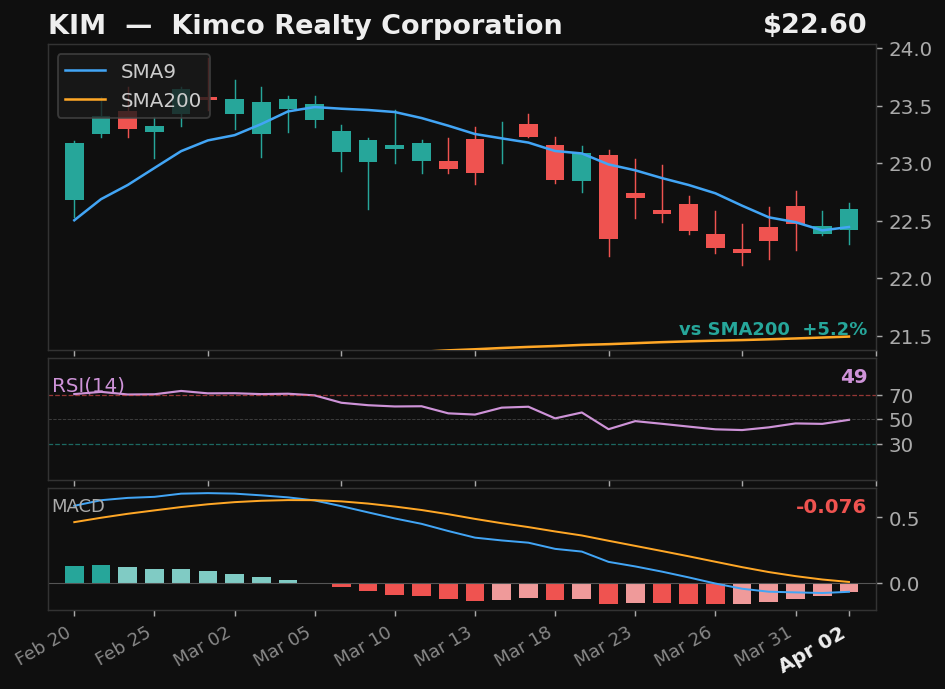
KIM
Kimco Realty Corporation
NYSE
- 4.3% pullback to SMA9
- Crossed above SMA9 — 2 days above
- RSI at 49, rising
- MACD histogram improving
Base✓Strict✗Score67.0
Returns
StockMktDiff
1D———
2D———
3D———
5D———
10D———
results pending next close
 click to enlarge
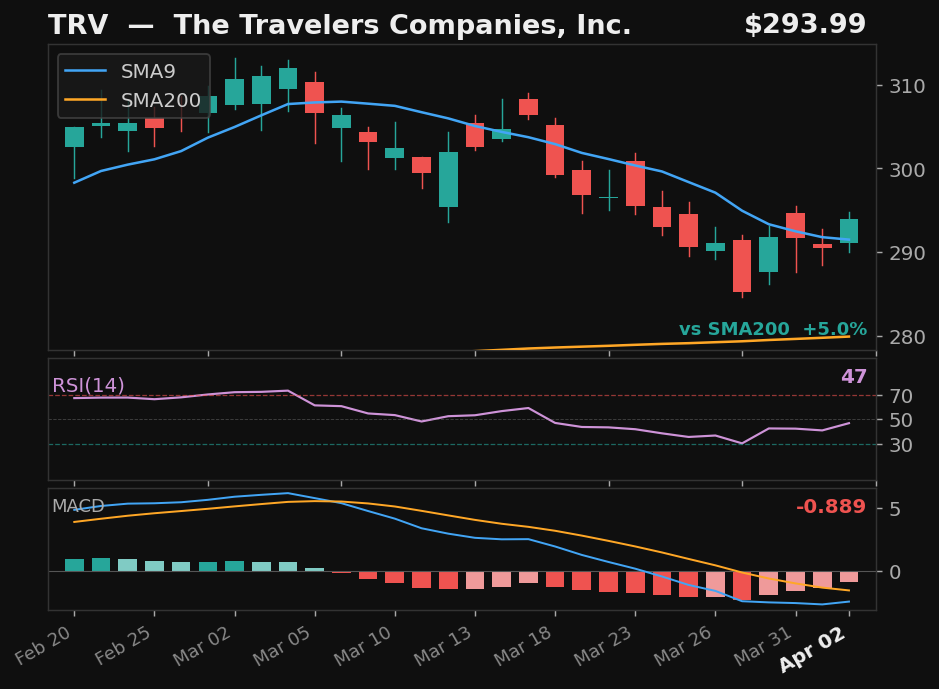
TRV
The Travelers Companies, Inc.
NYSE
- 6.9% pullback to SMA9 over 11 days
- Crossed back above SMA9 today
- RSI at 48, rising
- MACD histogram improving
Base✓Strict✗Score63.0
Returns
StockMktDiff
1D———
2D———
3D———
5D———
10D———
results pending next close
Alternative Setups
3 candidates · ranked by Empirical Score
 click to enlarge
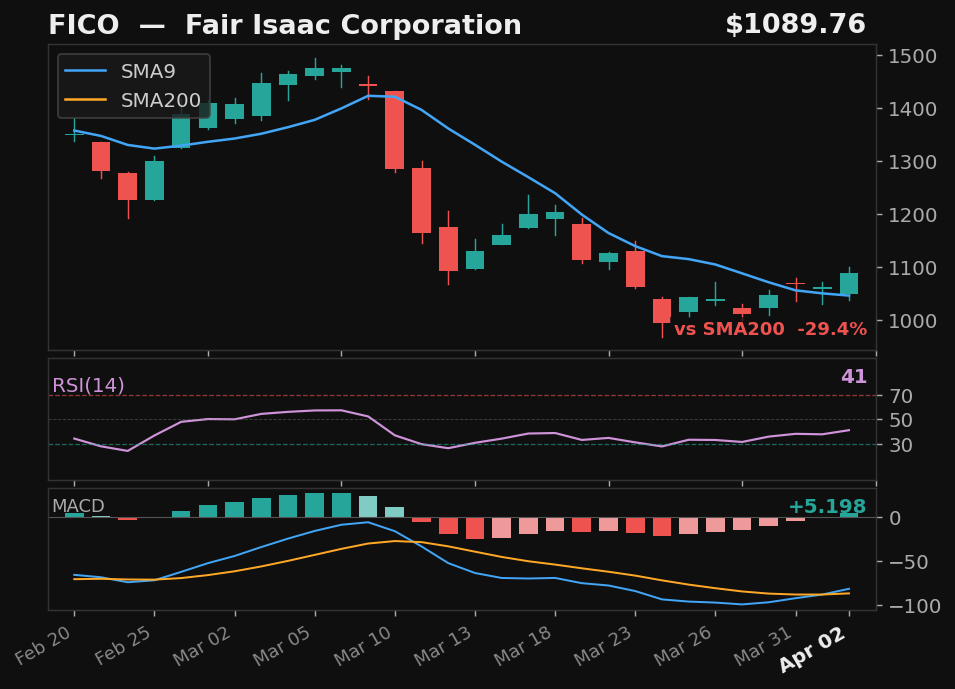
FICO
Fair Isaac Corporation
NYSE
- 31.0% pullback — full candle body above SMA9
- RSI rising from 41
- 29.4% below SMA200 — extended from trend
Emp Score70.7Body Above✓
Returns
StockMktDiff
1D———
2D———
3D———
5D———
10D———
results pending next close
 click to enlarge
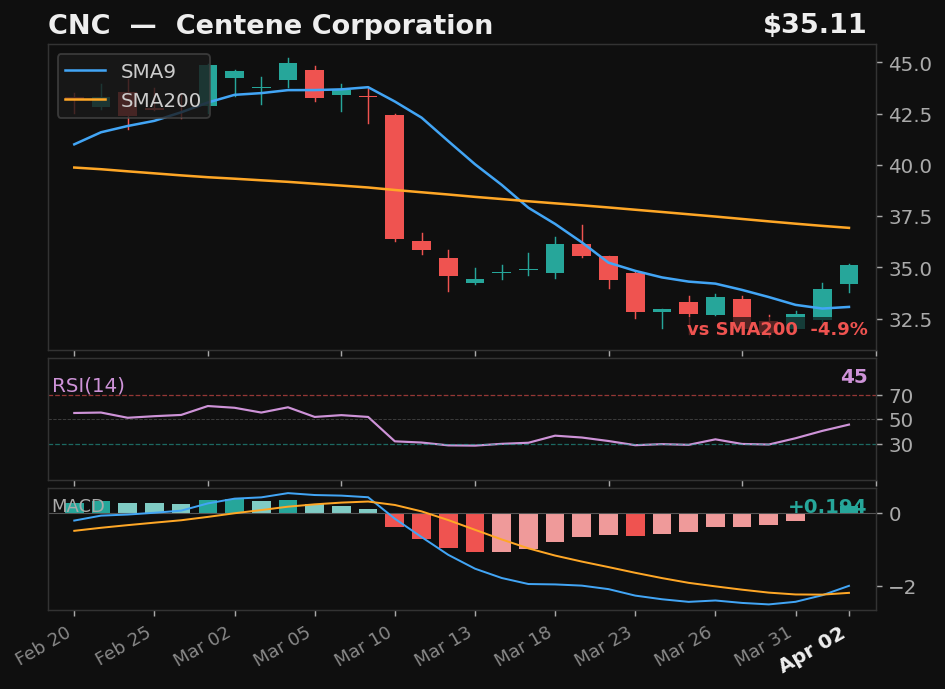
CNC
Centene Corporation
NYSE
- 29.3% pullback — full candle body above SMA9
- RSI rising from 45
- MACD bullish cross 1 day ago
Emp Score60.1Body Above✓
Returns
StockMktDiff
1D———
2D———
3D———
5D———
10D———
results pending next close
 click to enlarge
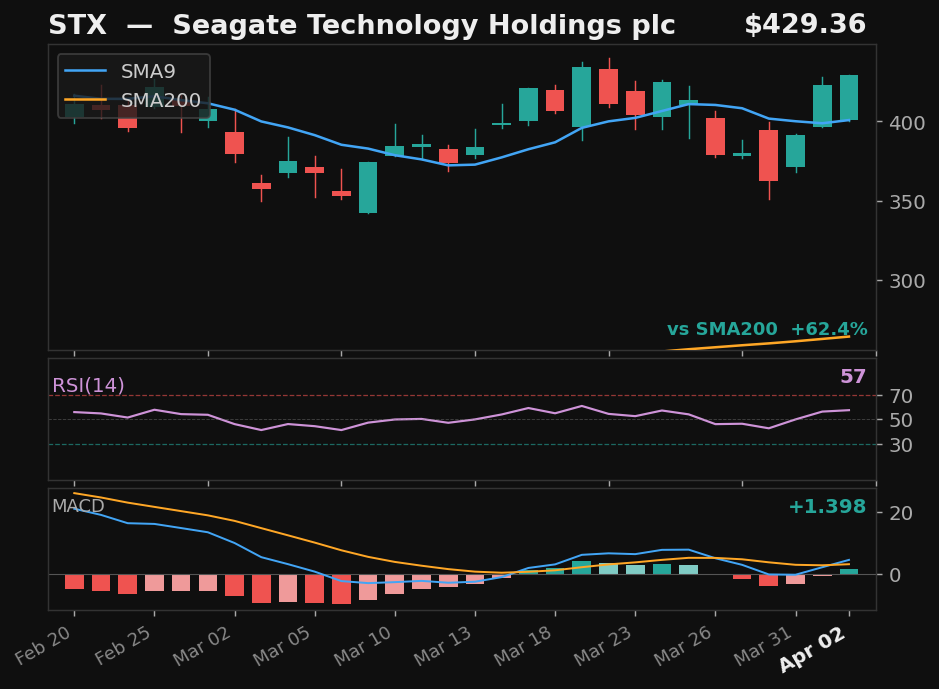
STX
Seagate Technology Holdings plc
NASDAQ
- 14.7% pullback — full candle body above SMA9
- RSI at 58 — confirmed recovery momentum
- 62.4% above SMA200 — extended from trend
Emp Score53.1Body Above✓
Returns
StockMktDiff
1D———
2D———
3D———
5D———
10D———
results pending next close