Monday, April 6, 2026 · After Close
★ Highlights
3
▼
 click to enlarge
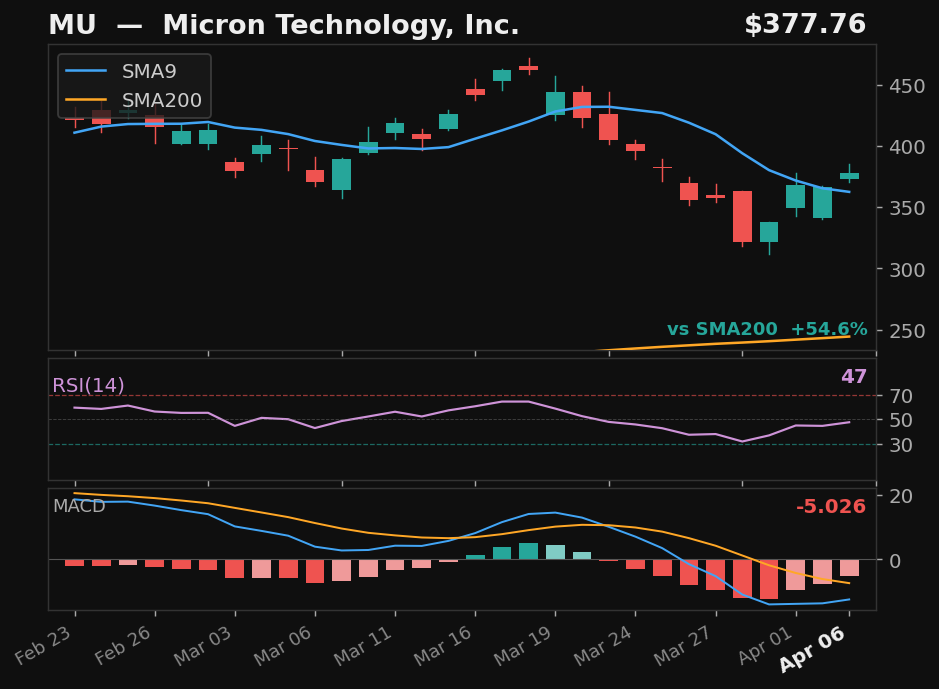
MU
Micron Technology, Inc.
NASDAQ
- 30.3% pullback to SMA9 over 9 days
- Crossed above SMA9 — 2 days above
- RSI at 47, rising
- MACD histogram improving
Returns
StockMktDiff
1D———
2D———
3D———
5D———
10D———
results pending next close
 click to enlarge
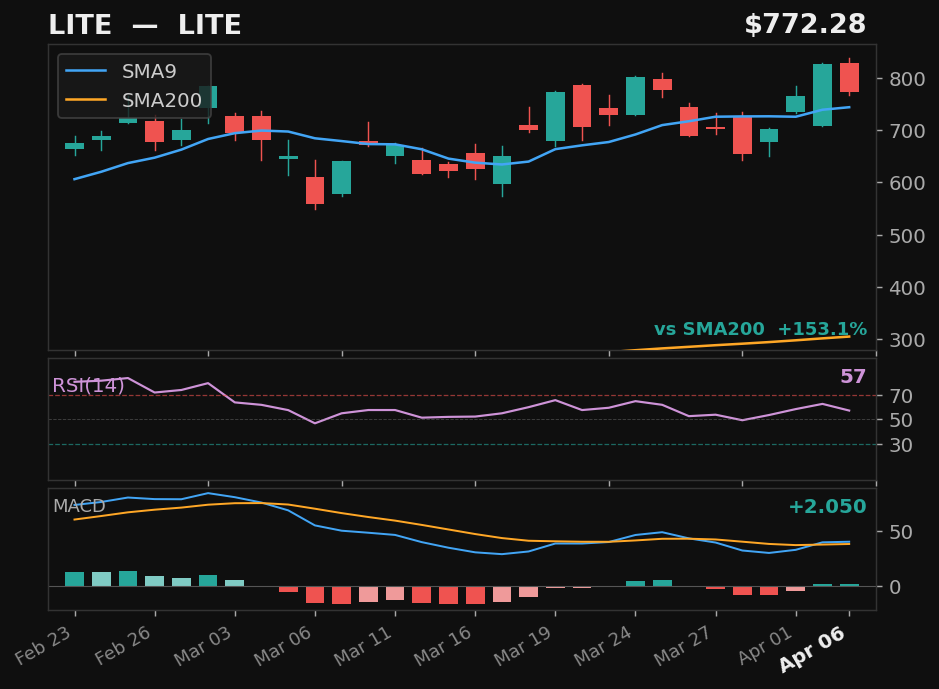
LITE
LITE
NASDAQ
- 15.7% pullback — full candle body above SMA9
- MACD bullish cross 1 day ago
- 153.1% above SMA200 — extended from trend
Returns
StockMktDiff
1D———
2D———
3D———
5D———
10D———
results pending next close
 click to enlarge
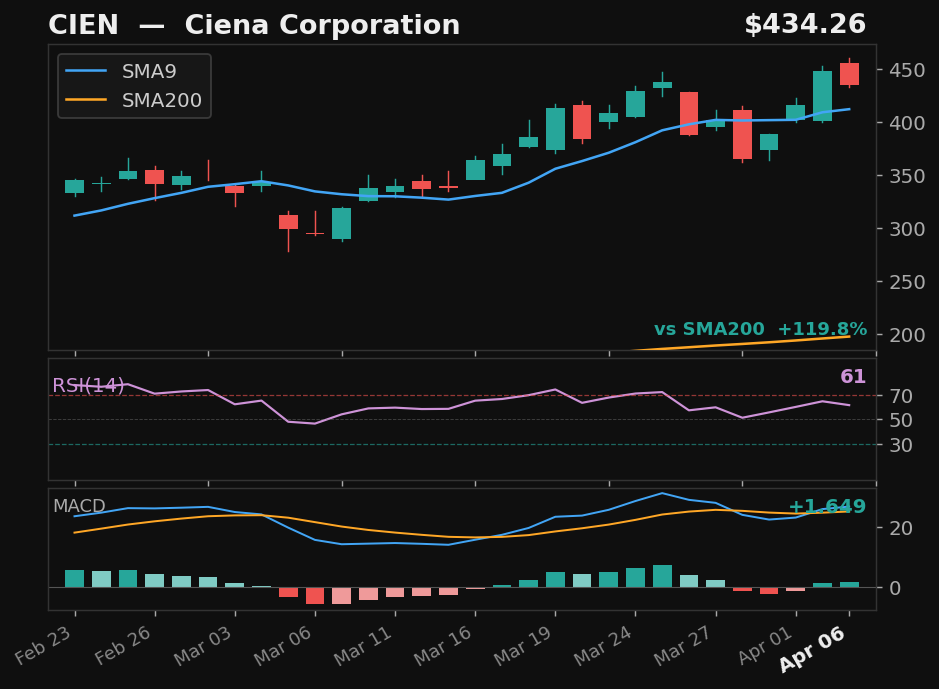
CIEN
Ciena Corporation
NYSE
- 16.6% pullback — full candle body above SMA9
- MACD bullish cross 1 day ago
- 119.8% above SMA200 — extended from trend
Returns
StockMktDiff
1D———
2D———
3D———
5D———
10D———
results pending next close
Explosive Up Setups
5
▼
 click to enlarge
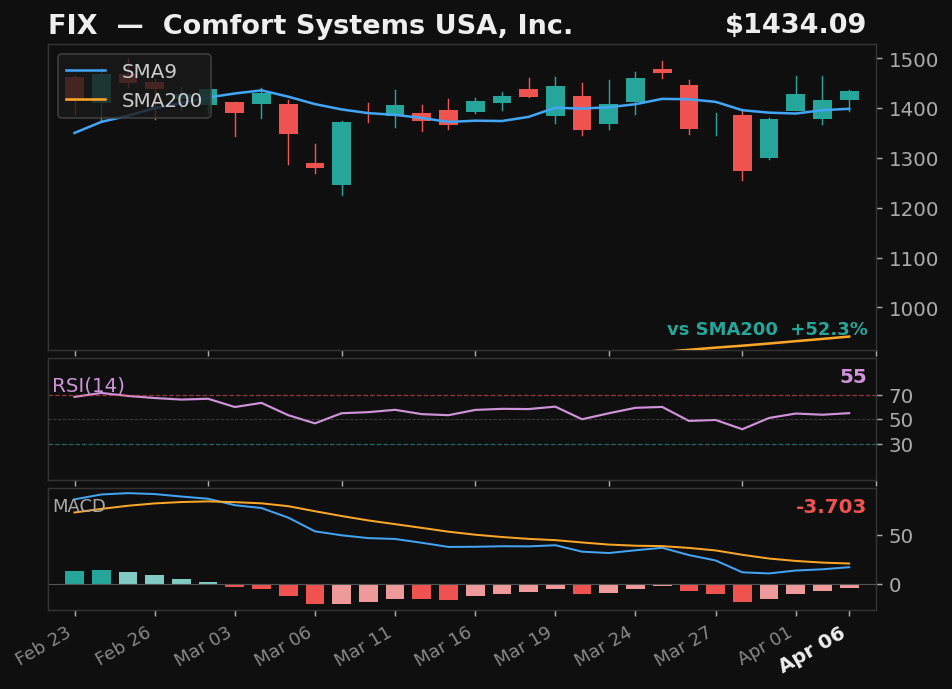
FIX
Comfort Systems USA, Inc.
NYSE
- 13.4% pullback — 4 days below SMA9
- Prior rally: 16%
- 52% above SMA200 — strong structural position
- MACD histogram rising from negative — early momentum signal
Exp Score105Days Below4Pullback%13.4
Returns
StockMktDiff
1D———
2D———
3D———
5D———
10D———
results pending next close
 click to enlarge
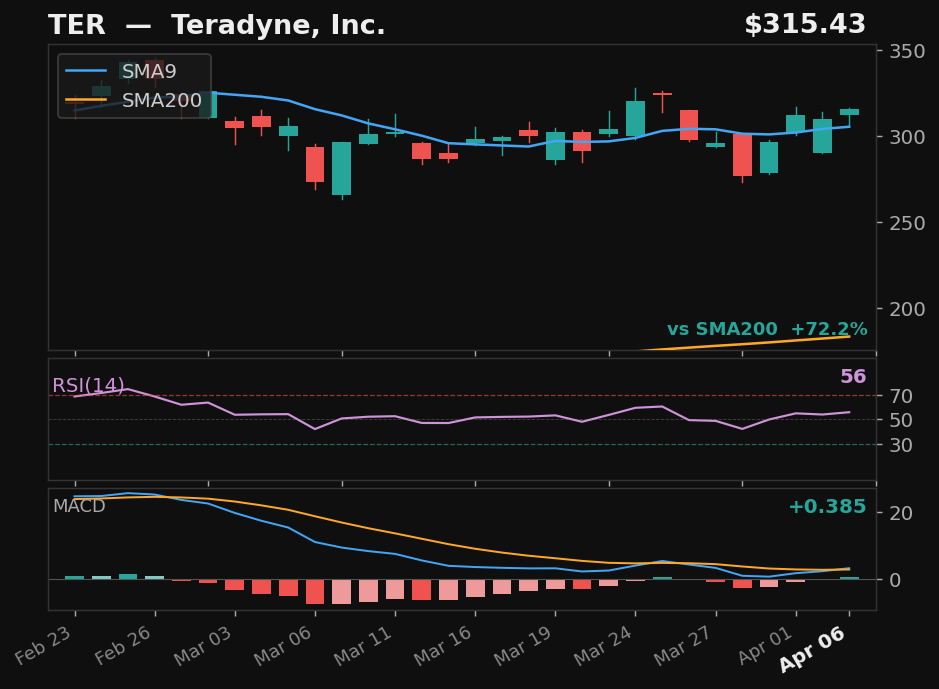
TER
Teradyne, Inc.
NASDAQ
- 14.5% pullback — 4 days below SMA9
- Prior rally: 17%
- 72% above SMA200 — strong structural position
- MACD momentum building
Exp Score103Days Below4Pullback%14.5
Returns
StockMktDiff
1D———
2D———
3D———
5D———
10D———
results pending next close
 click to enlarge
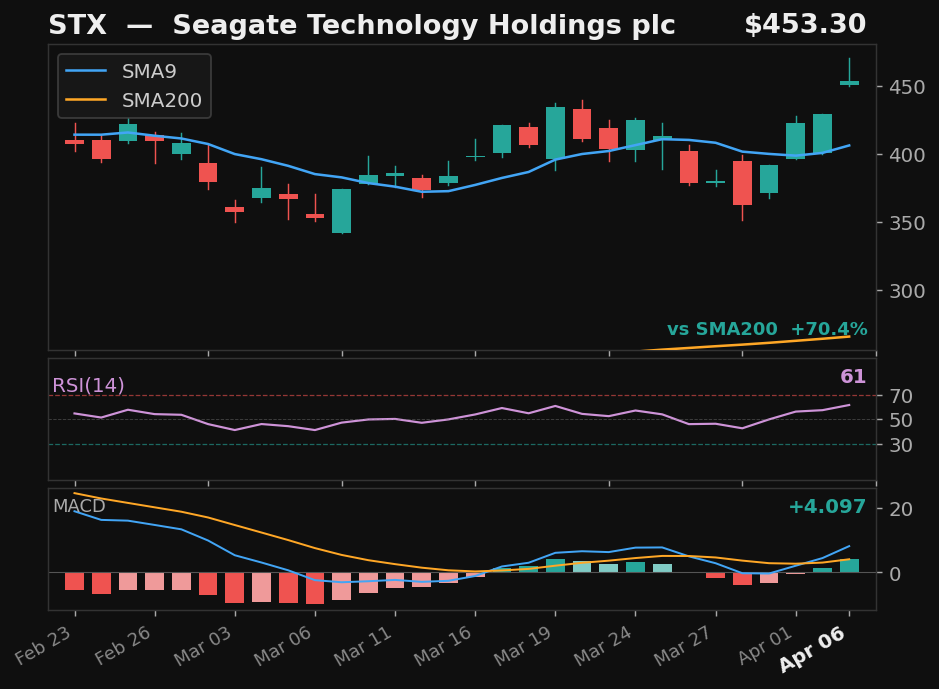
STX
Seagate Technology Holdings plc
NASDAQ
- 14.7% pullback — 4 days below SMA9
- Prior rally: 17%
- 70% above SMA200 — strong structural position
- MACD momentum building
Exp Score103Days Below4Pullback%14.7
Returns
StockMktDiff
1D———
2D———
3D———
5D———
10D———
results pending next close
click to enlarge
CIEN
Ciena Corporation
NYSE
- 16.6% pullback — 4 days below SMA9
- Prior rally: 20%
- 120% above SMA200 — strong structural position
- MACD momentum building
Exp Score101Days Below4Pullback%16.6
Returns
StockMktDiff
1D———
2D———
3D———
5D———
10D———
results pending next close
click to enlarge
LITE
LITE
NASDAQ
- 15.7% pullback — 4 days below SMA9
- Prior rally: 19%
- 153% above SMA200 — strong structural position
- MACD momentum building
Exp Score101Days Below4Pullback%15.7
Returns
StockMktDiff
1D———
2D———
3D———
5D———
10D———
results pending next close
Empirical V1
5
▼
 click to enlarge
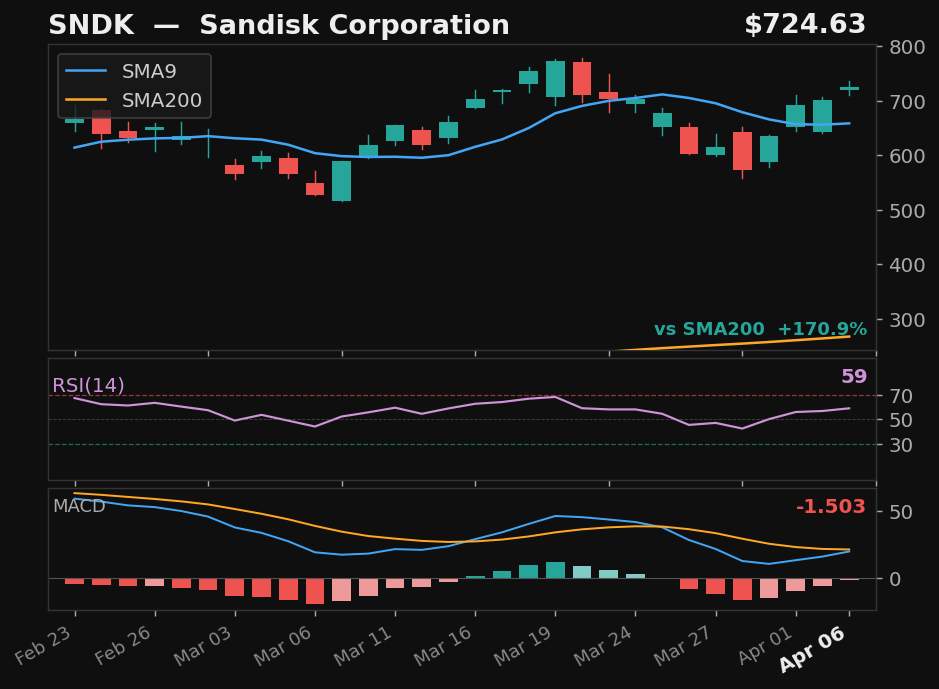
SNDK
Sandisk Corporation
NASDAQ
- 18.5% pullback — full candle body above SMA9
- RSI at 58 — confirmed recovery momentum
- 170.9% above SMA200 — extended from trend
Emp Score93.3Body Above✓
Returns
StockMktDiff
1D———
2D———
3D———
5D———
10D———
results pending next close
click to enlarge
LITE
LITE
NASDAQ
- 15.7% pullback — full candle body above SMA9
- MACD bullish cross 1 day ago
- 153.1% above SMA200 — extended from trend
Emp Score82.4Body Above✓
Returns
StockMktDiff
1D———
2D———
3D———
5D———
10D———
results pending next close
click to enlarge
MU
Micron Technology, Inc.
NASDAQ
- 30.3% pullback — full candle body above SMA9
- RSI rising from 47
- MACD histogram rising while still negative — early recovery signal
- 54.6% above SMA200 — extended from trend
Emp Score80.0Body Above✓
Returns
StockMktDiff
1D———
2D———
3D———
5D———
10D———
results pending next close
click to enlarge
CIEN
Ciena Corporation
NYSE
- 16.6% pullback — full candle body above SMA9
- MACD bullish cross 1 day ago
- 119.8% above SMA200 — extended from trend
Emp Score74.2Body Above✓
Returns
StockMktDiff
1D———
2D———
3D———
5D———
10D———
results pending next close
 click to enlarge
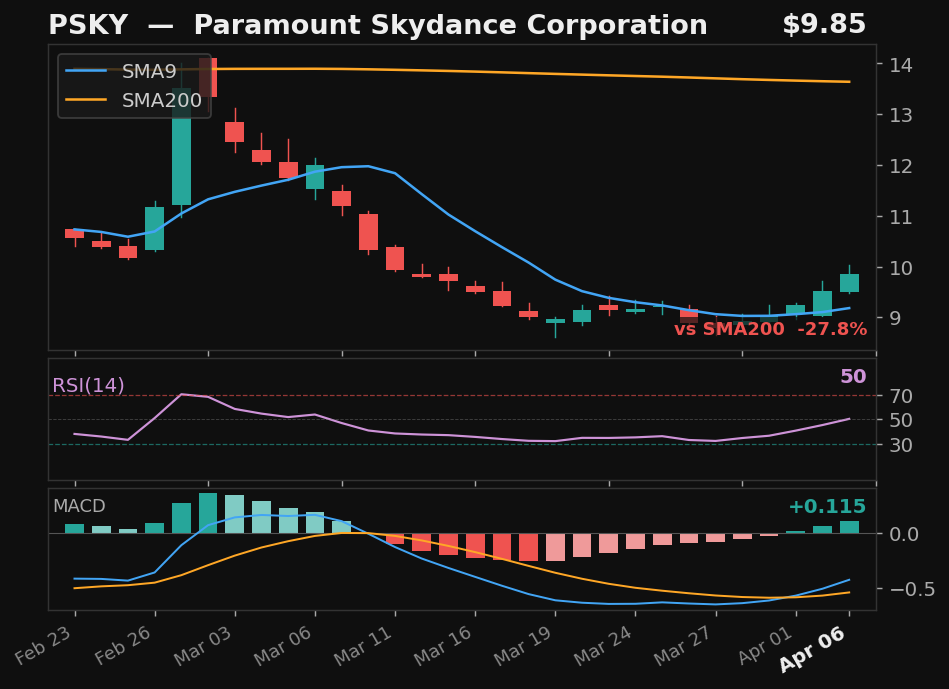
PSKY
Paramount Skydance Corporation
NASDAQ
- 26.7% pullback — full candle body above SMA9
- RSI at 50, rising above 50
- MACD bullish cross 2 days ago
- 27.8% below SMA200 — extended from trend
Emp Score64.7Body Above✓
Returns
StockMktDiff
1D———
2D———
3D———
5D———
10D———
results pending next close
SwingTrader Setups
10
▼
 click to enlarge
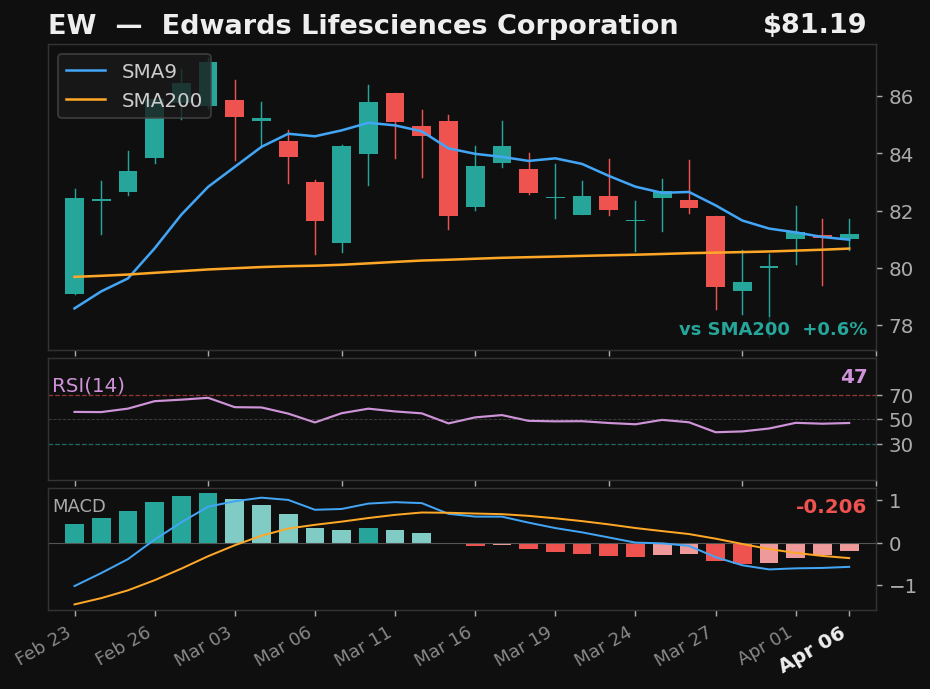
EW
Edwards Lifesciences Corporation
NYSE
- 6.8% pullback to SMA9 over 13 days
- Crossed back above SMA9 today
- RSI at 46, rising
- MACD histogram improving
Base✓Strict✓Score83.0
Returns
StockMktDiff
1D———
2D———
3D———
5D———
10D———
results pending next close
 click to enlarge
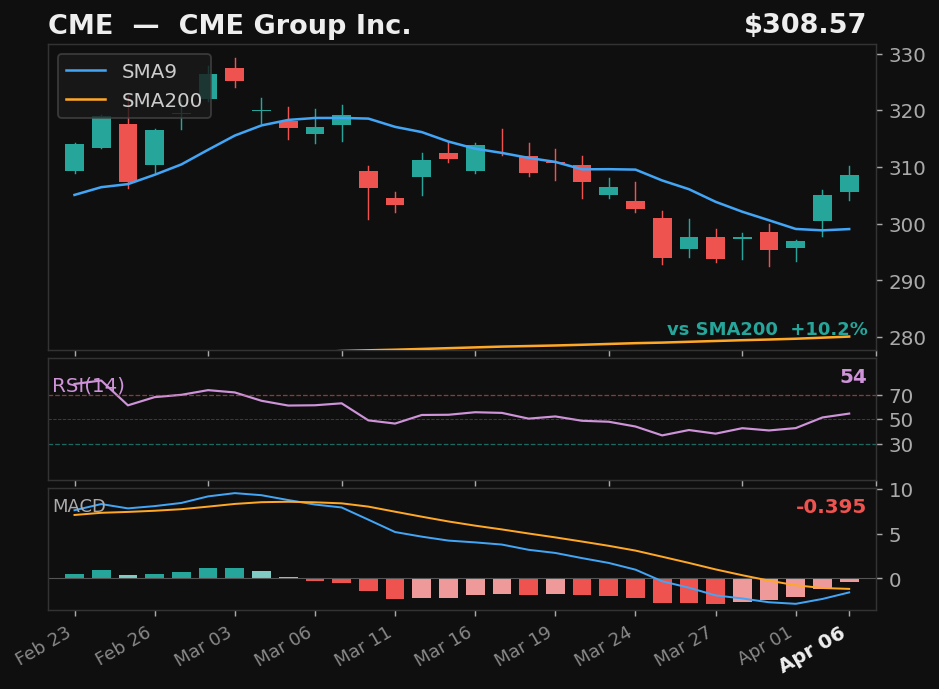
CME
CME Group Inc.
NASDAQ
- 6.2% pullback to SMA9 over 11 days
- Crossed above SMA9 — 2 days above
- RSI at 55, rising
- MACD histogram improving
Base✓Strict✓Score78.0
Returns
StockMktDiff
1D———
2D———
3D———
5D———
10D———
results pending next close
 click to enlarge
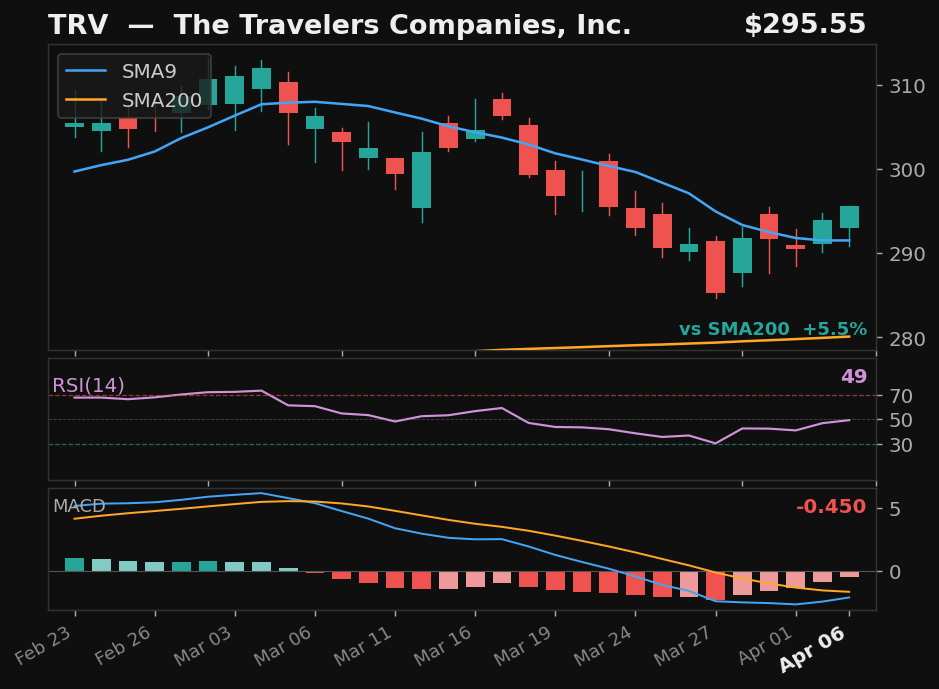
TRV
The Travelers Companies, Inc.
NYSE
- 6.9% pullback to SMA9 over 11 days
- Crossed above SMA9 — 2 days above
- RSI at 50, rising
- MACD histogram improving
Base✓Strict✓Score77.0
Returns
StockMktDiff
1D———
2D———
3D———
5D———
10D———
results pending next close
click to enlarge
MU
Micron Technology, Inc.
NASDAQ
- 30.3% pullback to SMA9 over 9 days
- Crossed above SMA9 — 2 days above
- RSI at 47, rising
- MACD histogram improving
Base✓Strict✓Score68.0
Returns
StockMktDiff
1D———
2D———
3D———
5D———
10D———
results pending next close
 click to enlarge
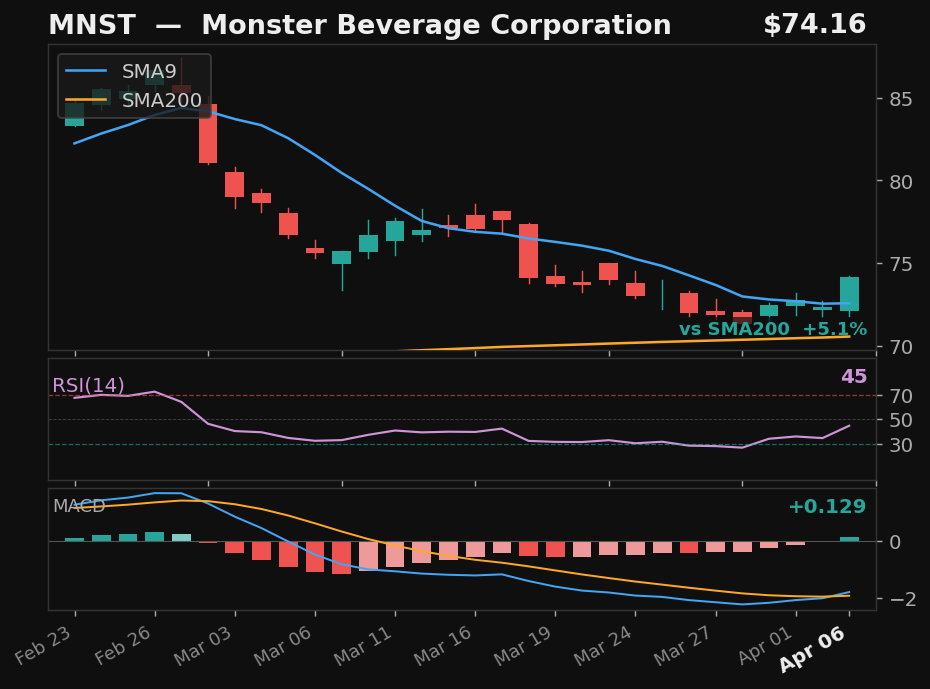
MNST
Monster Beverage Corporation
NASDAQ
- 8.1% pullback to SMA9 over 11 days
- Crossed back above SMA9 today
- RSI rising from 44 — recovering momentum
- MACD histogram improving
Base✓Strict✗Score73.0
Returns
StockMktDiff
1D———
2D———
3D———
5D———
10D———
results pending next close
 click to enlarge
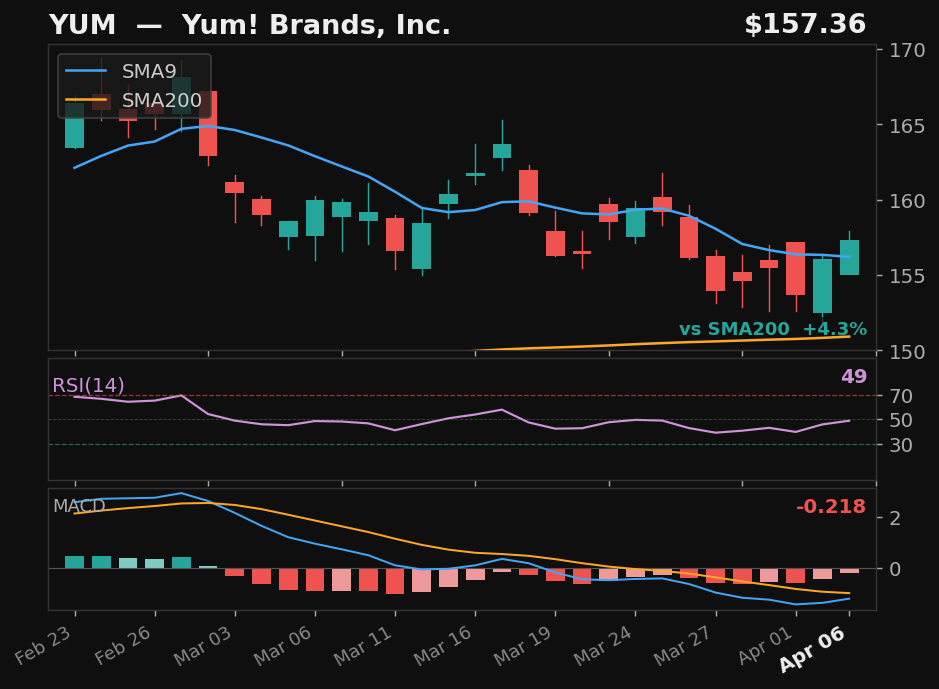
YUM
Yum! Brands, Inc.
NYSE
- 6.1% pullback to SMA9 over 11 days
- Crossed back above SMA9 today
- RSI at 49, rising
- MACD histogram improving
Base✓Strict✗Score66.0
Returns
StockMktDiff
1D———
2D———
3D———
5D———
10D———
results pending next close
 click to enlarge
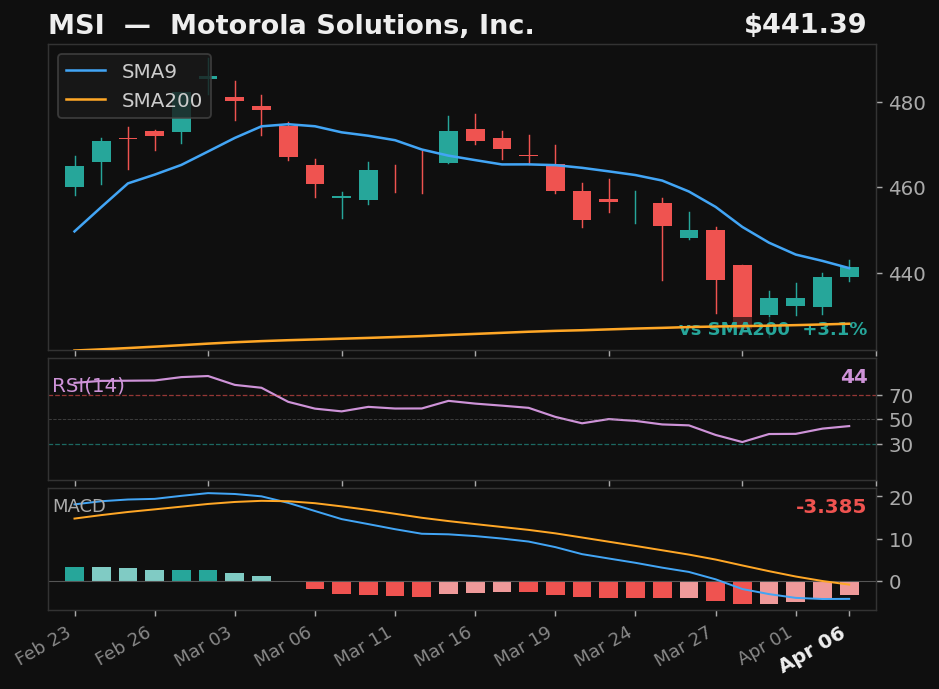
MSI
Motorola Solutions, Inc.
NYSE
- 8.7% pullback to SMA9 over 11 days
- Crossed back above SMA9 today
- RSI rising from 44 — recovering momentum
- MACD histogram improving
Base✓Strict✗Score62.0
Returns
StockMktDiff
1D———
2D———
3D———
5D———
10D———
results pending next close
 click to enlarge
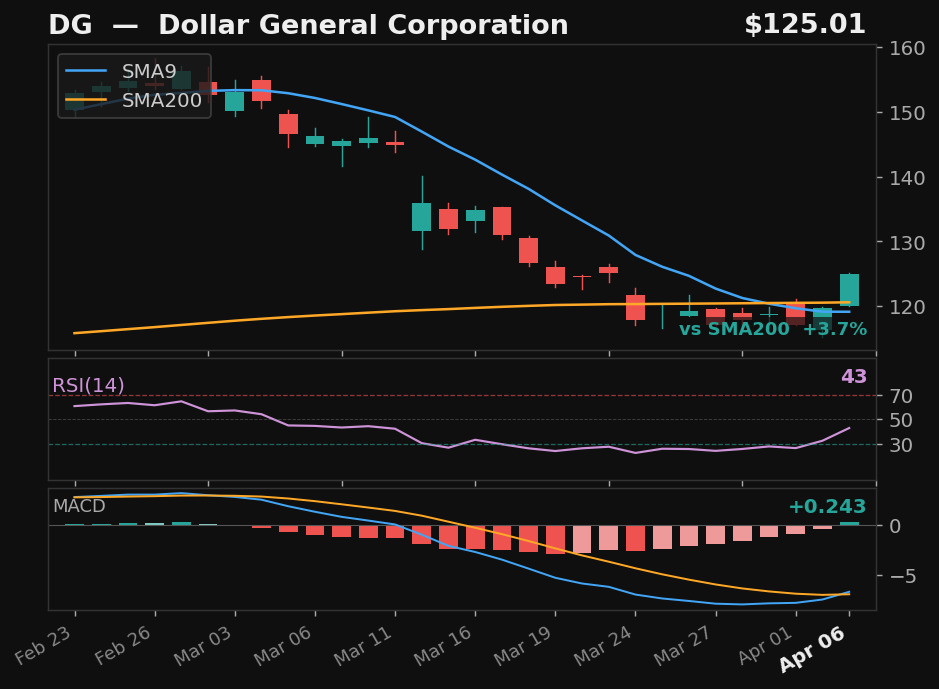
DG
Dollar General Corporation
NYSE
- 25.0% pullback to SMA9 over 23 days
- Crossed above SMA9 — 2 days above
- RSI rising from 43 — recovering momentum
- MACD histogram improving
Base✓Strict✗Score59.0
Returns
StockMktDiff
1D———
2D———
3D———
5D———
10D———
results pending next close
 click to enlarge
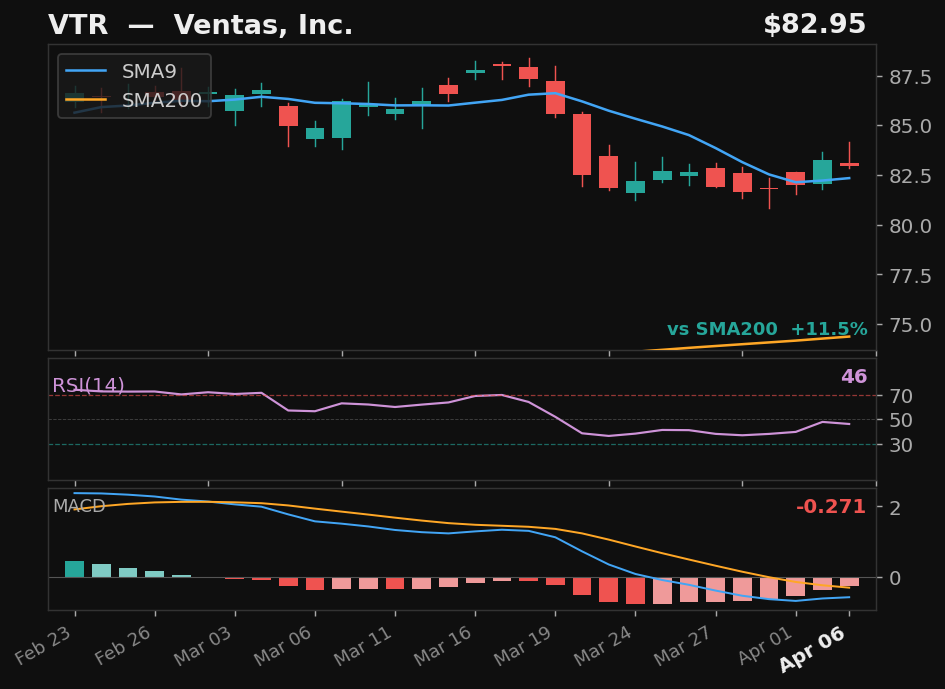
VTR
Ventas, Inc.
NYSE
- 6.5% pullback to SMA9 over 10 days
- Crossed above SMA9 — 2 days above
- MACD histogram improving
- Long-term uptrend intact
Base✓Strict✗Score56.0
Returns
StockMktDiff
1D———
2D———
3D———
5D———
10D———
results pending next close
 click to enlarge
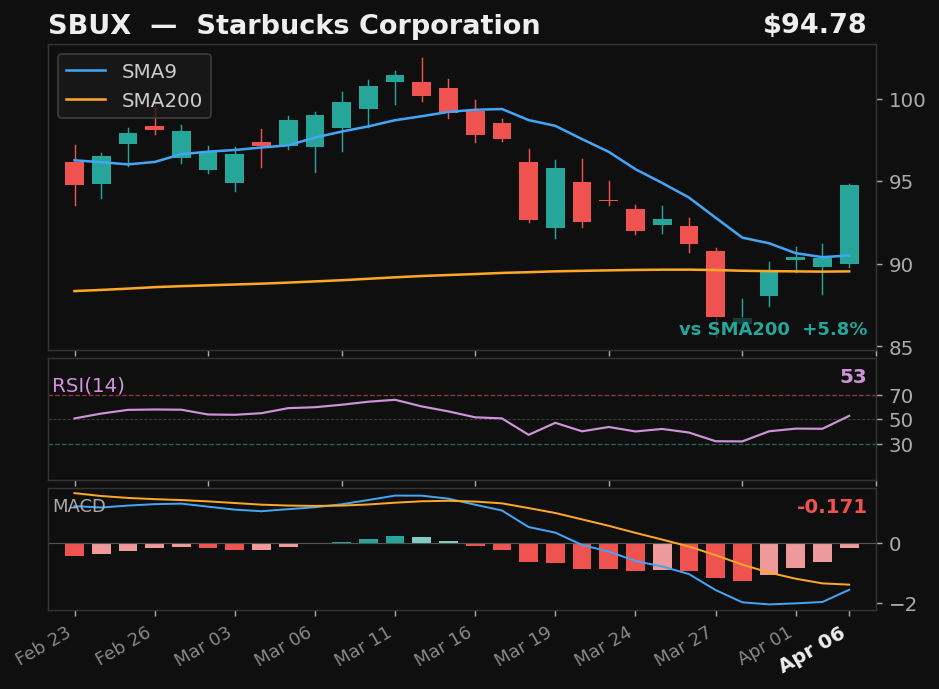
SBUX
Starbucks Corporation
NASDAQ
- 13.4% pullback to SMA9 over 15 days
- Crossed back above SMA9 today
- RSI at 52, rising
- MACD histogram improving
Base✓Strict✗Score54.0
Returns
StockMktDiff
1D———
2D———
3D———
5D———
10D———
results pending next close