Tuesday, April 7, 2026 · After Close
★ Highlights
1
▼
 click to enlarge
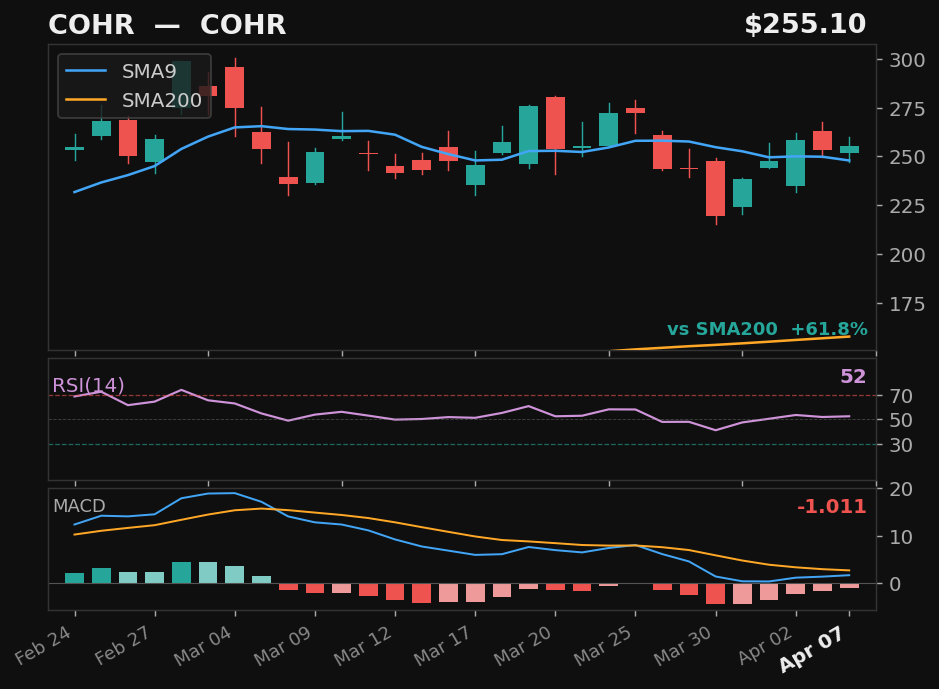
COHR
COHR
NYSE
- 19.3% pullback — full candle body above SMA9
- RSI at 52, rising above 50
- MACD histogram rising while still negative — early recovery signal
- 61.8% above SMA200 — extended from trend
Returns
StockMktDiff
1D———
2D———
3D———
5D———
10D———
results pending next close
Explosive Up Setups
3
▼
click to enlarge
COHR
COHR
NYSE
- 19.3% pullback — 5 days below SMA9
- Prior rally: 24% — strong trend to recover into
- 62% above SMA200 — strong structural position
- MACD histogram rising from negative — early momentum signal
Exp Score97Days Below5Pullback%19.3
Returns
StockMktDiff
1D———
2D———
3D———
5D———
10D———
results pending next close
 click to enlarge
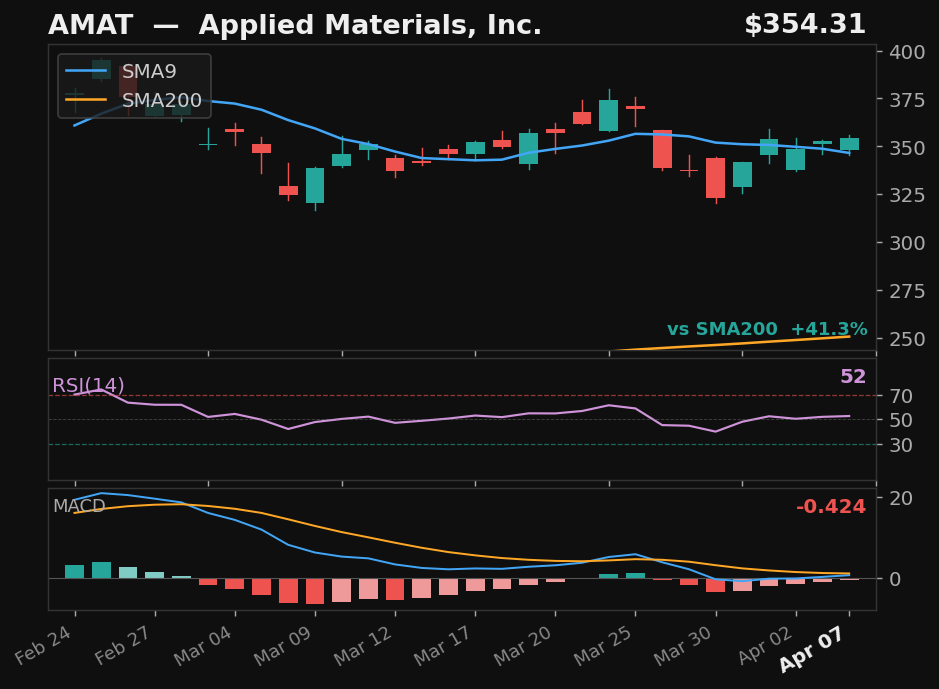
AMAT
Applied Materials, Inc.
NASDAQ
- 12.5% pullback — 5 days below SMA9
- Prior rally: 14%
- 41% above SMA200 — strong structural position
- MACD histogram rising from negative — early momentum signal
Exp Score89Days Below5Pullback%12.5
Returns
StockMktDiff
1D———
2D———
3D———
5D———
10D———
results pending next close
 click to enlarge
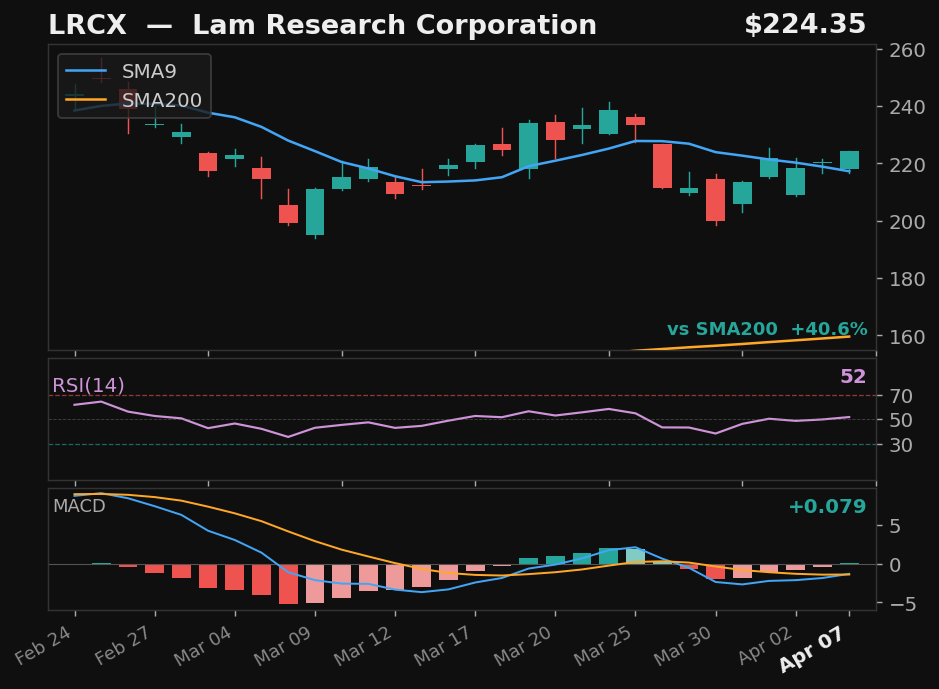
LRCX
Lam Research Corporation
NASDAQ
- 14.4% pullback — 5 days below SMA9
- Prior rally: 17%
- 41% above SMA200 — strong structural position
- MACD momentum building
Exp Score87Days Below5Pullback%14.4
Returns
StockMktDiff
1D———
2D———
3D———
5D———
10D———
results pending next close
Empirical V1
5
▼
 click to enlarge
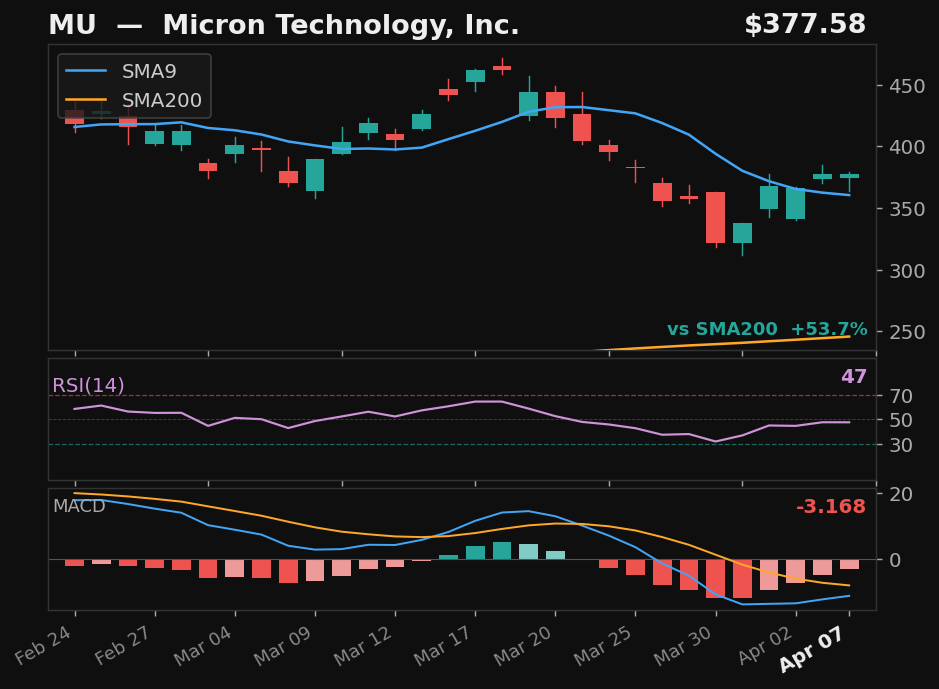
MU
Micron Technology, Inc.
NASDAQ
- 30.3% pullback — full candle body above SMA9
- MACD histogram rising while still negative — early recovery signal
- 53.7% above SMA200 — extended from trend
Emp Score79.7Body Above✓
Returns
StockMktDiff
1D———
2D———
3D———
5D———
10D———
results pending next close
click to enlarge
COHR
COHR
NYSE
- 19.3% pullback — full candle body above SMA9
- RSI at 52, rising above 50
- MACD histogram rising while still negative — early recovery signal
- 61.8% above SMA200 — extended from trend
Emp Score63.1Body Above✓
Returns
StockMktDiff
1D———
2D———
3D———
5D———
10D———
results pending next close
 click to enlarge
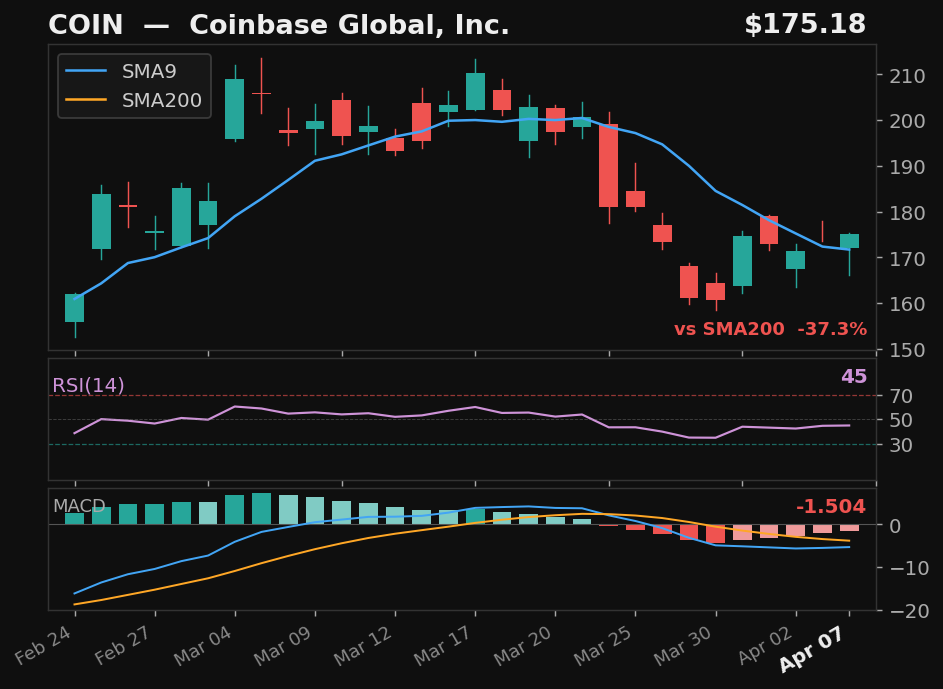
COIN
Coinbase Global, Inc.
NASDAQ
- 20.8% pullback — full candle body above SMA9
- RSI rising from 44
- MACD histogram rising while still negative — early recovery signal
- 37.3% below SMA200 — extended from trend
Emp Score55.7Body Above✓
Returns
StockMktDiff
1D———
2D———
3D———
5D———
10D———
results pending next close
 click to enlarge
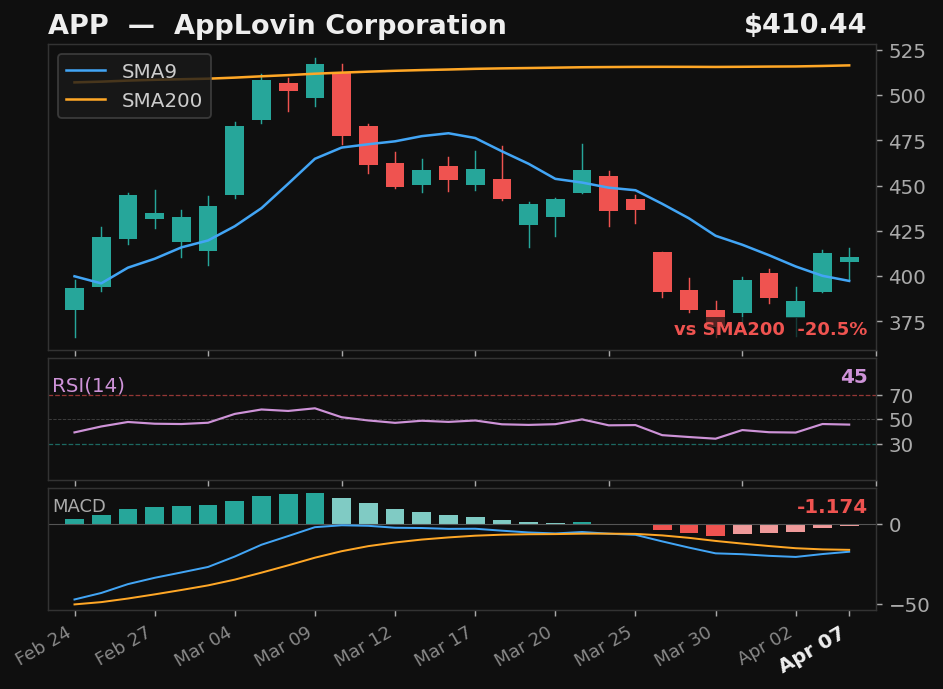
APP
AppLovin Corporation
NASDAQ
- 22.1% pullback — full candle body above SMA9
- MACD histogram rising while still negative — early recovery signal
- 20.5% below SMA200 — extended from trend
Emp Score53.3Body Above✓
Returns
StockMktDiff
1D———
2D———
3D———
5D———
10D———
results pending next close
 click to enlarge
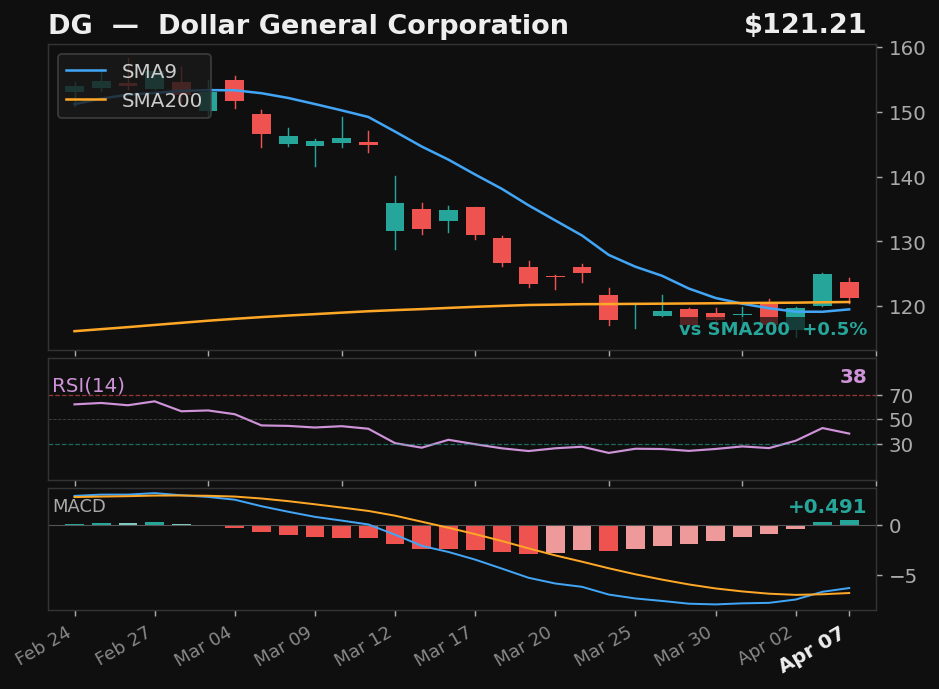
DG
Dollar General Corporation
NYSE
- 25.0% pullback — full candle body above SMA9
- MACD bullish cross 1 day ago
Emp Score50.2Body Above✓
Returns
StockMktDiff
1D———
2D———
3D———
5D———
10D———
results pending next close
SwingTrader Setups
4
▼
 click to enlarge
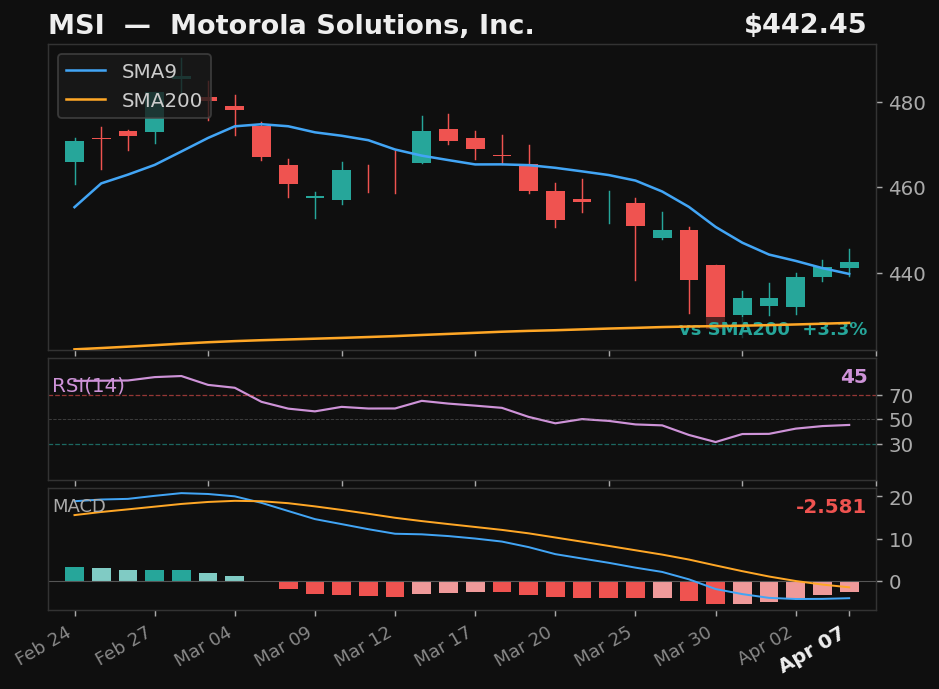
MSI
Motorola Solutions, Inc.
NYSE
- 8.7% pullback to SMA9 over 11 days
- Crossed above SMA9 — 2 days above
- RSI at 45, rising
- MACD histogram improving
Base✓Strict✓Score76.0
Returns
StockMktDiff
1D———
2D———
3D———
5D———
10D———
results pending next close
 click to enlarge
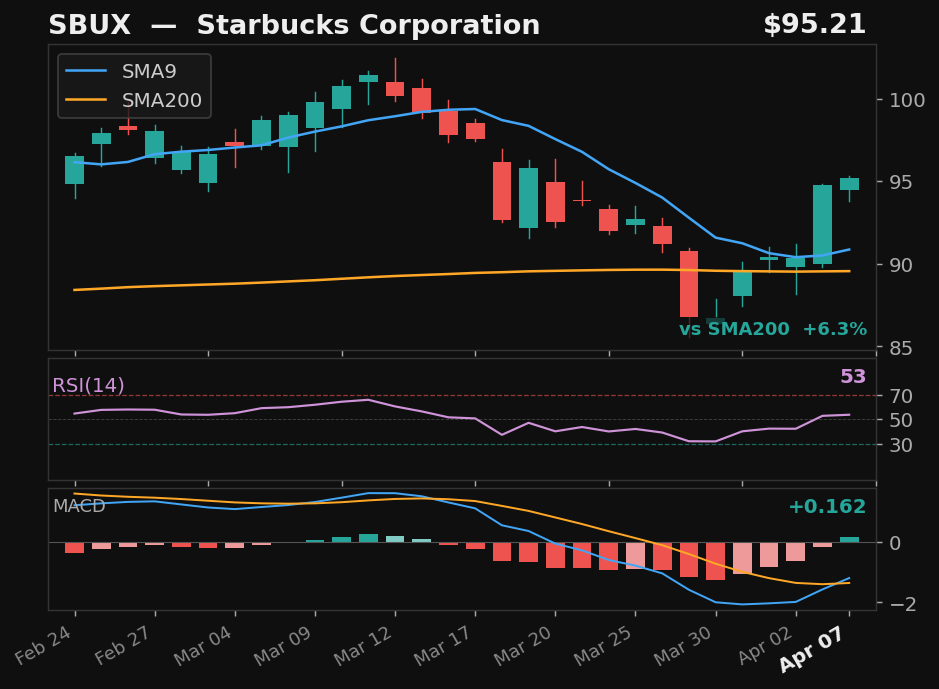
SBUX
Starbucks Corporation
NASDAQ
- 13.4% pullback to SMA9 over 15 days
- Crossed above SMA9 — 2 days above
- RSI at 53, rising
- MACD histogram improving
Base✓Strict✓Score75.0
Returns
StockMktDiff
1D———
2D———
3D———
5D———
10D———
results pending next close
 click to enlarge
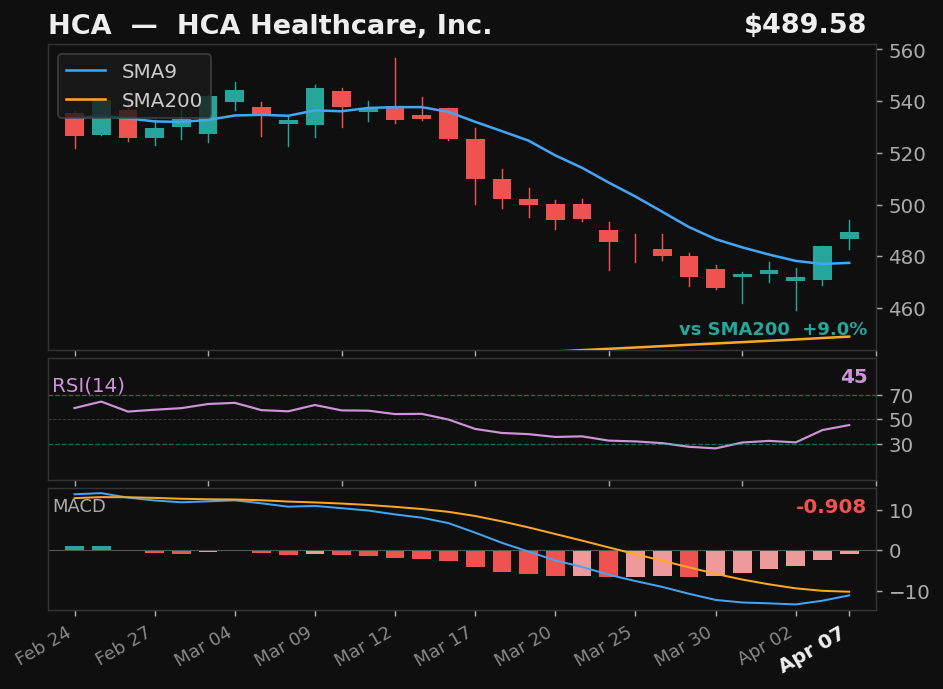
HCA
HCA Healthcare, Inc.
NYSE
- 13.0% pullback to SMA9 over 17 days
- Crossed above SMA9 — 2 days above
- RSI at 46, rising
- MACD histogram improving
Base✓Strict✓Score70.0
Returns
StockMktDiff
1D———
2D———
3D———
5D———
10D———
results pending next close
 click to enlarge
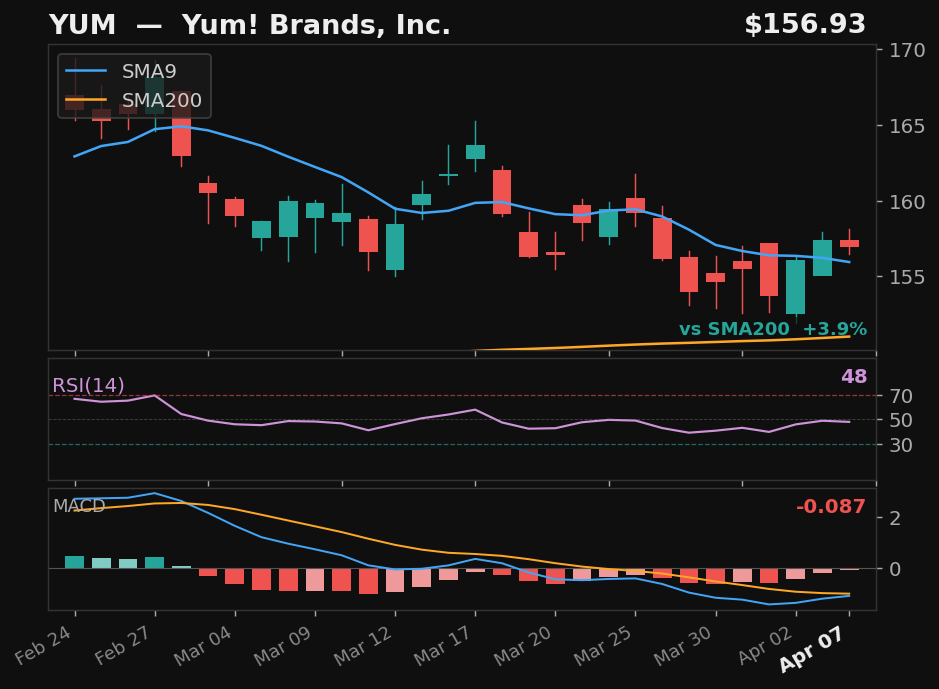
YUM
Yum! Brands, Inc.
NYSE
- 6.1% pullback to SMA9 over 11 days
- Crossed above SMA9 — 2 days above
- MACD histogram improving
Base✓Strict✗Score56.0
Returns
StockMktDiff
1D———
2D———
3D———
5D———
10D———
results pending next close