Wednesday, April 8, 2026 · After Close
★ Highlights
1
▼
 click to enlarge
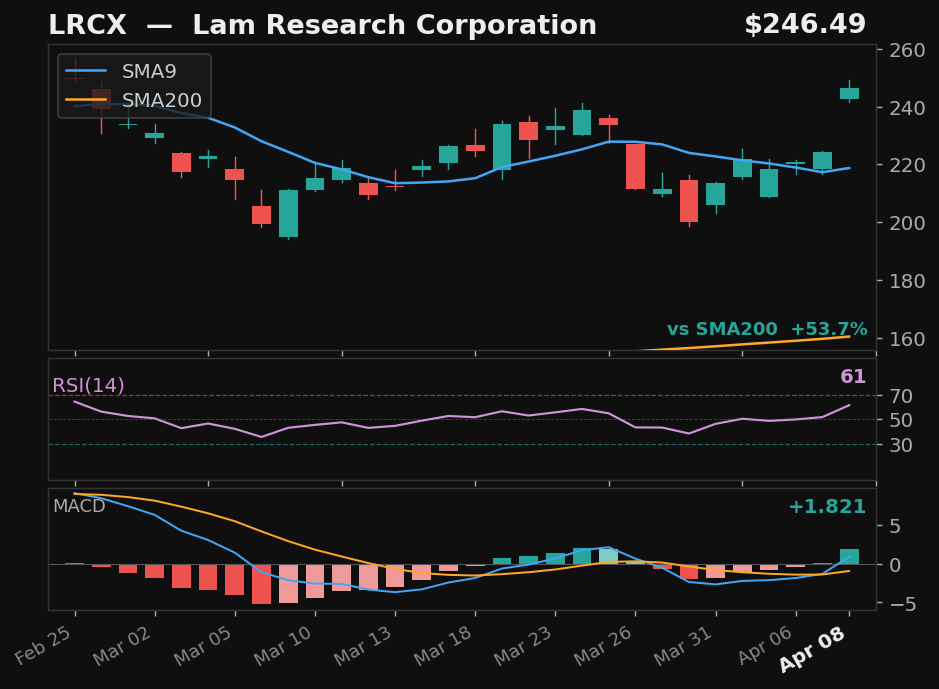
LRCX
Lam Research Corporation
NASDAQ
- 14.4% pullback — full candle body above SMA9
- RSI at 61 — confirmed recovery momentum
- MACD bullish cross 1 day ago
- 53.7% above SMA200 — extended from trend
Returns
StockMktDiff
1D———
2D———
3D———
5D———
10D———
results pending next close
Explosive Up Setups
3
▼
click to enlarge
LRCX
Lam Research Corporation
NASDAQ
- 14.4% pullback — 5 days below SMA9
- Prior rally: 17%
- 54% above SMA200 — strong structural position
- MACD momentum building
Exp Score95Days Below5Pullback%14.4
Returns
StockMktDiff
1D———
2D———
3D———
5D———
10D———
results pending next close
 click to enlarge
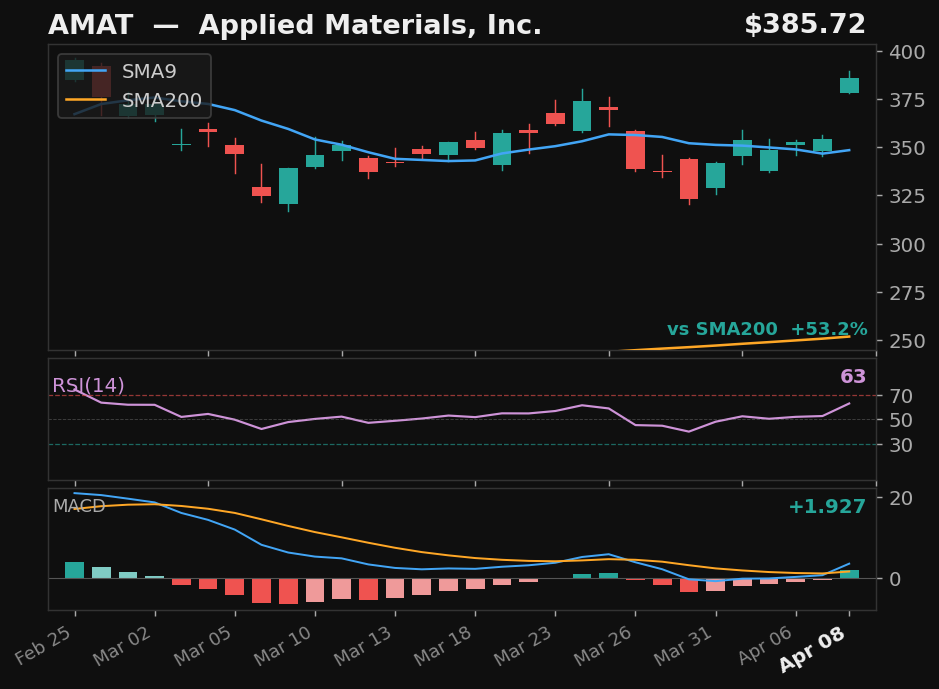
AMAT
Applied Materials, Inc.
NASDAQ
- 12.5% pullback — 5 days below SMA9
- Prior rally: 14%
- 53% above SMA200 — strong structural position
- MACD momentum building
Exp Score92Days Below5Pullback%12.5
Returns
StockMktDiff
1D———
2D———
3D———
5D———
10D———
results pending next close
 click to enlarge
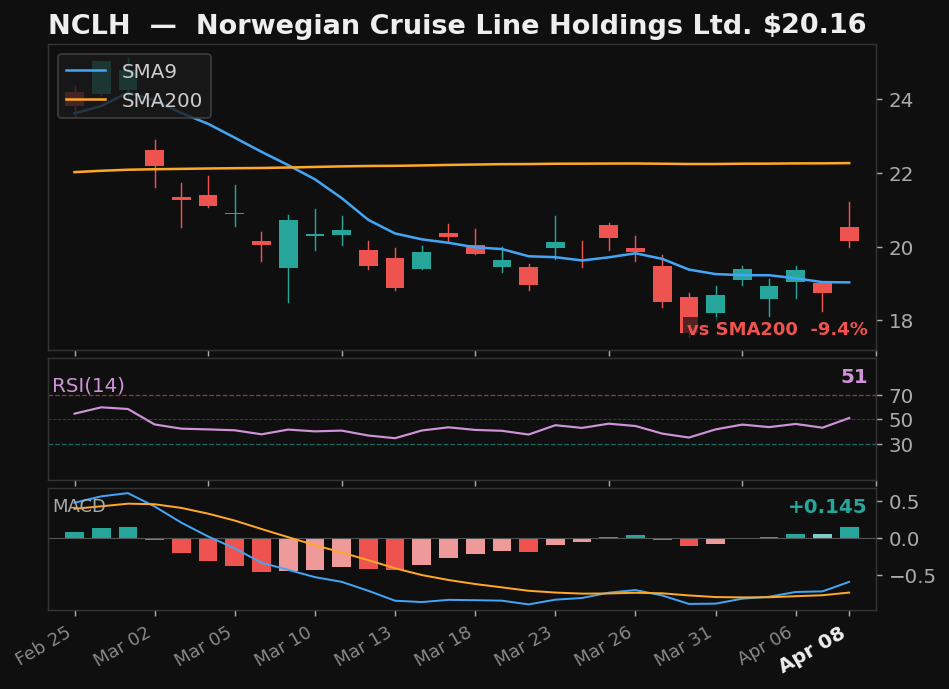
NCLH
Norwegian Cruise Line Holdings Ltd.
NYSE
- 11.1% pullback — 5 days below SMA9
- Prior rally: 12%
- MACD momentum building
Exp Score41Days Below5Pullback%11.1
Returns
StockMktDiff
1D———
2D———
3D———
5D———
10D———
results pending next close
Empirical V1
5
▼
 click to enlarge
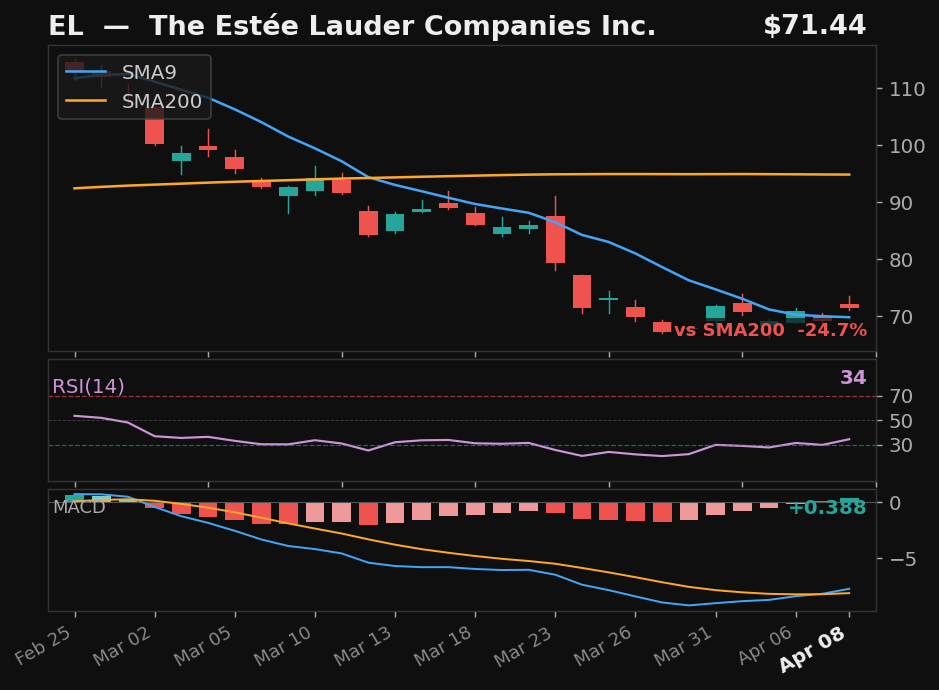
EL
The Estée Lauder Companies Inc.
NYSE
- 40.5% pullback — full candle body above SMA9
- RSI rising from 34
- MACD bullish cross 1 day ago
- 24.7% below SMA200 — extended from trend
Emp Score88.3Body Above✓
Returns
StockMktDiff
1D———
2D———
3D———
5D———
10D———
results pending next close
 click to enlarge
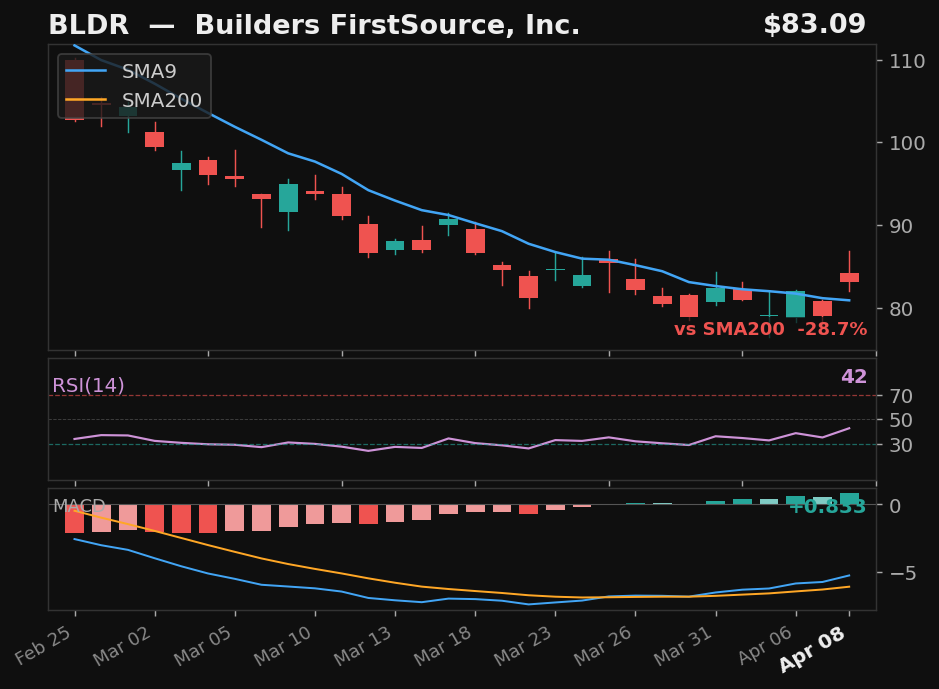
BLDR
Builders FirstSource, Inc.
NYSE
- 37.9% pullback — full candle body above SMA9
- RSI rising from 42
- 28.7% below SMA200 — extended from trend
Emp Score84.4Body Above✓
Returns
StockMktDiff
1D———
2D———
3D———
5D———
10D———
results pending next close
 click to enlarge
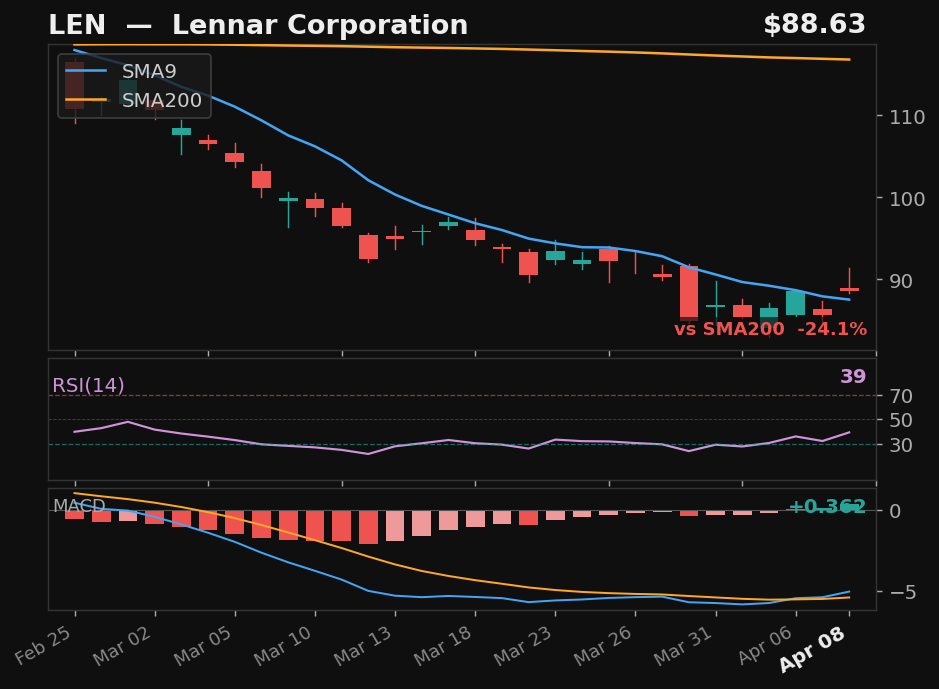
LEN
Lennar Corporation
NYSE
- 30.0% pullback over 33 days — full candle above SMA9
- RSI rising from 39
- MACD bullish cross 2 days ago
- 24.1% below SMA200 — extended from trend
Emp Score67.2Body Above✓
Returns
StockMktDiff
1D———
2D———
3D———
5D———
10D———
results pending next close
 click to enlarge
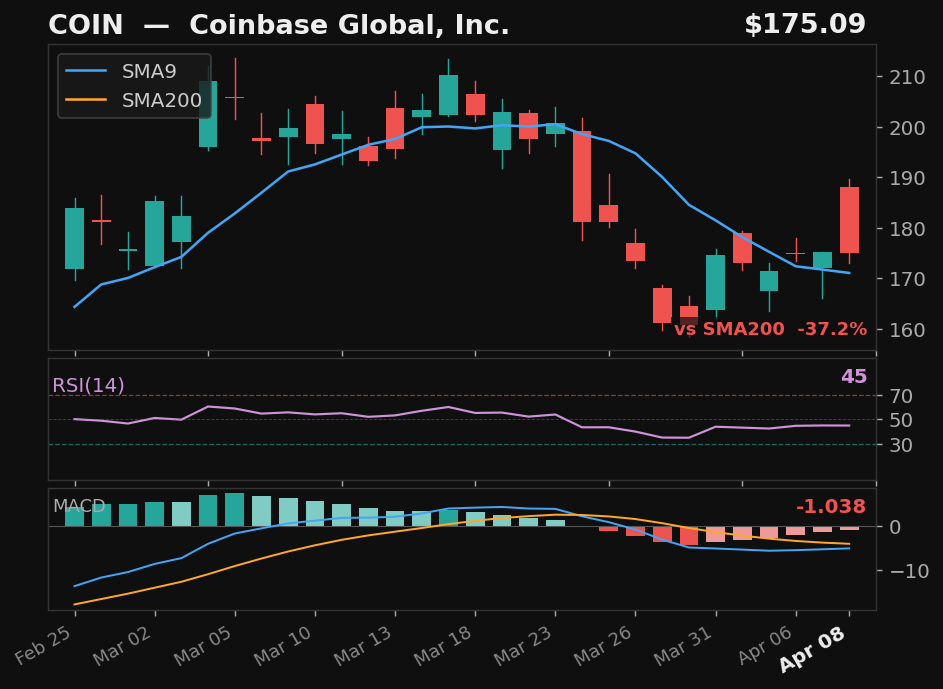
COIN
Coinbase Global, Inc.
NASDAQ
- 20.8% pullback — full candle body above SMA9
- MACD histogram rising while still negative — early recovery signal
- 37.2% below SMA200 — extended from trend
Emp Score55.7Body Above✓
Returns
StockMktDiff
1D———
2D———
3D———
5D———
10D———
results pending next close
click to enlarge
LRCX
Lam Research Corporation
NASDAQ
- 14.4% pullback — full candle body above SMA9
- RSI at 61 — confirmed recovery momentum
- MACD bullish cross 1 day ago
- 53.7% above SMA200 — extended from trend
Emp Score49.8Body Above✓
Returns
StockMktDiff
1D———
2D———
3D———
5D———
10D———
results pending next close
SwingTrader Setups
10
▼
 click to enlarge
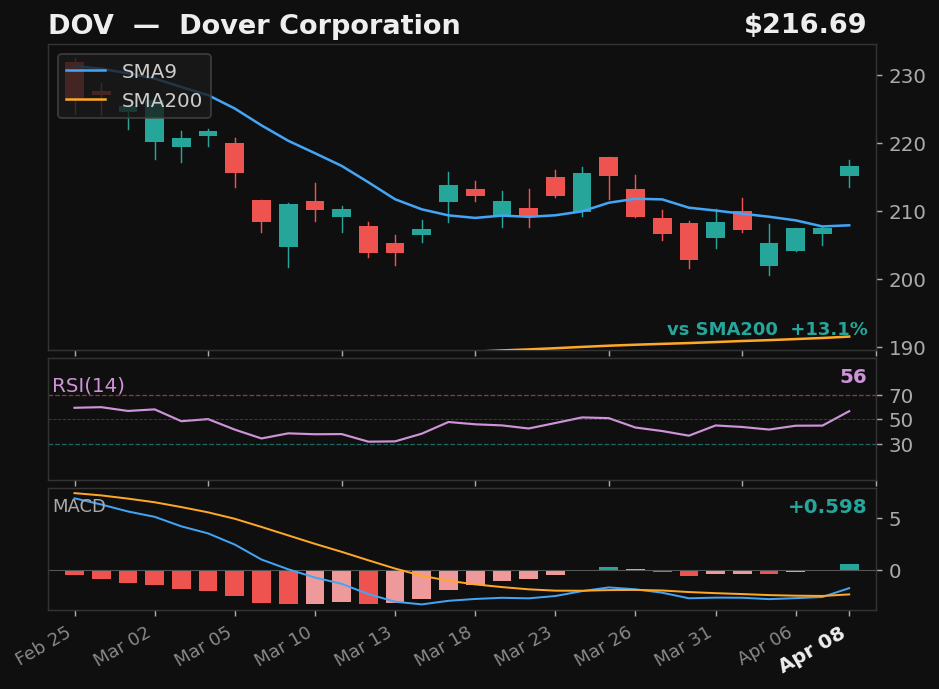
DOV
Dover Corporation
NYSE
- 5.7% pullback to SMA9 over 8 days
- Crossed back above SMA9 today
- RSI at 57, rising
- MACD histogram improving
Base✓Strict✓Score92.0
Returns
StockMktDiff
1D———
2D———
3D———
5D———
10D———
results pending next close
 click to enlarge
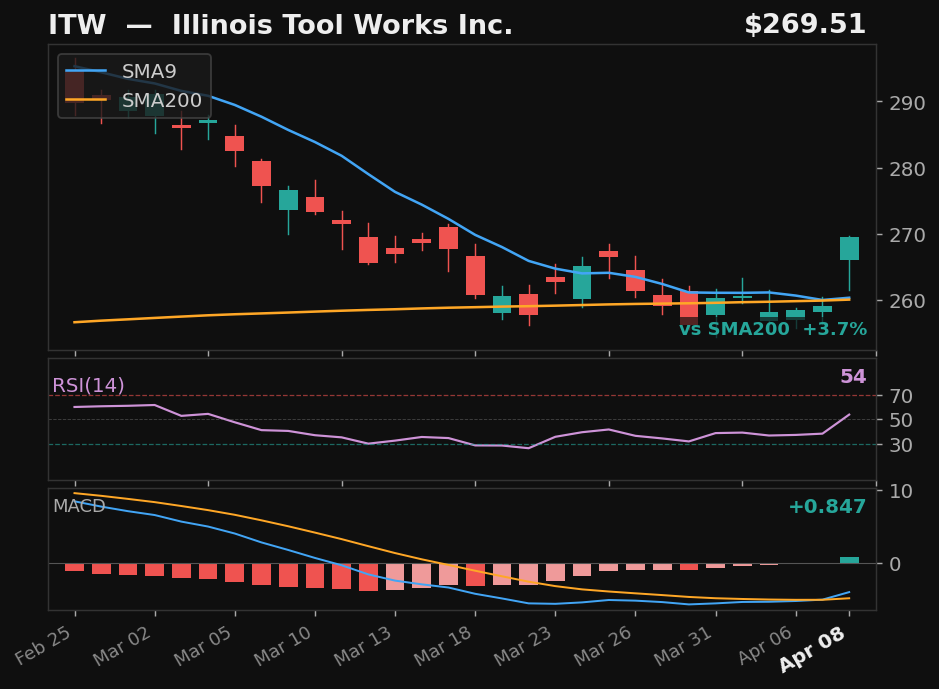
ITW
Illinois Tool Works Inc.
NYSE
- 3.9% pullback to SMA9 over 8 days
- Crossed back above SMA9 today
- RSI at 55, rising
- MACD bullish cross 1 day ago
Base✓Strict✓Score92.0
Returns
StockMktDiff
1D———
2D———
3D———
5D———
10D———
results pending next close
 click to enlarge
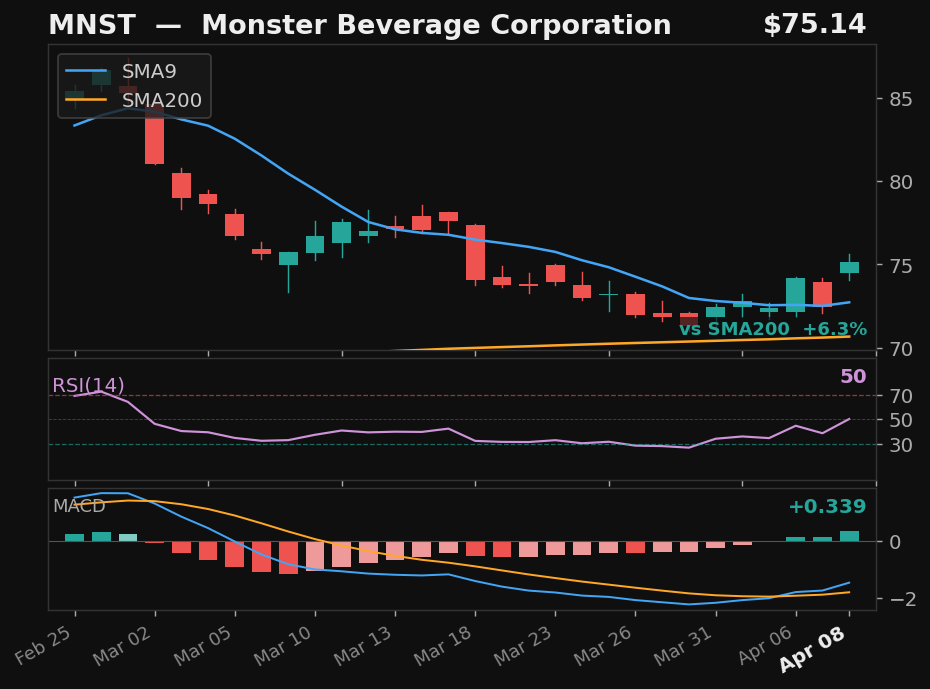
MNST
Monster Beverage Corporation
NASDAQ
- 8.1% pullback to SMA9 over 12 days
- Crossed back above SMA9 today
- RSI at 50, rising
- MACD bullish cross 2 days ago
Base✓Strict✓Score88.0
Returns
StockMktDiff
1D———
2D———
3D———
5D———
10D———
results pending next close
 click to enlarge
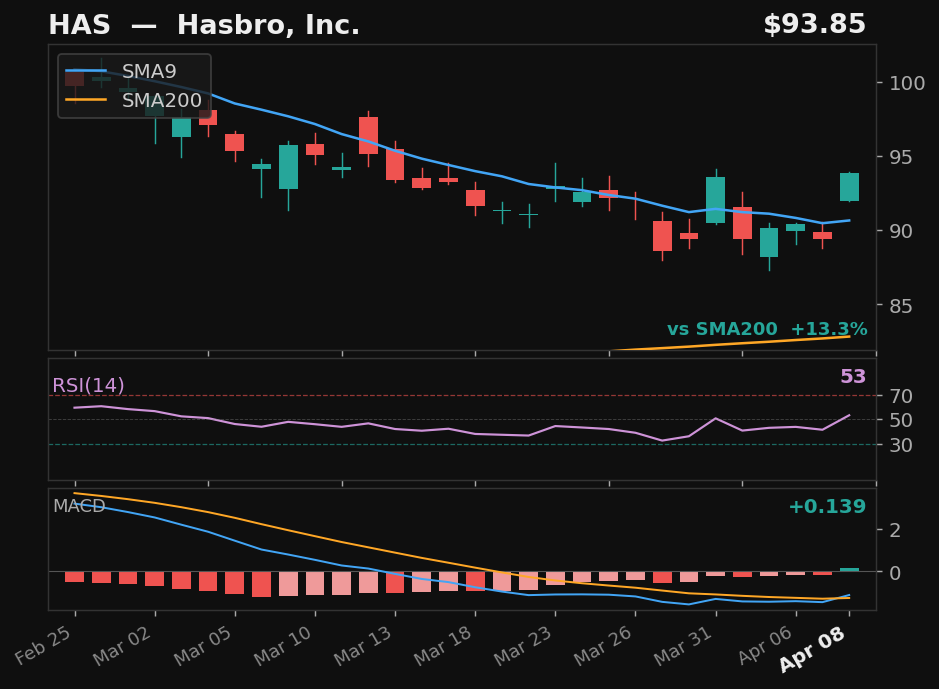
HAS
Hasbro, Inc.
NASDAQ
- 12.7% pullback to SMA9 over 30 days
- Crossed back above SMA9 today
- RSI at 54, rising
- MACD histogram improving
Base✓Strict✓Score83.0
Returns
StockMktDiff
1D———
2D———
3D———
5D———
10D———
results pending next close
 click to enlarge
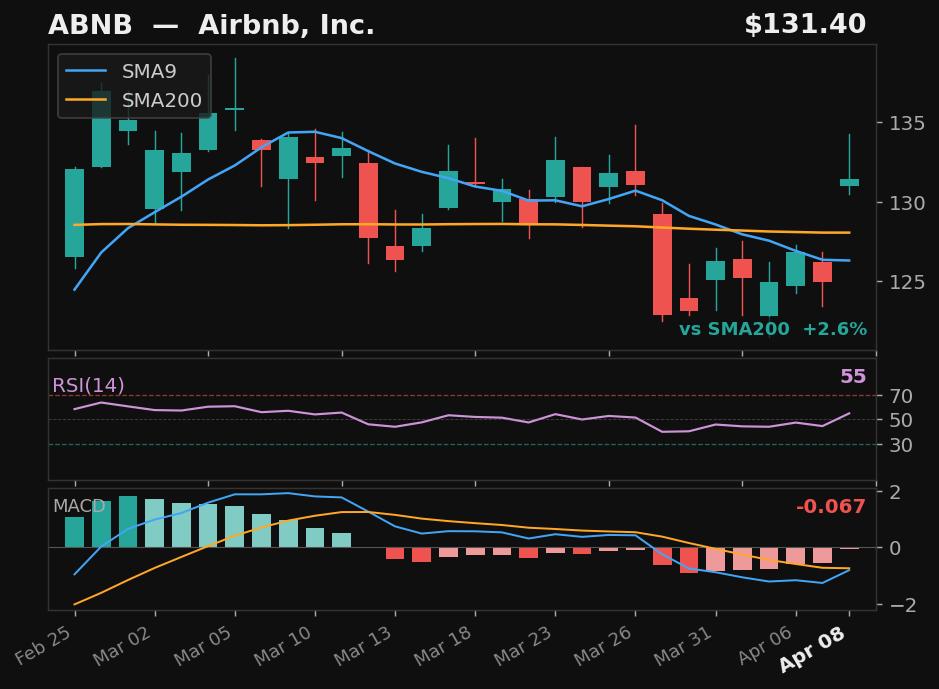
ABNB
Airbnb, Inc.
NASDAQ
- 6.2% pullback to SMA9 over 7 days
- Crossed back above SMA9 today
- RSI at 54, rising
- MACD histogram improving
Base✓Strict✓Score82.0
Returns
StockMktDiff
1D———
2D———
3D———
5D———
10D———
results pending next close
 click to enlarge
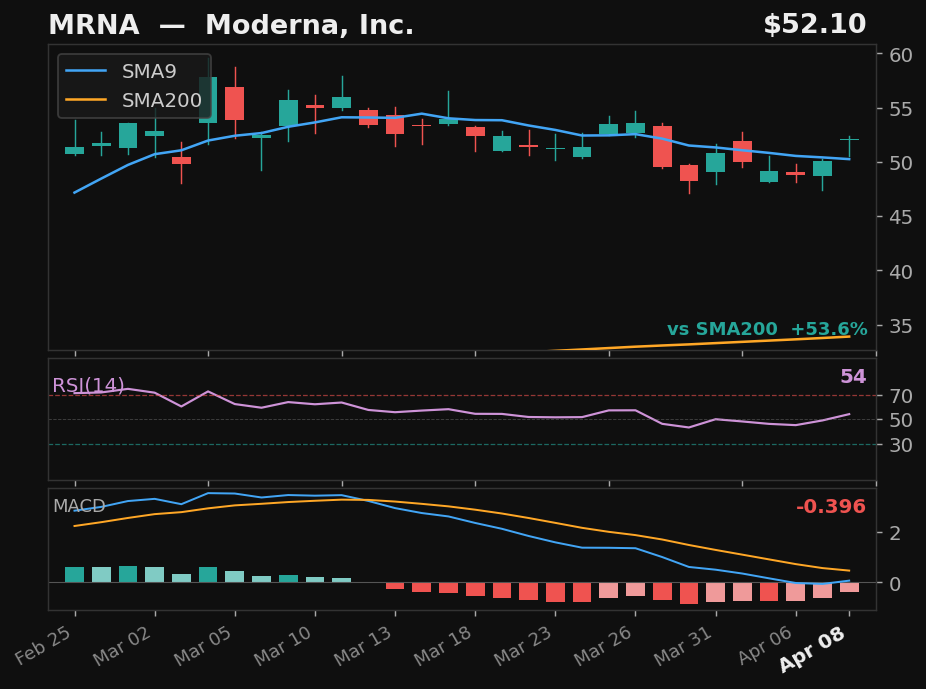
MRNA
Moderna, Inc.
NASDAQ
- 10.0% pullback to SMA9 over 7 days
- Crossed back above SMA9 today
- RSI at 53, rising
- MACD histogram improving
Base✓Strict✓Score78.0
Returns
StockMktDiff
1D———
2D———
3D———
5D———
10D———
results pending next close
 click to enlarge
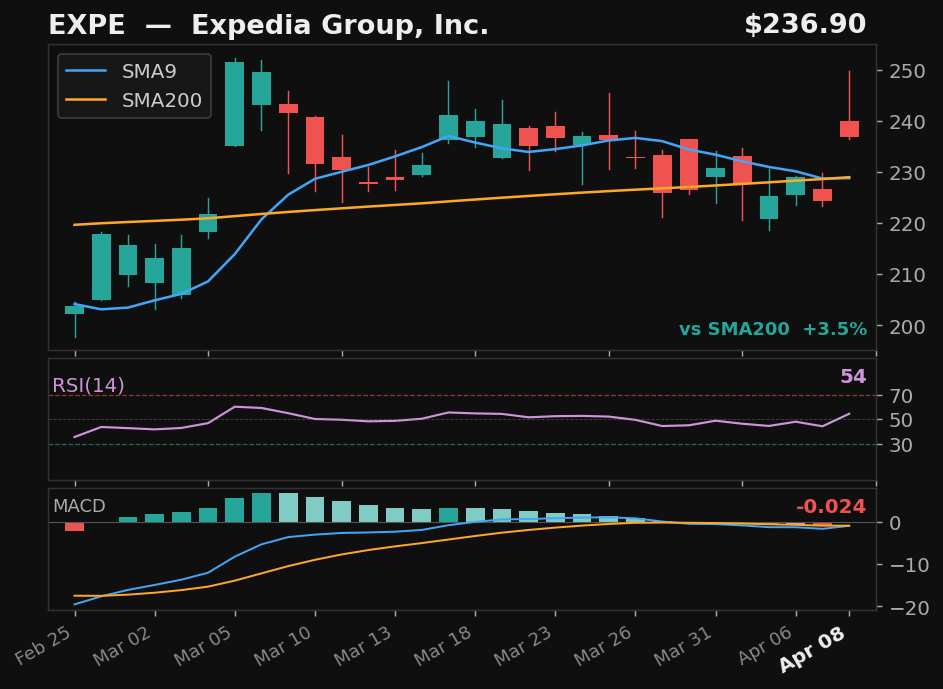
EXPE
Expedia Group, Inc.
NASDAQ
- 5.1% pullback to SMA9 over 8 days
- Crossed back above SMA9 today
- RSI at 54, rising
- MACD histogram improving
Base✓Strict✗Score74.0
Returns
StockMktDiff
1D———
2D———
3D———
5D———
10D———
results pending next close
 click to enlarge
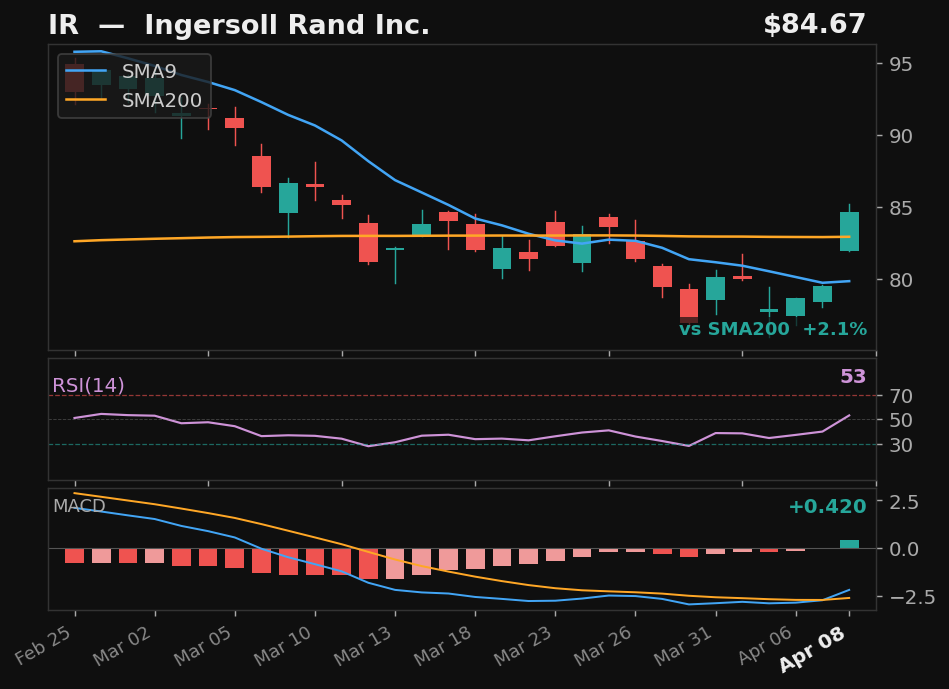
IR
Ingersoll Rand Inc.
NYSE
- 8.0% pullback to SMA9 over 8 days
- Crossed back above SMA9 today
- RSI at 53, rising
- MACD bullish cross 1 day ago
Base✓Strict✗Score72.0
Returns
StockMktDiff
1D———
2D———
3D———
5D———
10D———
results pending next close
 click to enlarge
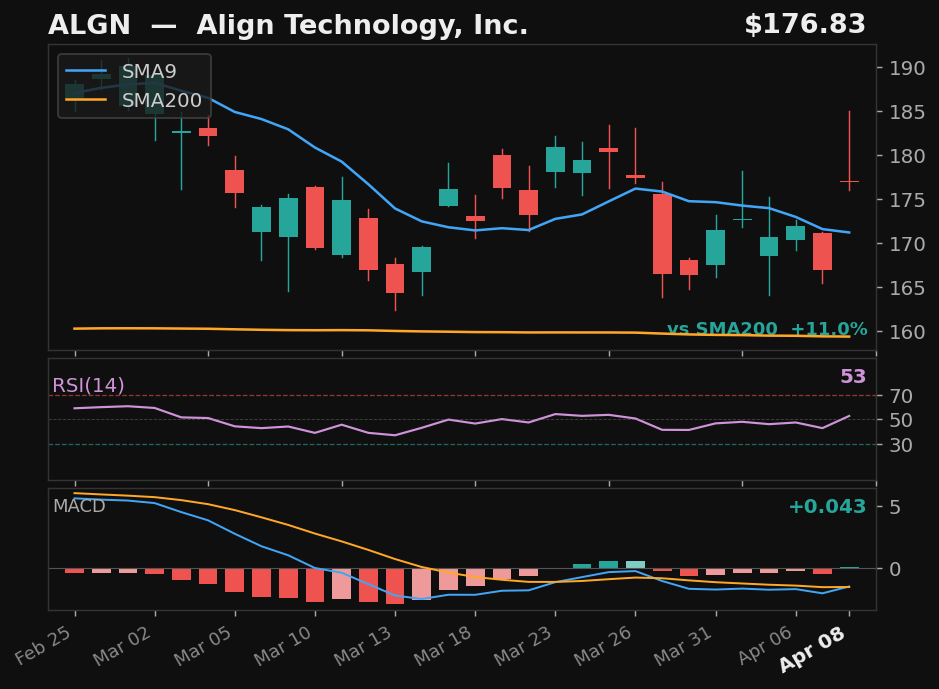
ALGN
Align Technology, Inc.
NASDAQ
- 6.2% pullback to SMA9 over 7 days
- Crossed back above SMA9 today
- RSI at 53, rising
- MACD histogram improving
Base✓Strict✗Score69.0
Returns
StockMktDiff
1D———
2D———
3D———
5D———
10D———
results pending next close
 click to enlarge
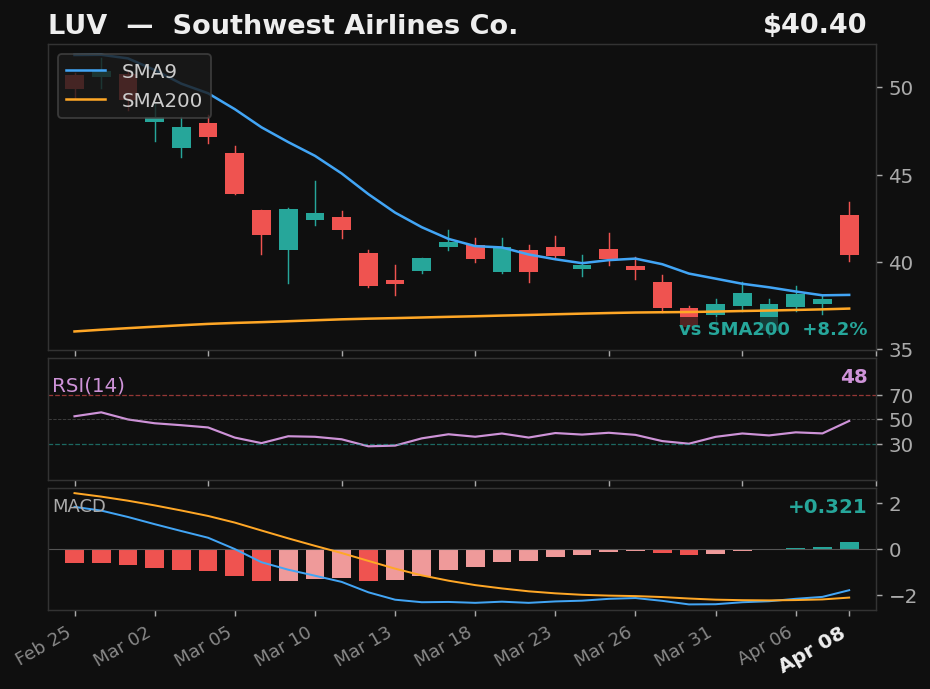
LUV
Southwest Airlines Co.
NYSE
- 9.7% pullback to SMA9 over 8 days
- Crossed back above SMA9 today
- RSI at 50, rising
- MACD bullish cross 2 days ago
Base✓Strict✗Score67.0
Returns
StockMktDiff
1D———
2D———
3D———
5D———
10D———
results pending next close