Wednesday, April 22, 2026 · After Close
★ Highlights
4
▼
 click to enlarge
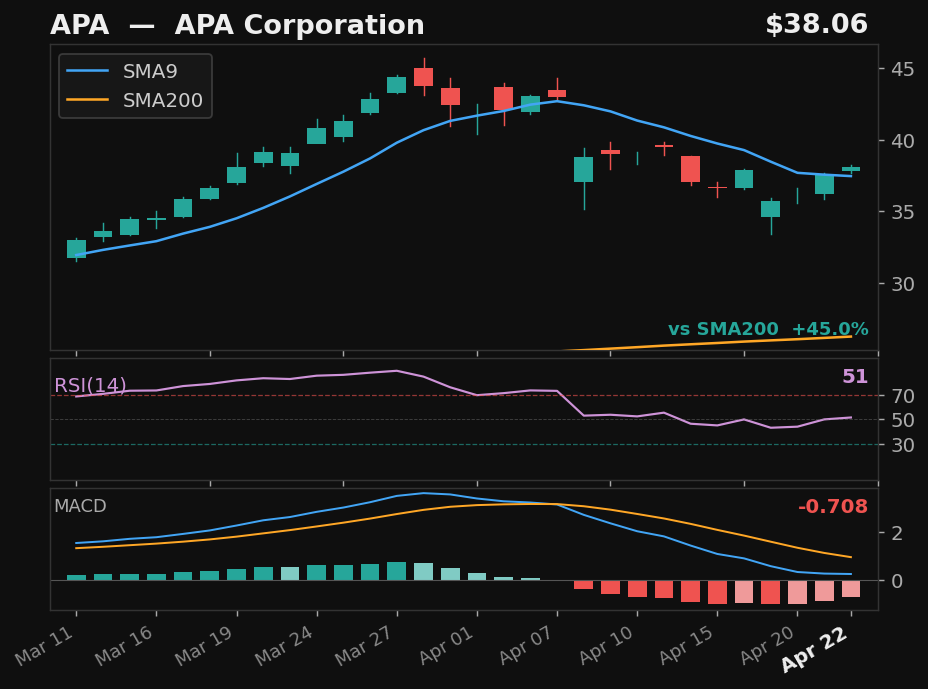
APA★
APA Corporation
NASDAQ
- 16.8% pullback to SMA9 over 9 days
- Crossed above SMA9 — 2 days above
- RSI at 51, rising
- MACD histogram improving
Returns
StockMktDiff
1D———
2D———
3D———
5D———
10D———
results pending next close
 click to enlarge
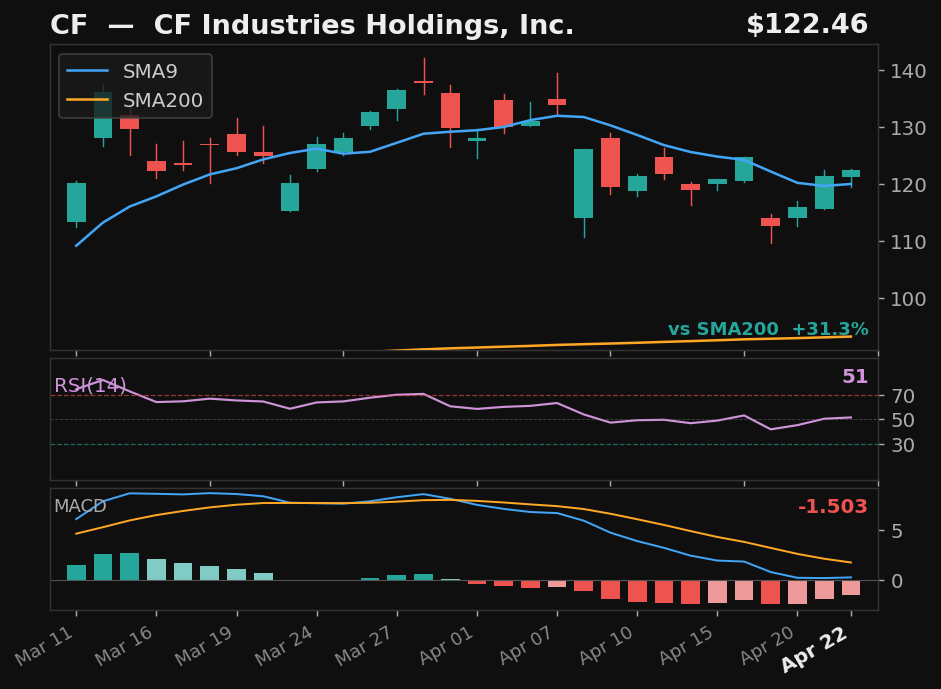
CF★
CF Industries Holdings, Inc.
NYSE
- 15.8% pullback to SMA9 over 8 days
- Crossed above SMA9 — 2 days above
- RSI at 51, rising
- MACD histogram improving
Returns
StockMktDiff
1D———
2D———
3D———
5D———
10D———
results pending next close
 click to enlarge
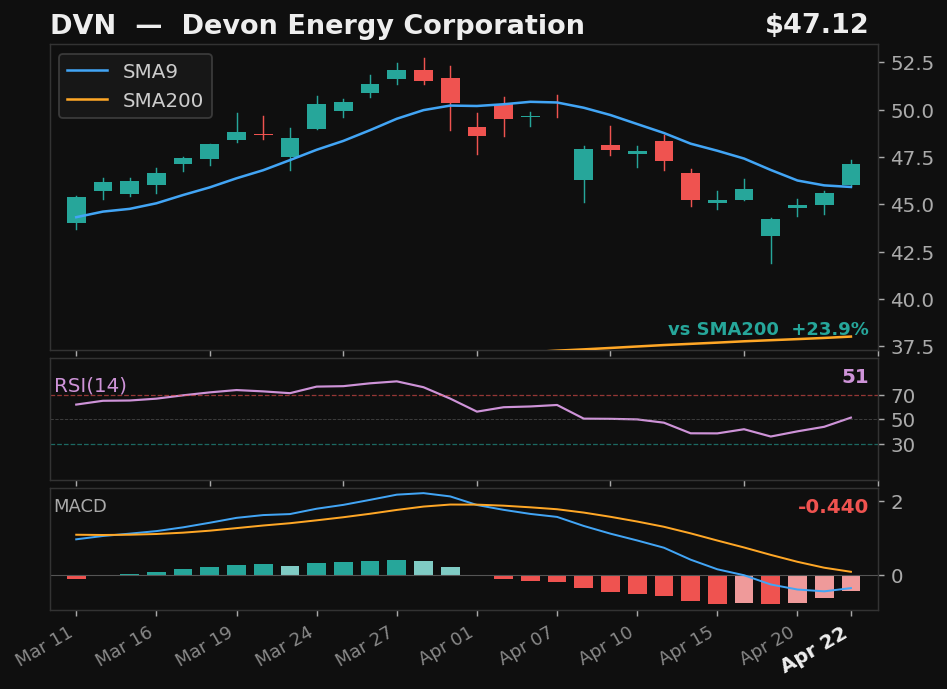
DVN★
Devon Energy Corporation
NYSE
- 12.1% pullback to SMA9 over 14 days
- Crossed back above SMA9 today
- RSI at 51, rising
- MACD histogram improving
Returns
StockMktDiff
1D———
2D———
3D———
5D———
10D———
results pending next close
 click to enlarge
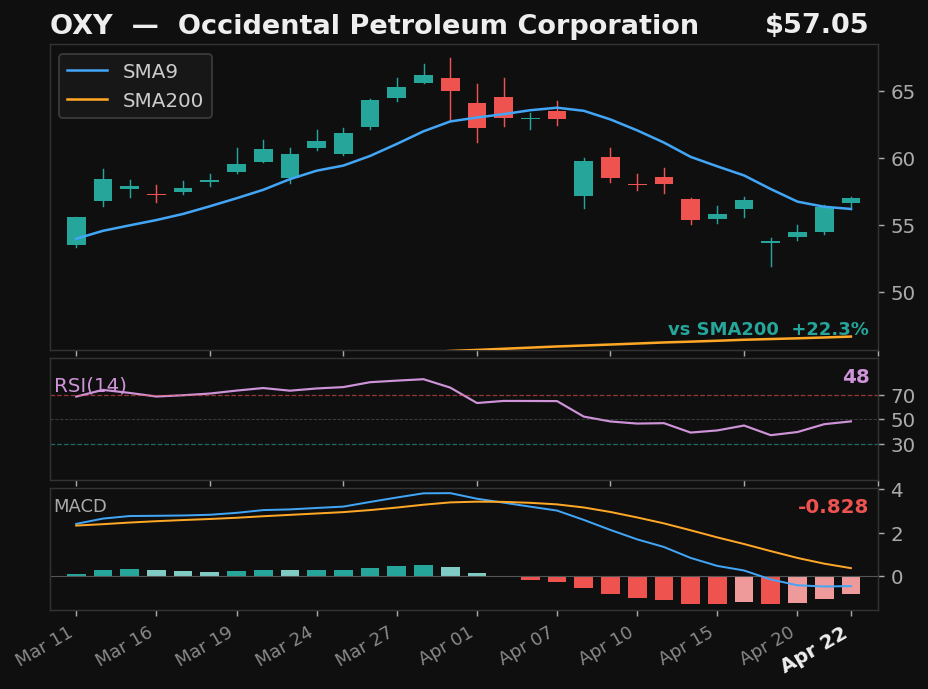
OXY★
Occidental Petroleum Corporation
NYSE
- 17.2% pullback to SMA9 over 14 days
- Crossed back above SMA9 today
- RSI at 48, rising
- MACD histogram improving
Returns
StockMktDiff
1D———
2D———
3D———
5D———
10D———
results pending next close
Empirical V1
5
▼
click to enlarge
APA★
APA Corporation
NASDAQ
- 16.8% pullback — full candle body above SMA9
- RSI at 51, rising above 50
- MACD histogram rising while still negative — early recovery signal
- 45.0% above SMA200 — extended from trend
Emp Score53.1Body Above✓
Returns
StockMktDiff
1D———
2D———
3D———
5D———
10D———
results pending next close
 click to enlarge
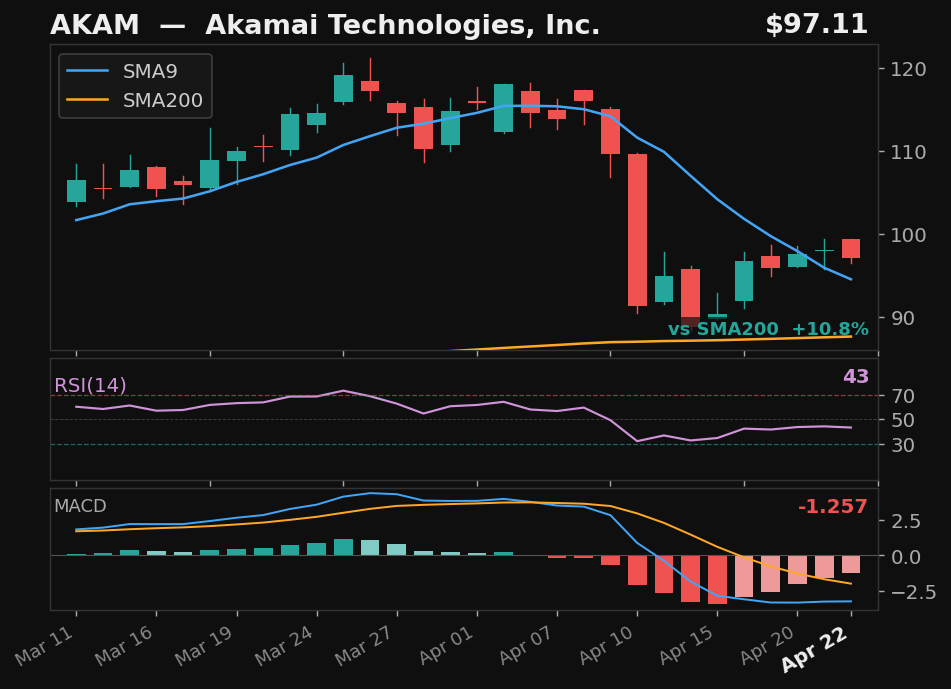
AKAM
Akamai Technologies, Inc.
NASDAQ
- 23.4% pullback — full candle body above SMA9
- MACD histogram rising while still negative — early recovery signal
- 10.8% above SMA200 — extended from trend
Emp Score53.1Body Above✓
Returns
StockMktDiff
1D———
2D———
3D———
5D———
10D———
results pending next close
click to enlarge
CF★
CF Industries Holdings, Inc.
NYSE
- 15.8% pullback — full candle body above SMA9
- RSI at 51, rising above 50
- MACD histogram rising while still negative — early recovery signal
- 31.3% above SMA200 — extended from trend
Emp Score46.9Body Above✓
Returns
StockMktDiff
1D———
2D———
3D———
5D———
10D———
results pending next close
click to enlarge
OXY★
Occidental Petroleum Corporation
NYSE
- 17.2% pullback over 14 days — full candle above SMA9
- RSI rising from 48
- MACD histogram rising while still negative — early recovery signal
- 22.3% above SMA200 — extended from trend
Emp Score44.2Body Above✓
Returns
StockMktDiff
1D———
2D———
3D———
5D———
10D———
results pending next close
click to enlarge
DVN★
Devon Energy Corporation
NYSE
- 12.1% pullback over 14 days — full candle above SMA9
- RSI at 51, rising above 50
- MACD histogram rising while still negative — early recovery signal
- 23.9% above SMA200 — extended from trend
Emp Score37.4Body Above✓
Returns
StockMktDiff
1D———
2D———
3D———
5D———
10D———
results pending next close
SwingTrader Setups
10
▼
 click to enlarge
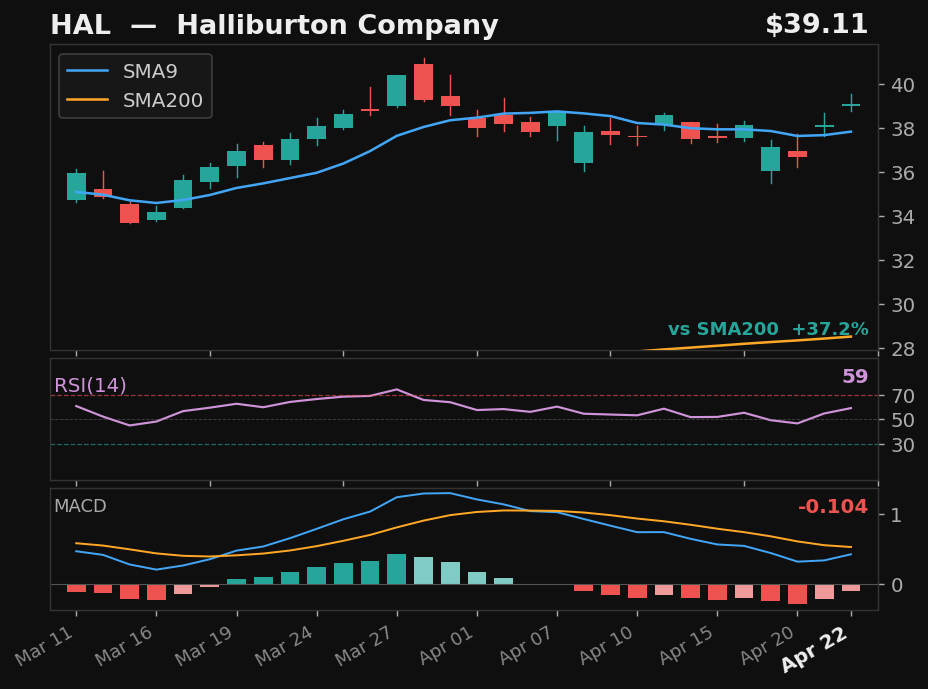
HAL
Halliburton Company
NYSE
- 5.9% pullback to SMA9 over 11 days
- Crossed above SMA9 — 2 days above
- RSI at 59, rising
- MACD histogram improving
Base✓Strict✓Score83.0
Returns
StockMktDiff
1D———
2D———
3D———
5D———
10D———
results pending next close
 click to enlarge
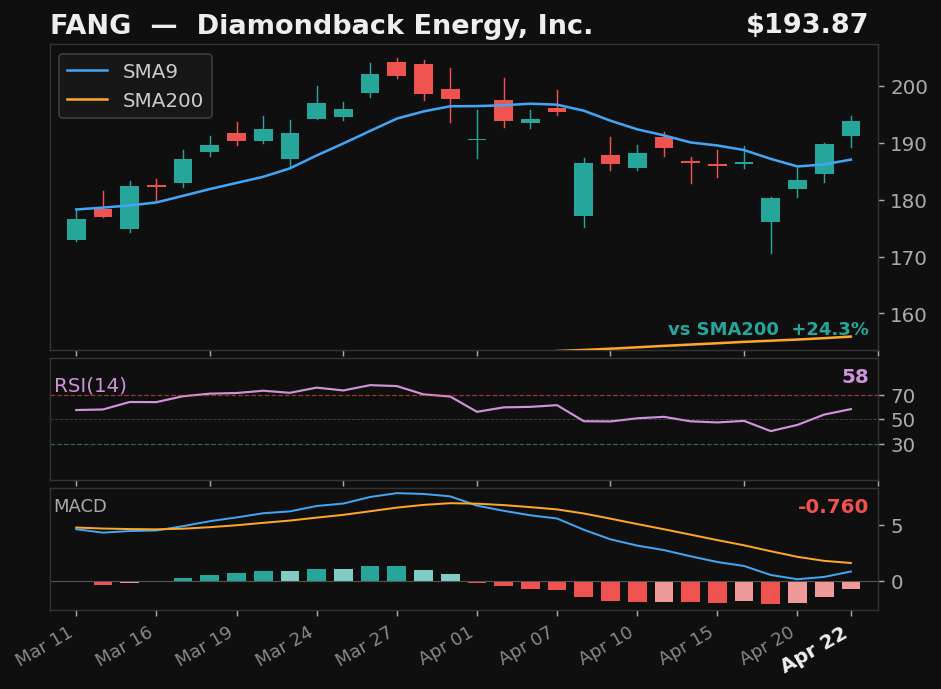
FANG
Diamondback Energy, Inc.
NASDAQ
- 8.9% pullback to SMA9 over 13 days
- Crossed above SMA9 — 2 days above
- RSI at 58, rising
- MACD histogram improving
Base✓Strict✓Score78.0
Returns
StockMktDiff
1D———
2D———
3D———
5D———
10D———
results pending next close
 click to enlarge
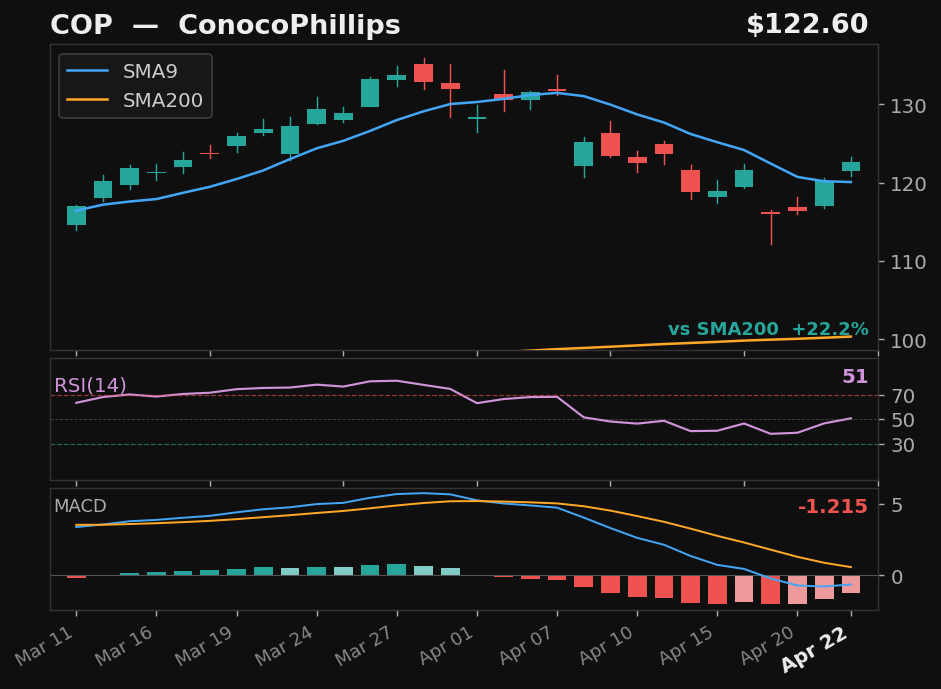
COP
ConocoPhillips
NYSE
- 11.9% pullback to SMA9 over 9 days
- Crossed above SMA9 — 2 days above
- RSI at 50, rising
- MACD histogram improving
Base✓Strict✓Score74.0
Returns
StockMktDiff
1D———
2D———
3D———
5D———
10D———
results pending next close
click to enlarge
APA★
APA Corporation
NASDAQ
- 16.8% pullback to SMA9 over 9 days
- Crossed above SMA9 — 2 days above
- RSI at 51, rising
- MACD histogram improving
Base✓Strict✓Score70.0
Returns
StockMktDiff
1D———
2D———
3D———
5D———
10D———
results pending next close
click to enlarge
CF★
CF Industries Holdings, Inc.
NYSE
- 15.8% pullback to SMA9 over 8 days
- Crossed above SMA9 — 2 days above
- RSI at 51, rising
- MACD histogram improving
Base✓Strict✓Score70.0
Returns
StockMktDiff
1D———
2D———
3D———
5D———
10D———
results pending next close
 click to enlarge
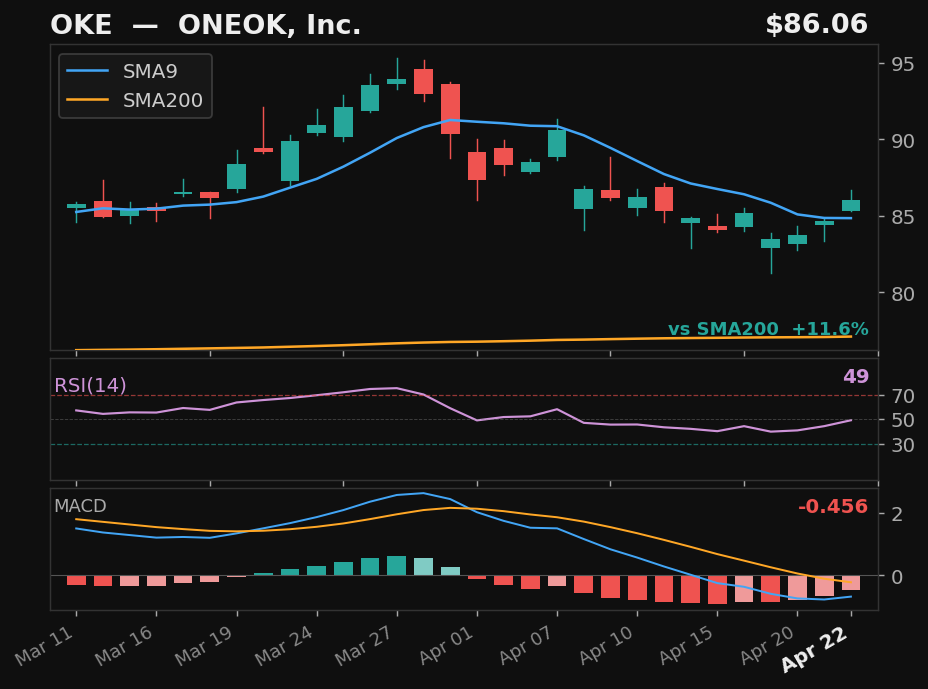
OKE
ONEOK, Inc.
NYSE
- 10.2% pullback to SMA9 over 15 days
- Crossed back above SMA9 today
- RSI at 49, rising
- MACD histogram improving
Base✓Strict✓Score69.0
Returns
StockMktDiff
1D———
2D———
3D———
5D———
10D———
results pending next close
click to enlarge
DVN★
Devon Energy Corporation
NYSE
- 12.1% pullback to SMA9 over 14 days
- Crossed back above SMA9 today
- RSI at 51, rising
- MACD histogram improving
Base✓Strict✓Score68.0
Returns
StockMktDiff
1D———
2D———
3D———
5D———
10D———
results pending next close
 click to enlarge
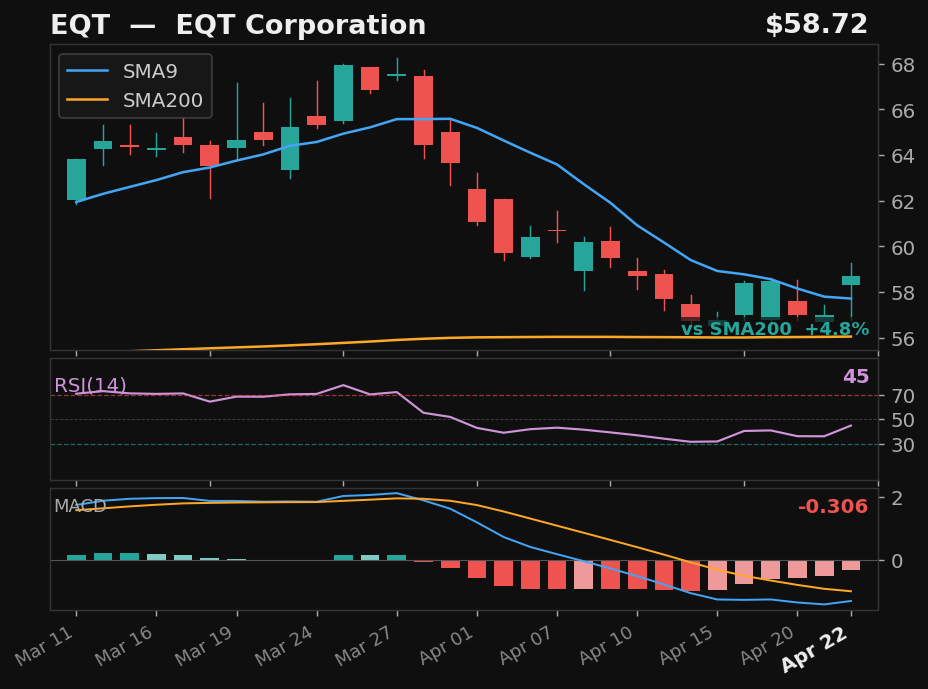
EQT
EQT Corporation
NYSE
- 16.0% pullback to SMA9 over 16 days
- Crossed back above SMA9 today
- RSI rising from 45 — recovering momentum
- MACD histogram improving
Base✓Strict✓Score67.0
Returns
StockMktDiff
1D———
2D———
3D———
5D———
10D———
results pending next close
click to enlarge
OXY★
Occidental Petroleum Corporation
NYSE
- 17.2% pullback to SMA9 over 14 days
- Crossed back above SMA9 today
- RSI at 48, rising
- MACD histogram improving
Base✓Strict✓Score66.0
Returns
StockMktDiff
1D———
2D———
3D———
5D———
10D———
results pending next close
 click to enlarge
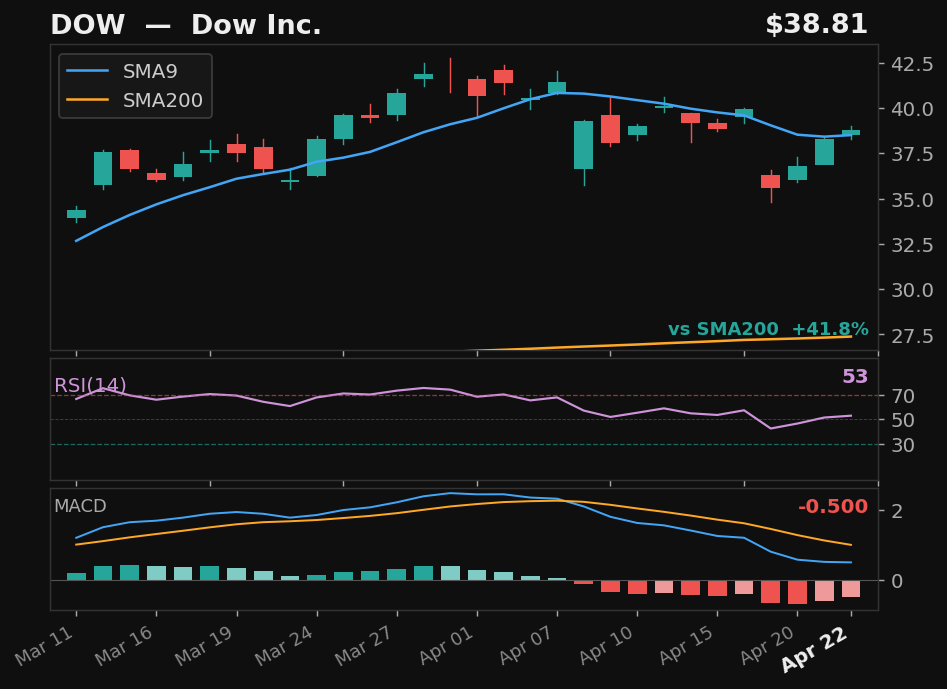
DOW
Dow Inc.
NYSE
- 14.0% pullback to SMA9 over 9 days
- Crossed back above SMA9 today
- RSI at 52, rising
- MACD histogram improving
Base✓Strict✗Score63.0
Returns
StockMktDiff
1D———
2D———
3D———
5D———
10D———
results pending next close