Thursday, April 23, 2026 · After Close
★ Highlights
1
▼
 click to enlarge
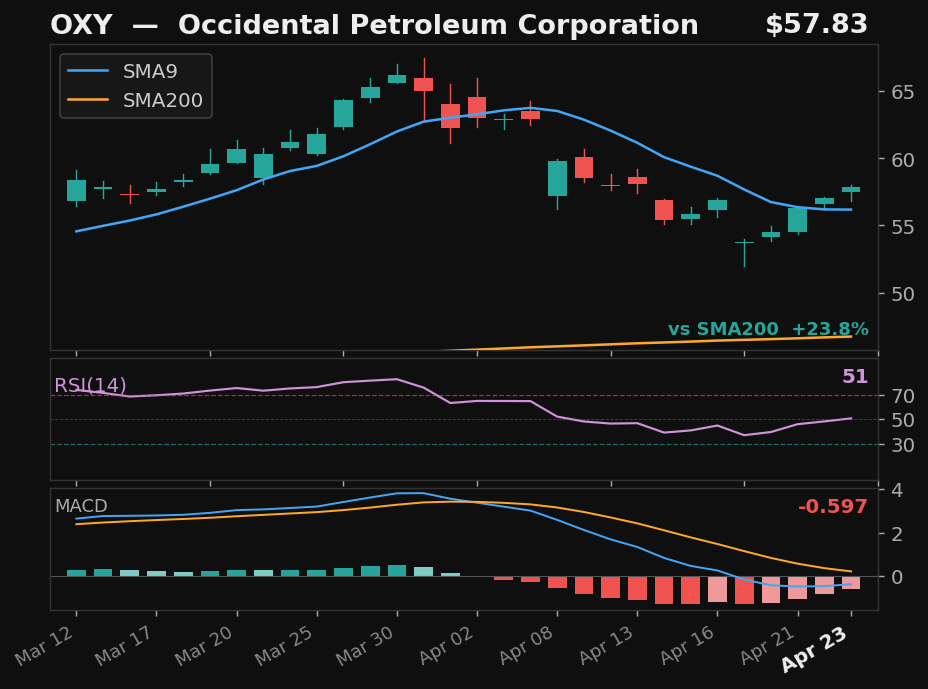
OXY★
Occidental Petroleum Corporation
NYSE
- 17.2% pullback to SMA9 over 14 days
- Crossed above SMA9 — 2 days above
- RSI at 51, rising
- MACD histogram improving
Returns
StockMktDiff
1D———
2D———
3D———
5D———
10D———
results pending next close
Empirical V1
5
▼
 click to enlarge
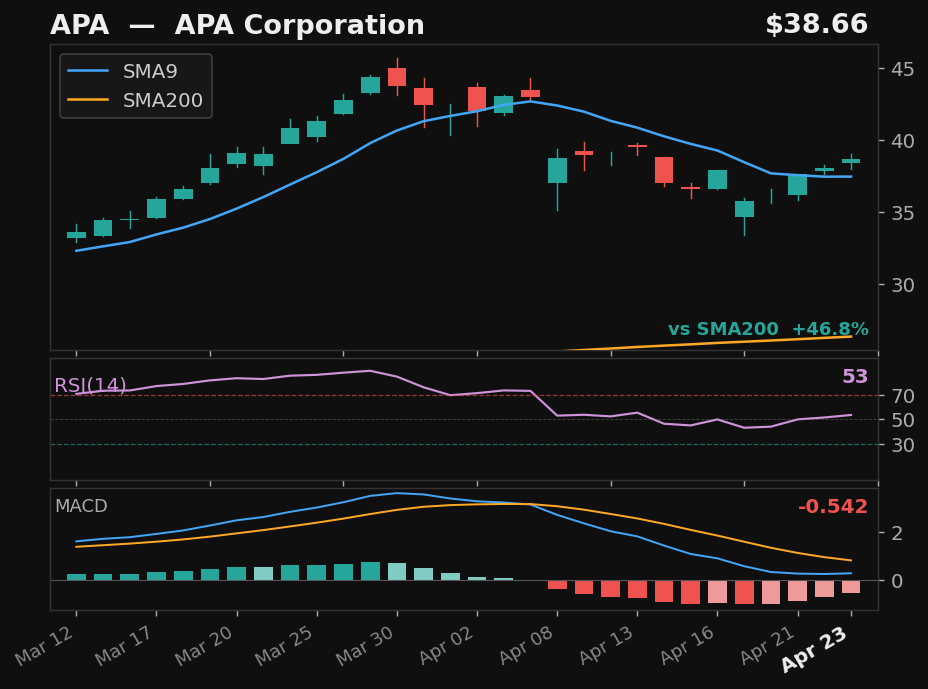
APA
APA Corporation
NASDAQ
- 16.8% pullback — full candle body above SMA9
- RSI at 53, rising above 50
- MACD histogram rising while still negative — early recovery signal
- 46.8% above SMA200 — extended from trend
Emp Score53.6Body Above✓
Returns
StockMktDiff
1D———
2D———
3D———
5D———
10D———
results pending next close
 click to enlarge
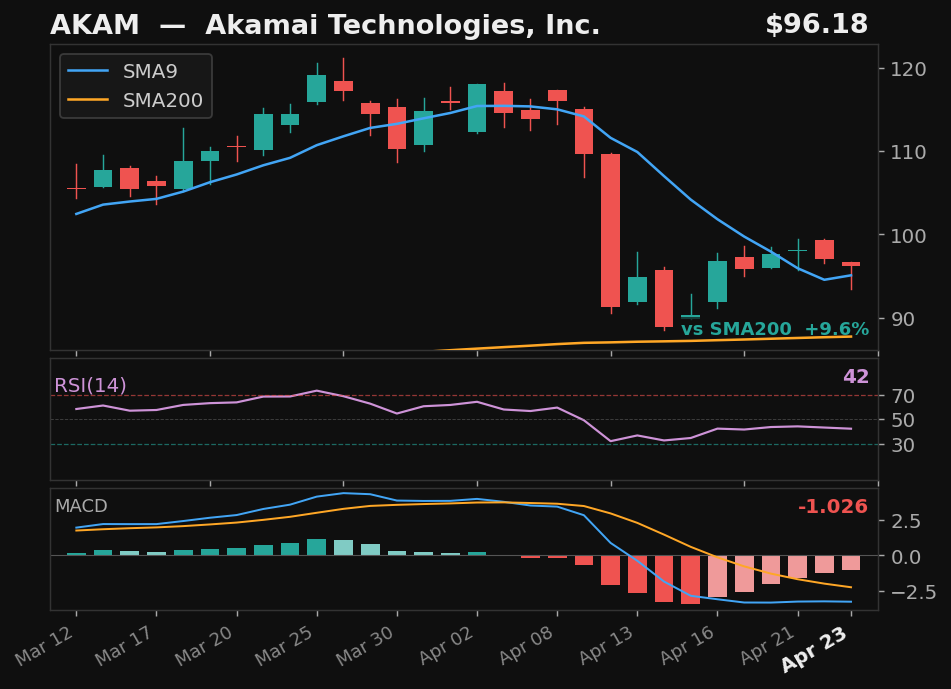
AKAM
Akamai Technologies, Inc.
NASDAQ
- 23.4% pullback — full candle body above SMA9
- MACD histogram rising while still negative — early recovery signal
- 9.6% above SMA200 — extended from trend
Emp Score52.7Body Above✓
Returns
StockMktDiff
1D———
2D———
3D———
5D———
10D———
results pending next close
 click to enlarge
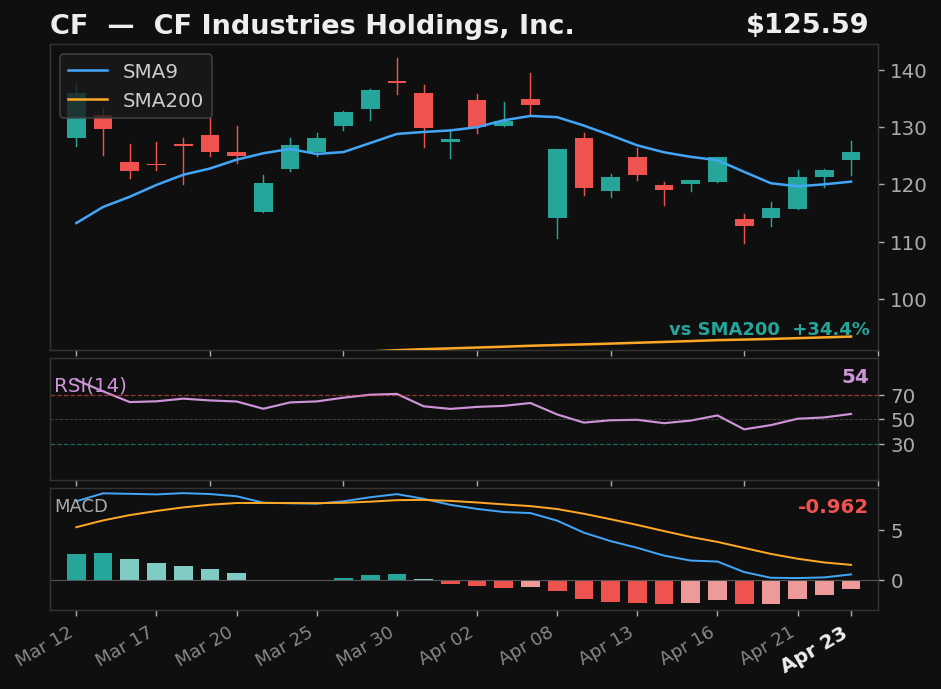
CF
CF Industries Holdings, Inc.
NYSE
- 15.8% pullback — full candle body above SMA9
- RSI at 54, rising above 50
- MACD histogram rising while still negative — early recovery signal
- 34.4% above SMA200 — extended from trend
Emp Score47.9Body Above✓
Returns
StockMktDiff
1D———
2D———
3D———
5D———
10D———
results pending next close
click to enlarge
OXY★
Occidental Petroleum Corporation
NYSE
- 17.2% pullback — full candle body above SMA9
- RSI at 51, rising above 50
- MACD histogram rising while still negative — early recovery signal
- 23.8% above SMA200 — extended from trend
Emp Score47.6Body Above✓
Returns
StockMktDiff
1D———
2D———
3D———
5D———
10D———
results pending next close
 click to enlarge
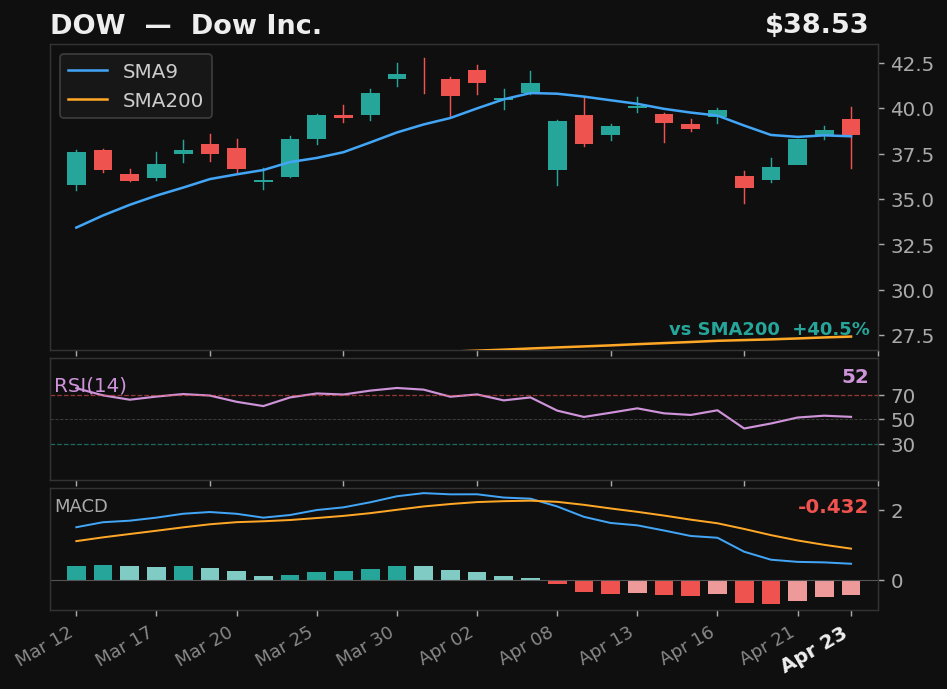
DOW
Dow Inc.
NYSE
- 14.0% pullback — full candle body above SMA9
- MACD histogram rising while still negative — early recovery signal
- 40.5% above SMA200 — extended from trend
Emp Score46.2Body Above✓
Returns
StockMktDiff
1D———
2D———
3D———
5D———
10D———
results pending next close
SwingTrader Setups
10
▼
 click to enlarge
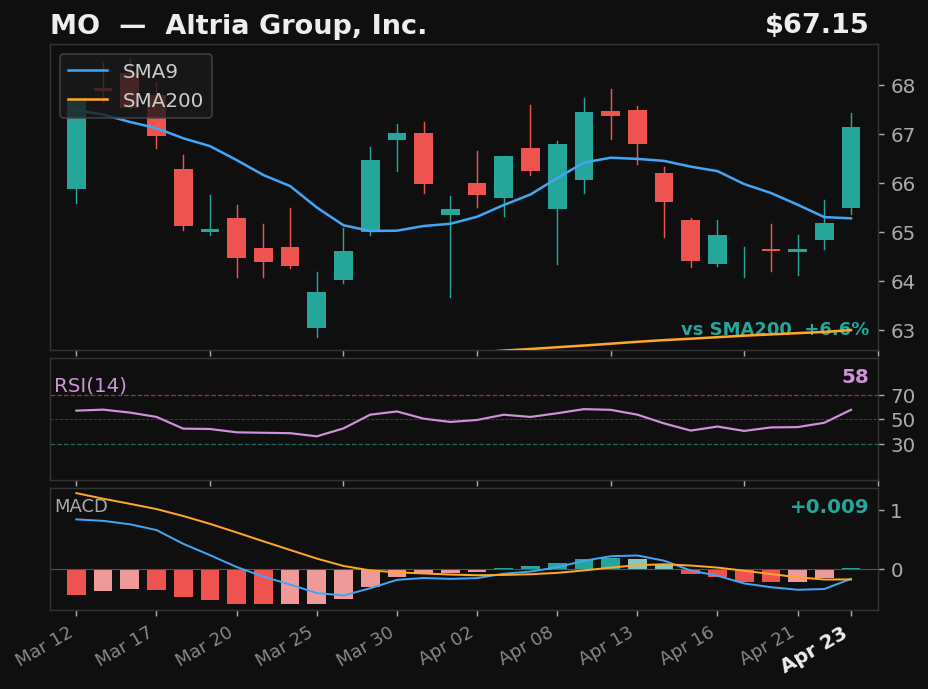
MO
Altria Group, Inc.
NYSE
- 4.0% pullback to SMA9 over 7 days
- Crossed back above SMA9 today
- RSI at 58, rising
- MACD histogram improving
Base✓Strict✓Score92.0
Returns
StockMktDiff
1D———
2D———
3D———
5D———
10D———
results pending next close
 click to enlarge
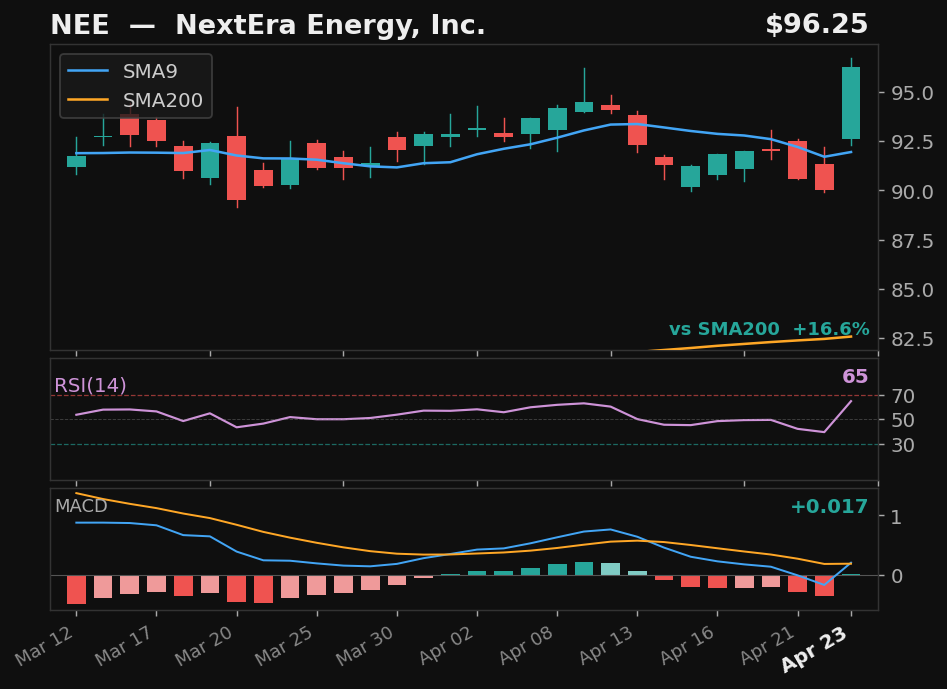
NEE
NextEra Energy, Inc.
NYSE
- 4.3% pullback to SMA9 over 8 days
- Crossed back above SMA9 today
- RSI at 65, rising
- MACD histogram improving
Base✓Strict✓Score92.0
Returns
StockMktDiff
1D———
2D———
3D———
5D———
10D———
results pending next close
 click to enlarge
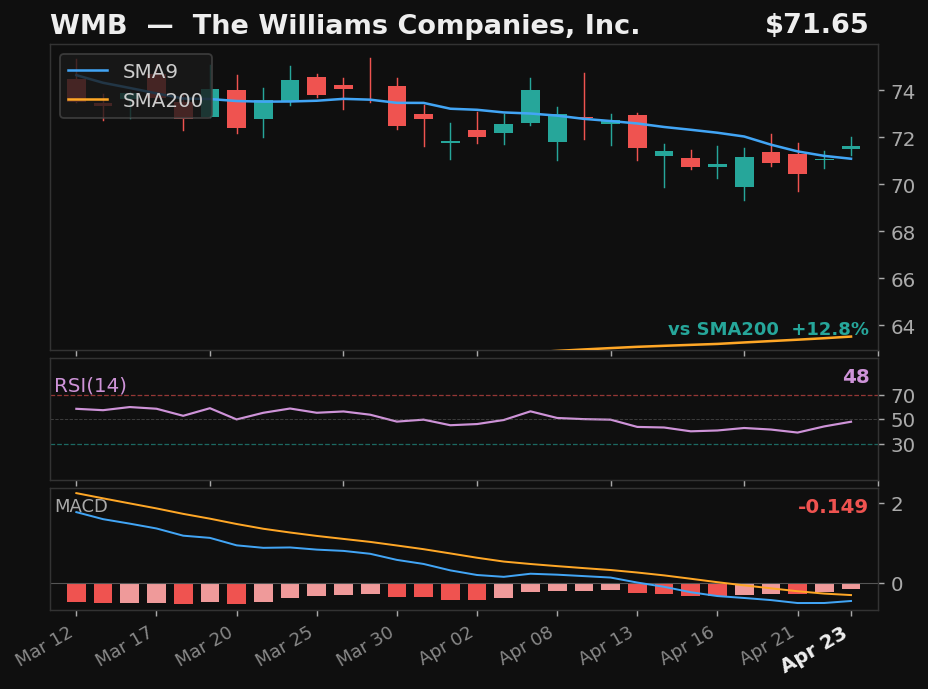
WMB
The Williams Companies, Inc.
NYSE
- 3.3% pullback to SMA9 over 8 days
- Crossed back above SMA9 today
- RSI at 48, rising
- MACD histogram improving
Base✓Strict✓Score86.0
Returns
StockMktDiff
1D———
2D———
3D———
5D———
10D———
results pending next close
 click to enlarge
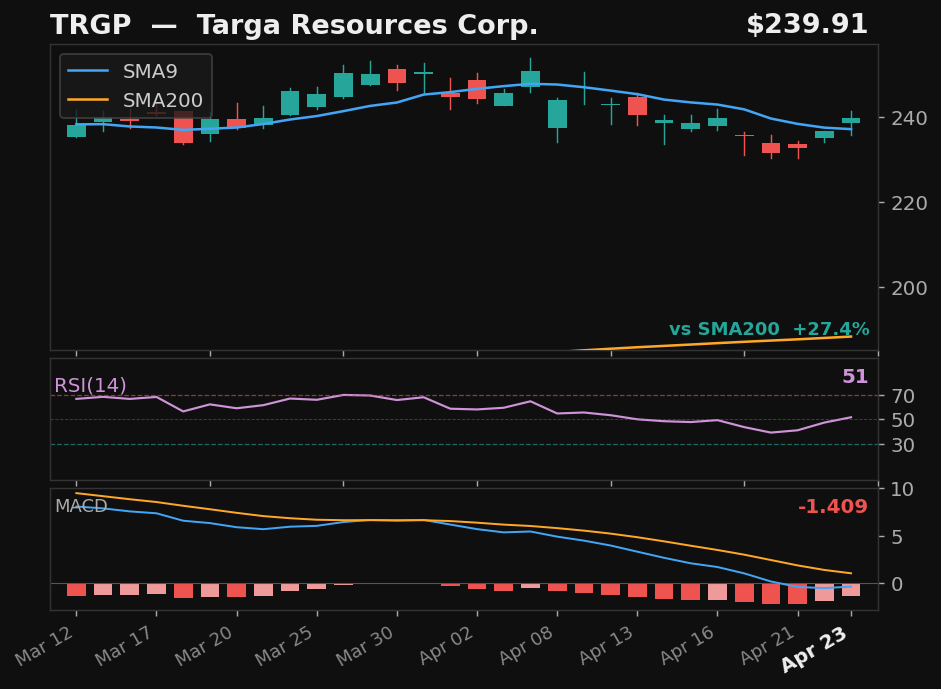
TRGP
Targa Resources Corp.
NYSE
- 7.8% pullback to SMA9 over 14 days
- Crossed back above SMA9 today
- RSI at 51, rising
- MACD histogram improving
Base✓Strict✓Score79.0
Returns
StockMktDiff
1D———
2D———
3D———
5D———
10D———
results pending next close
 click to enlarge
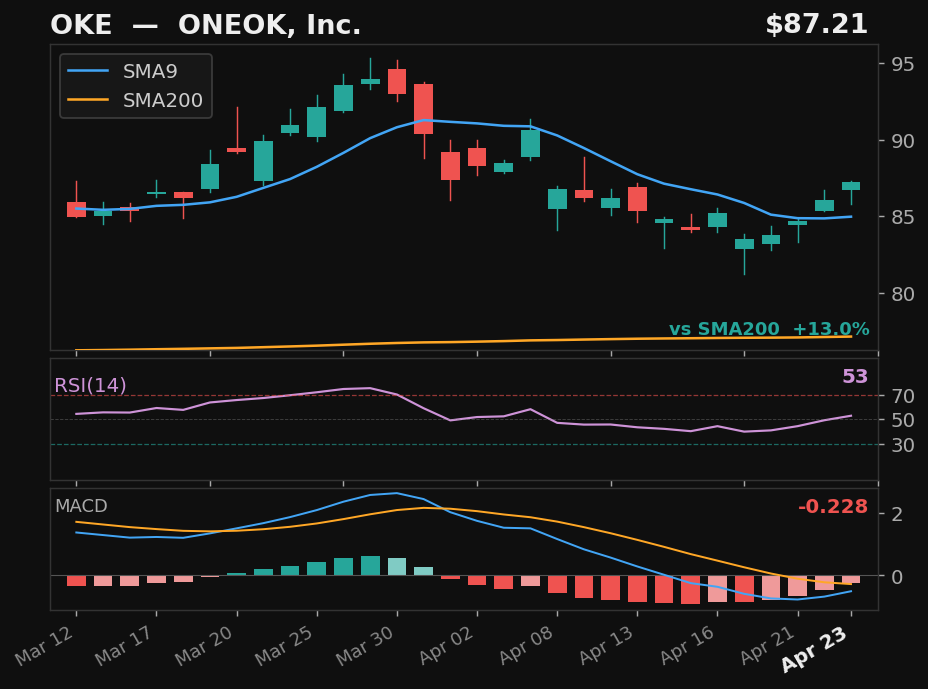
OKE
ONEOK, Inc.
NYSE
- 10.2% pullback to SMA9 over 15 days
- Crossed above SMA9 — 2 days above
- RSI at 52, rising
- MACD histogram improving
Base✓Strict✓Score73.0
Returns
StockMktDiff
1D———
2D———
3D———
5D———
10D———
results pending next close
 click to enlarge
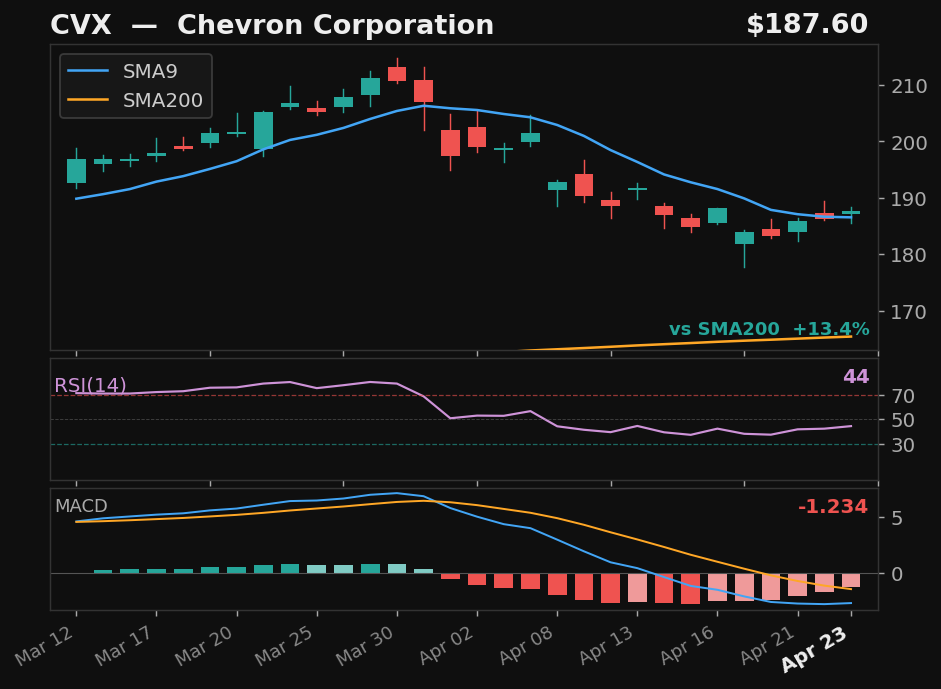
CVX
Chevron Corporation
NYSE
- 11.4% pullback to SMA9 over 15 days
- Crossed back above SMA9 today
- RSI rising from 44 — recovering momentum
- MACD histogram improving
Base✓Strict✓Score71.0
Returns
StockMktDiff
1D———
2D———
3D———
5D———
10D———
results pending next close
 click to enlarge
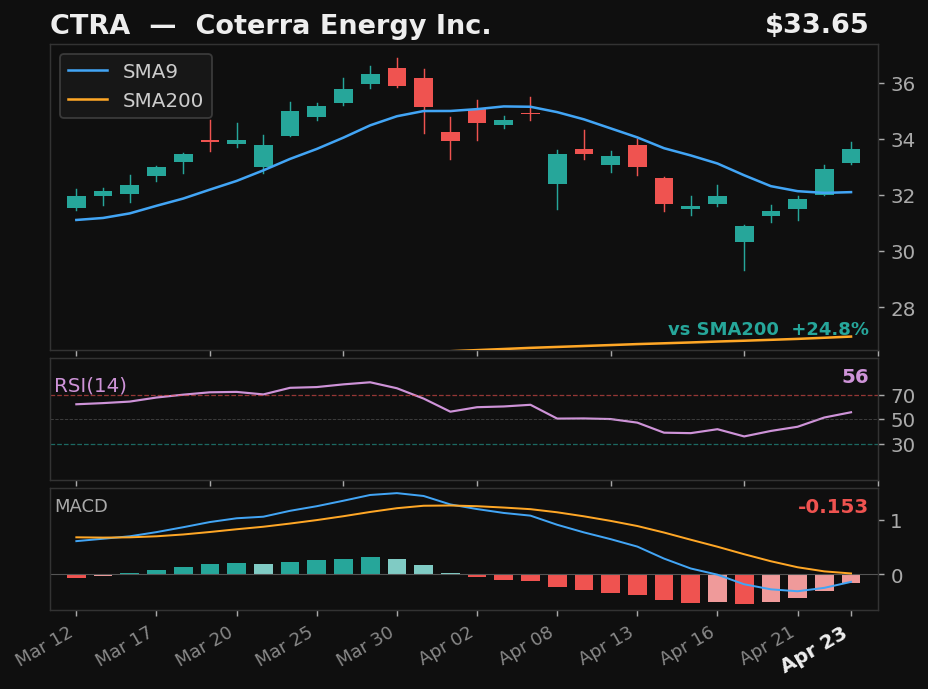
CTRA
Coterra Energy Inc.
NYSE
- 12.1% pullback to SMA9 over 14 days
- Crossed above SMA9 — 2 days above
- RSI at 55, rising
- MACD histogram improving
Base✓Strict✓Score70.0
Returns
StockMktDiff
1D———
2D———
3D———
5D———
10D———
results pending next close
 click to enlarge
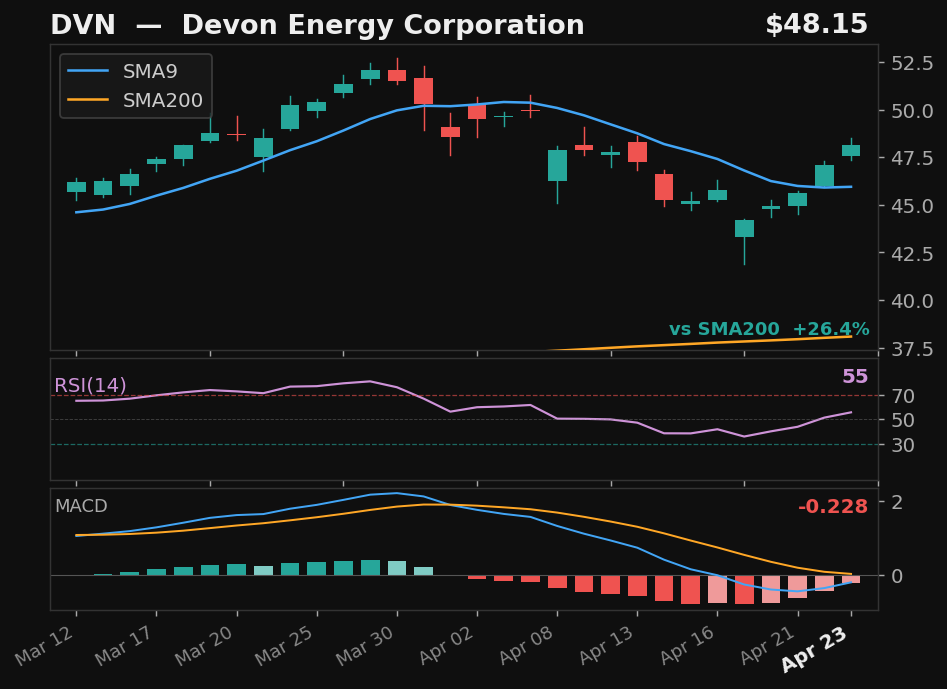
DVN
Devon Energy Corporation
NYSE
- 12.1% pullback to SMA9 over 14 days
- Crossed above SMA9 — 2 days above
- RSI at 55, rising
- MACD histogram improving
Base✓Strict✓Score70.0
Returns
StockMktDiff
1D———
2D———
3D———
5D———
10D———
results pending next close
click to enlarge
OXY★
Occidental Petroleum Corporation
NYSE
- 17.2% pullback to SMA9 over 14 days
- Crossed above SMA9 — 2 days above
- RSI at 51, rising
- MACD histogram improving
Base✓Strict✓Score70.0
Returns
StockMktDiff
1D———
2D———
3D———
5D———
10D———
results pending next close
 click to enlarge
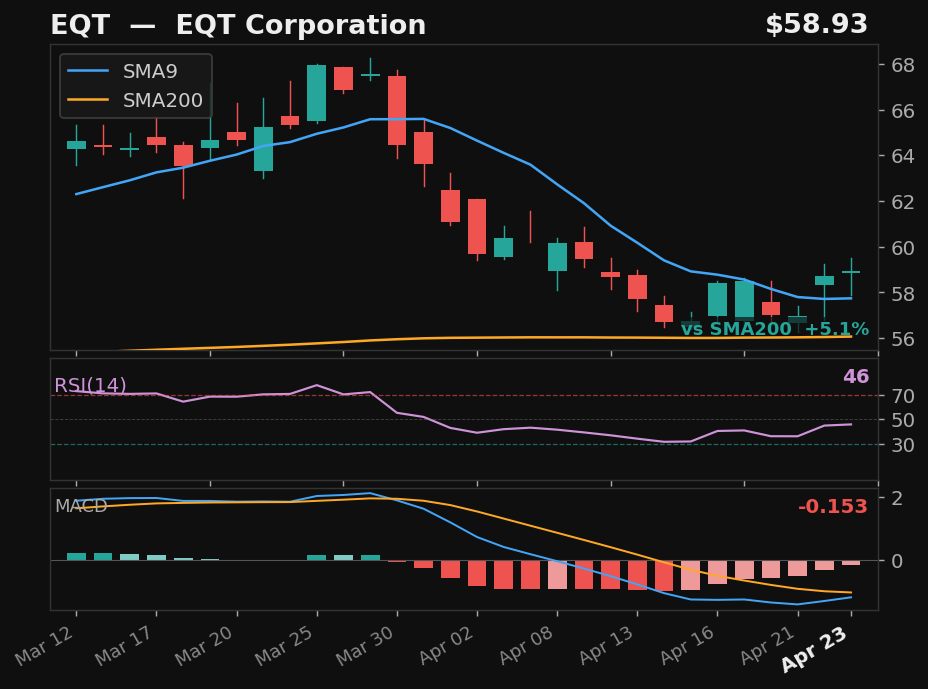
EQT
EQT Corporation
NYSE
- 16.0% pullback to SMA9 over 16 days
- Crossed above SMA9 — 2 days above
- RSI at 46, rising
- MACD histogram improving
Base✓Strict✓Score69.0
Returns
StockMktDiff
1D———
2D———
3D———
5D———
10D———
results pending next close