Monday, April 27, 2026 · After Close
★ Highlights
2
▼
 click to enlarge
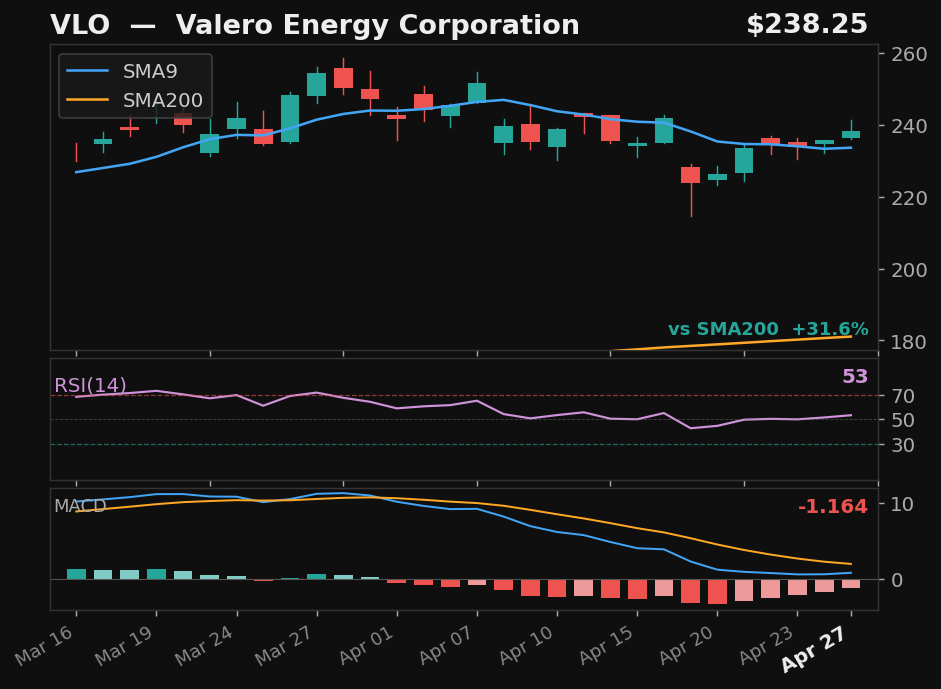
VLO★
Valero Energy Corporation
NYSE
- 11.1% pullback to SMA9 over 13 days
- Crossed above SMA9 — 2 days above
- RSI at 53, rising
- MACD histogram improving
Returns
StockMktDiff
1D———
2D———
3D———
5D———
10D———
results pending next close
 click to enlarge
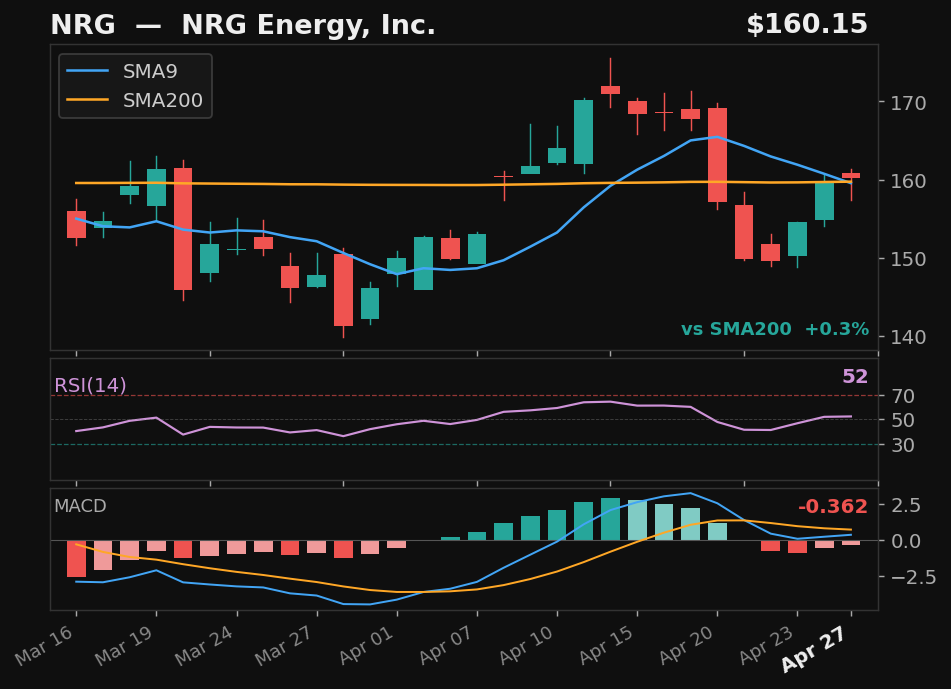
NRG★
NRG Energy, Inc.
NYSE
- 10.8% pullback over 5 days — full candle above SMA9
- RSI at 53, rising above 50
- MACD histogram rising while still negative — early recovery signal
Returns
StockMktDiff
1D———
2D———
3D———
5D———
10D———
results pending next close
Explosive Up Setups
2
▼
click to enlarge
NRG★
NRG Energy, Inc.
NYSE
- 10.8% pullback — 5 days below SMA9
- Prior rally: 12%
- Above SMA200 (0%)
- MACD histogram rising from negative — early momentum signal
Exp Score47Days Below5Pullback%10.8
Returns
StockMktDiff
1D———
2D———
3D———
5D———
10D———
results pending next close
 click to enlarge
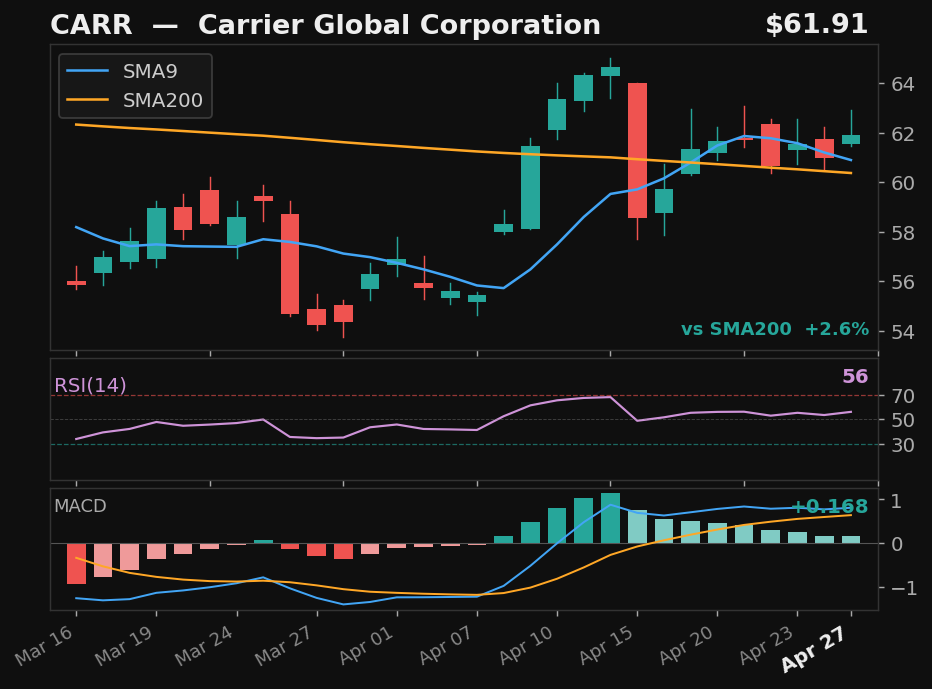
CARR
Carrier Global Corporation
NYSE
- 9.4% pullback — 6 days below SMA9
- Prior rally: 10%
- Above SMA200 (3%)
Exp Score37Days Below6Pullback%9.4
Returns
StockMktDiff
1D———
2D———
3D———
5D———
10D———
results pending next close
Empirical V1
5
▼
click to enlarge
VLO★
Valero Energy Corporation
NYSE
- 11.1% pullback — full candle body above SMA9
- RSI at 53, rising above 50
- MACD histogram rising while still negative — early recovery signal
- 31.6% above SMA200 — extended from trend
Emp Score37.6Body Above✓
Returns
StockMktDiff
1D———
2D———
3D———
5D———
10D———
results pending next close
 click to enlarge
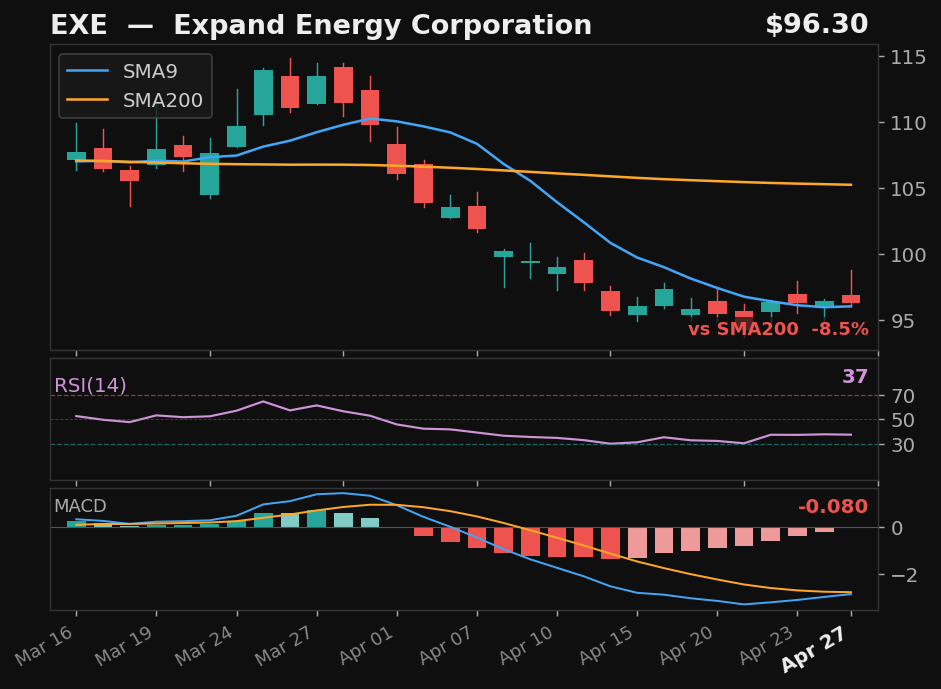
EXE
Expand Energy Corporation
NASDAQ
- 15.4% pullback — full candle body above SMA9
- MACD histogram rising while still negative — early recovery signal
- 8.5% below SMA200 — extended from trend
Emp Score36.4Body Above✓
Returns
StockMktDiff
1D———
2D———
3D———
5D———
10D———
results pending next close
 click to enlarge
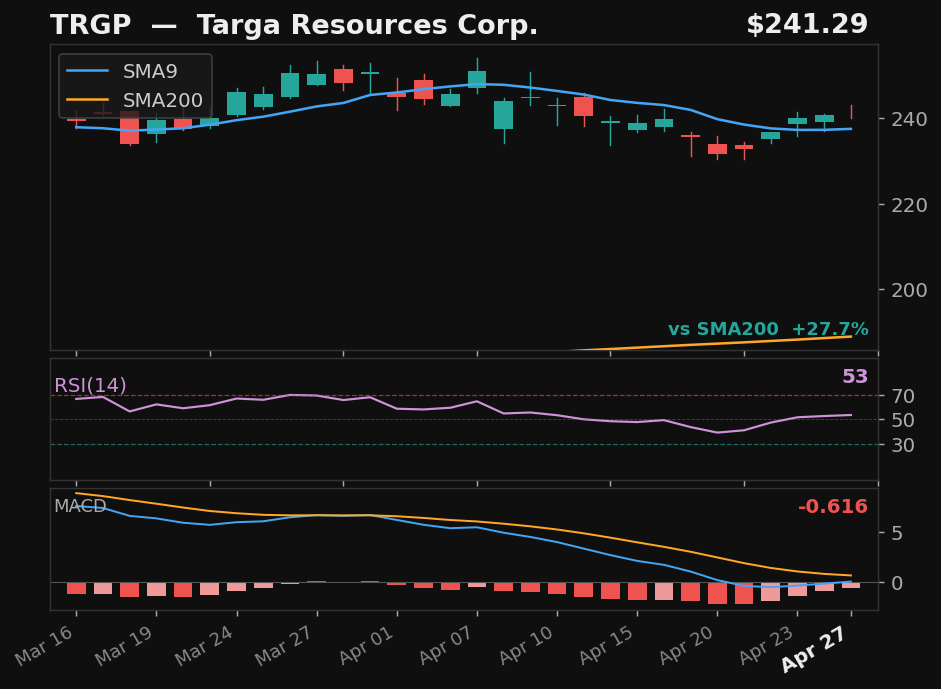
TRGP
Targa Resources Corp.
NYSE
- 7.8% pullback — full candle body above SMA9
- RSI at 53, rising above 50
- MACD histogram rising while still negative — early recovery signal
- 27.7% above SMA200 — extended from trend
Emp Score29.8Body Above✓
Returns
StockMktDiff
1D———
2D———
3D———
5D———
10D———
results pending next close
click to enlarge
NRG★
NRG Energy, Inc.
NYSE
- 10.8% pullback over 5 days — full candle above SMA9
- RSI at 53, rising above 50
- MACD histogram rising while still negative — early recovery signal
Emp Score27.7Body Above✓
Returns
StockMktDiff
1D———
2D———
3D———
5D———
10D———
results pending next close
 click to enlarge
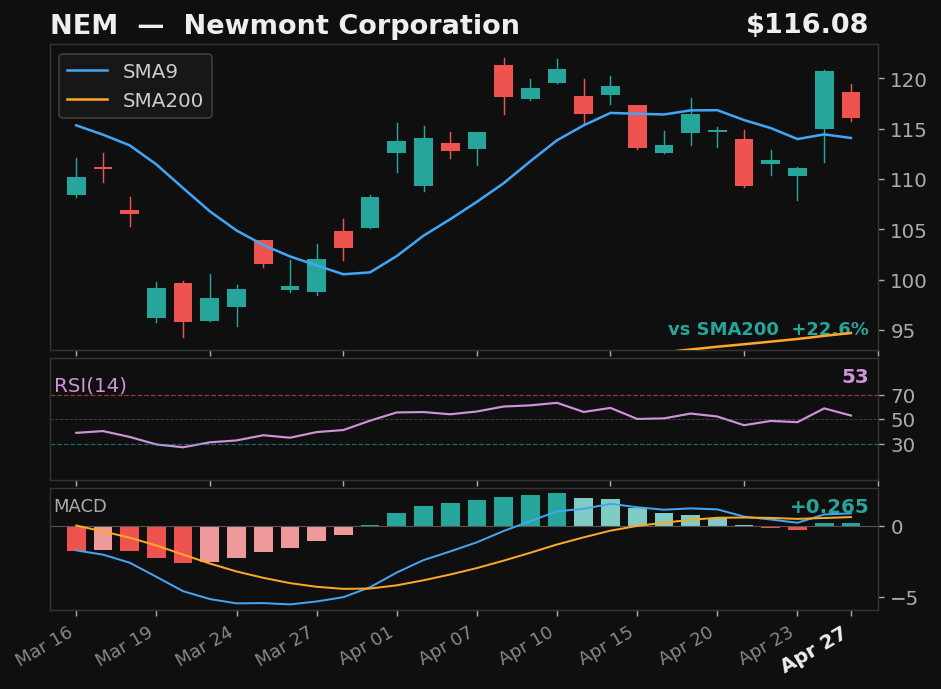
NEM
Newmont Corporation
NYSE
- 8.4% pullback — full candle body above SMA9
- MACD bullish cross 1 day ago
- 22.6% above SMA200 — extended from trend
Emp Score26.5Body Above✓
Returns
StockMktDiff
1D———
2D———
3D———
5D———
10D———
results pending next close
SwingTrader Setups
7
▼
click to enlarge
VLO★
Valero Energy Corporation
NYSE
- 11.1% pullback to SMA9 over 13 days
- Crossed above SMA9 — 2 days above
- RSI at 53, rising
- MACD histogram improving
Base✓Strict✓Score74.0
Returns
StockMktDiff
1D———
2D———
3D———
5D———
10D———
results pending next close
 click to enlarge
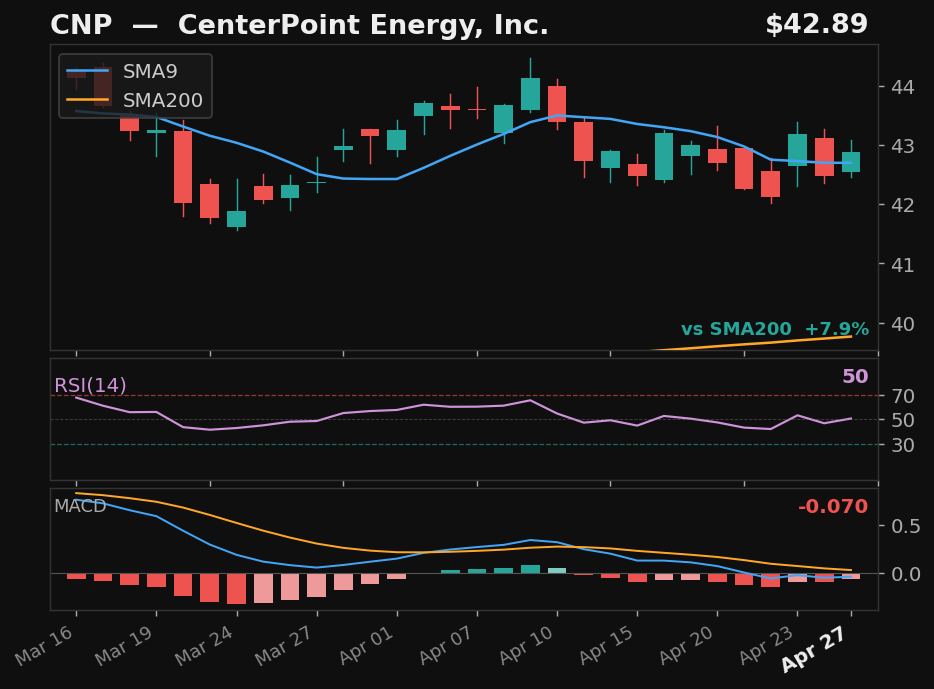
CNP
CenterPoint Energy, Inc.
NYSE
- 4.6% pullback to SMA9 over 10 days
- Crossed back above SMA9 today
- RSI at 51, rising
- MACD histogram improving
Base✓Strict✗Score75.0
Returns
StockMktDiff
1D———
2D———
3D———
5D———
10D———
results pending next close
 click to enlarge
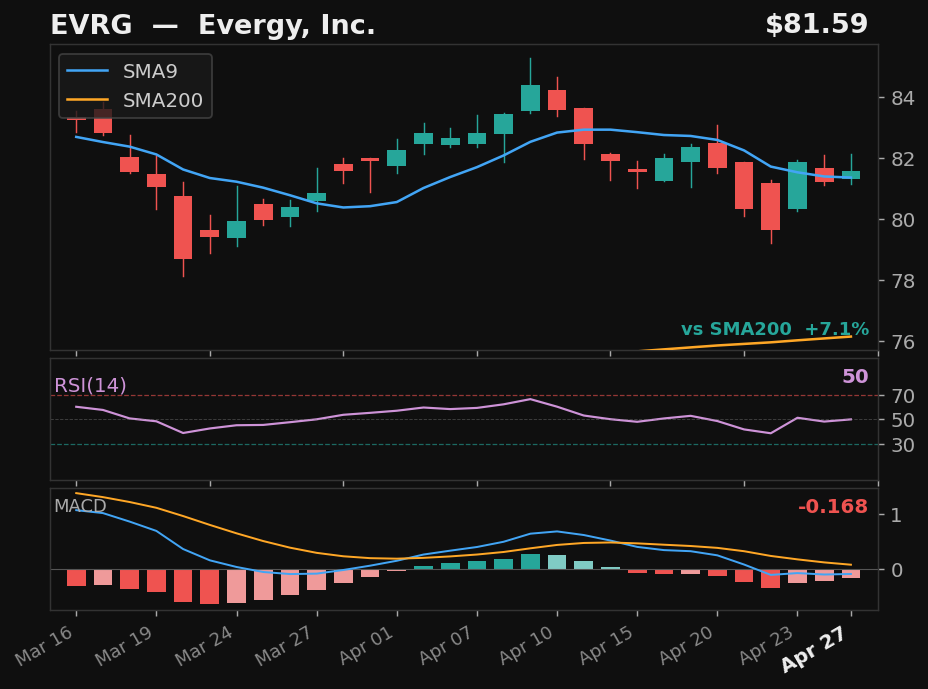
EVRG
Evergy, Inc.
NASDAQ
- 4.7% pullback to SMA9 over 9 days
- Crossed back above SMA9 today
- RSI at 50, rising
- MACD histogram improving
Base✓Strict✗Score73.0
Returns
StockMktDiff
1D———
2D———
3D———
5D———
10D———
results pending next close
 click to enlarge
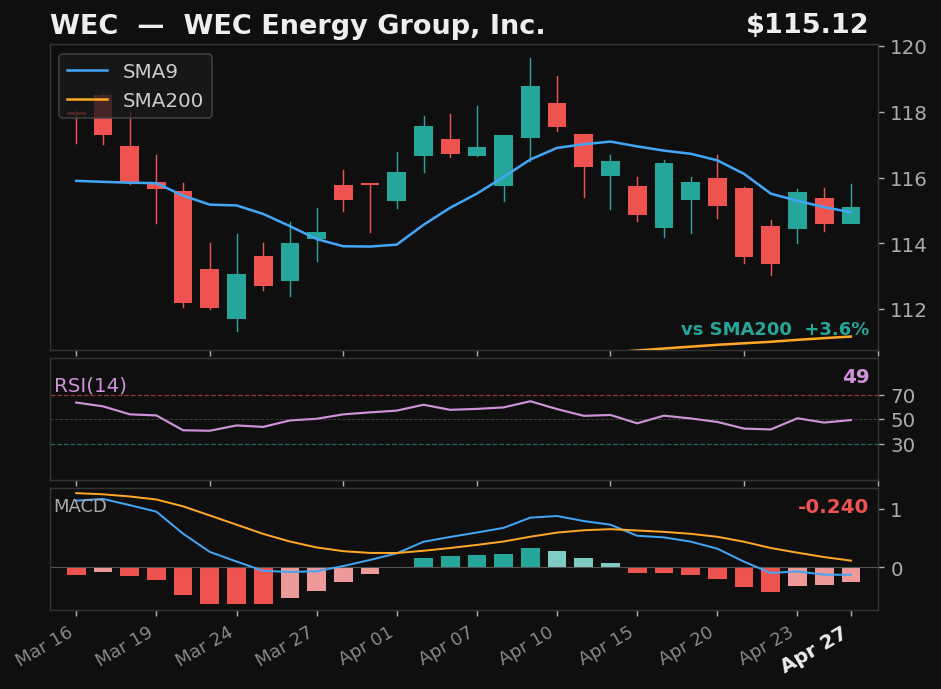
WEC
WEC Energy Group, Inc.
NYSE
- 3.5% pullback to SMA9 over 9 days
- Crossed back above SMA9 today
- RSI at 49, rising
- MACD histogram improving
Base✓Strict✗Score73.0
Returns
StockMktDiff
1D———
2D———
3D———
5D———
10D———
results pending next close
 click to enlarge
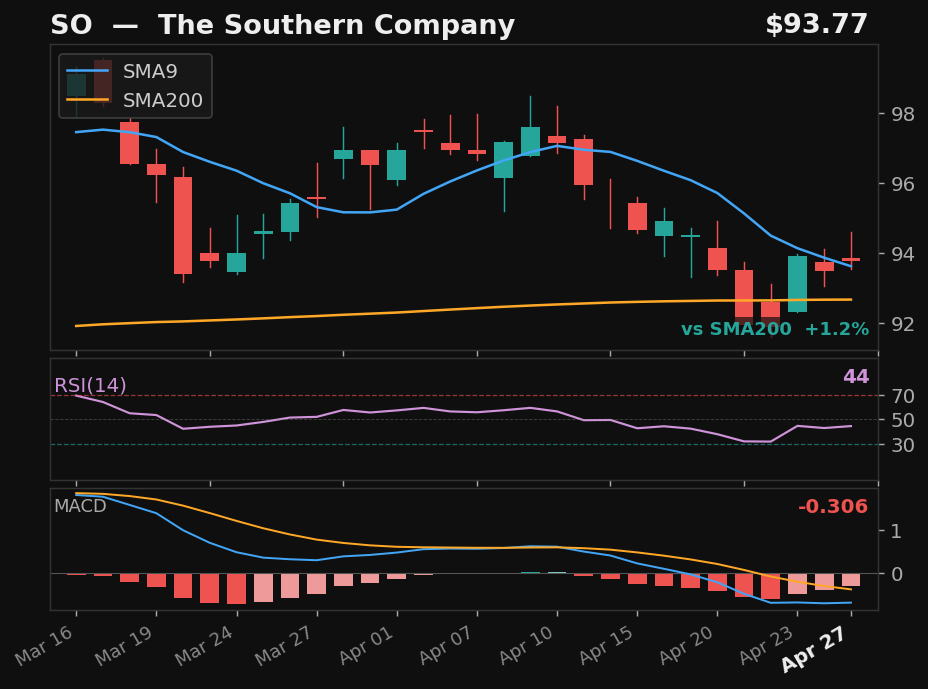
SO
The Southern Company
NYSE
- 5.4% pullback to SMA9 over 10 days
- Crossed back above SMA9 today
- RSI at 45, rising
- MACD histogram improving
Base✓Strict✗Score67.0
Returns
StockMktDiff
1D———
2D———
3D———
5D———
10D———
results pending next close
 click to enlarge
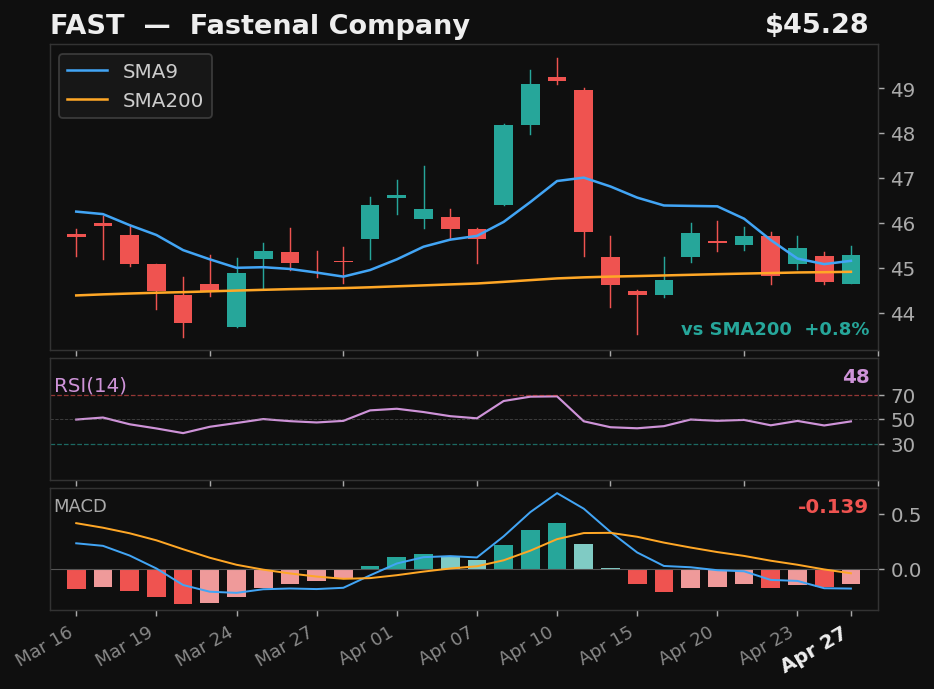
FAST
Fastenal Company
NASDAQ
- 9.7% pullback to SMA9 over 9 days
- Crossed back above SMA9 today
- RSI at 48, rising
- MACD histogram improving
Base✓Strict✗Score64.0
Returns
StockMktDiff
1D———
2D———
3D———
5D———
10D———
results pending next close
 click to enlarge
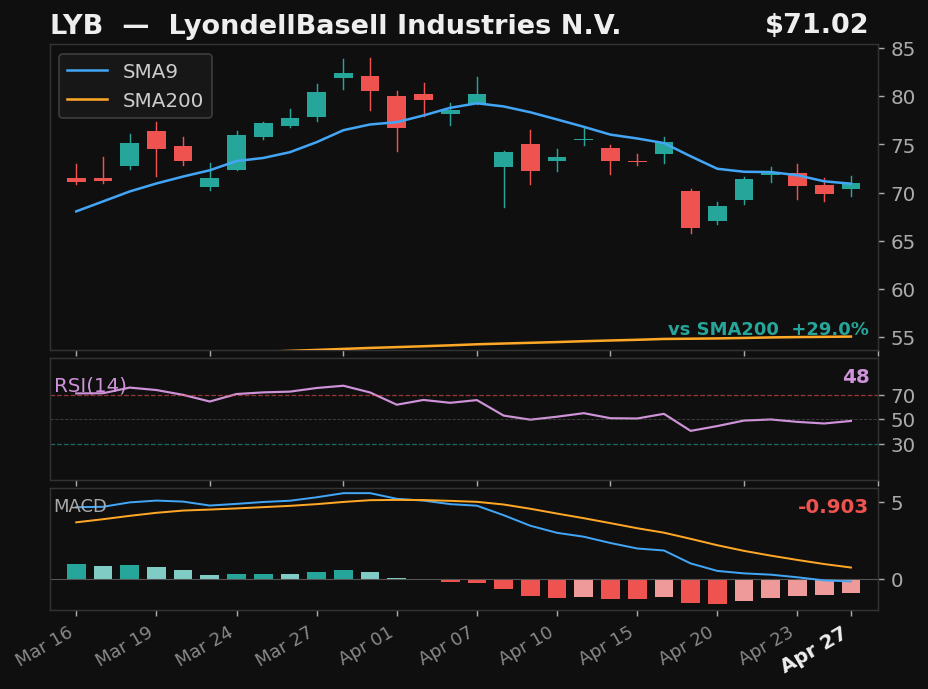
LYB
LyondellBasell Industries N.V.
NYSE
- 17.4% pullback to SMA9 over 13 days
- Crossed back above SMA9 today
- RSI at 48, rising
- MACD histogram improving
Base✓Strict✗Score57.0
Returns
StockMktDiff
1D———
2D———
3D———
5D———
10D———
results pending next close