Friday, April 24, 2026 · After Close
★ Highlights
1
▼
 click to enlarge
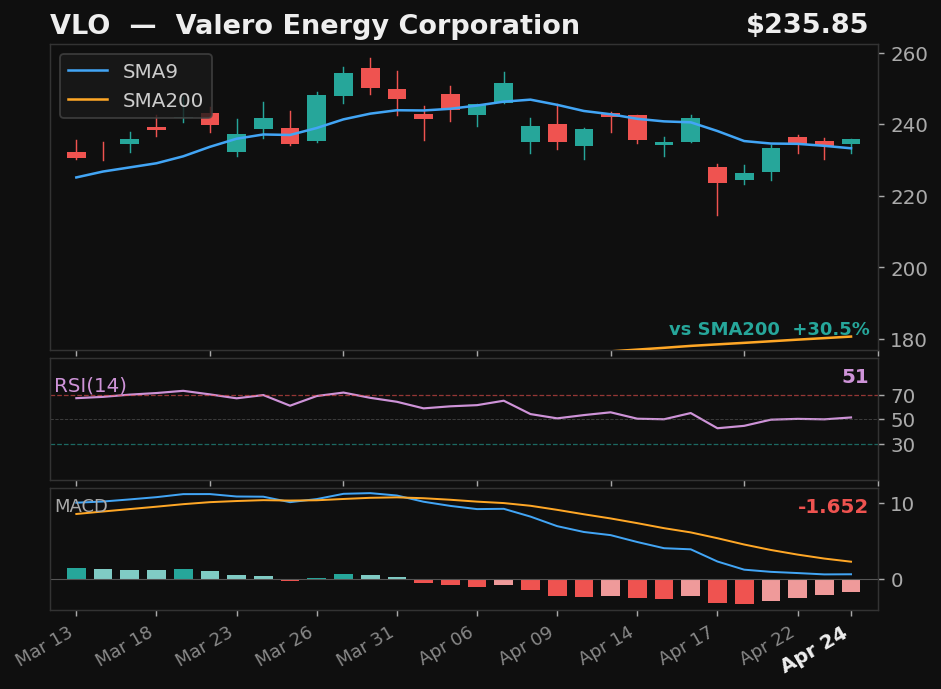
VLO★
Valero Energy Corporation
NYSE
- 11.1% pullback to SMA9 over 13 days
- Crossed back above SMA9 today
- RSI at 51, rising
- MACD histogram improving
Returns
StockMktDiff
1D+1.0%+0.2%+0.8%
2D———
3D———
5D———
10D———
Empirical V1
5
▼
 click to enlarge
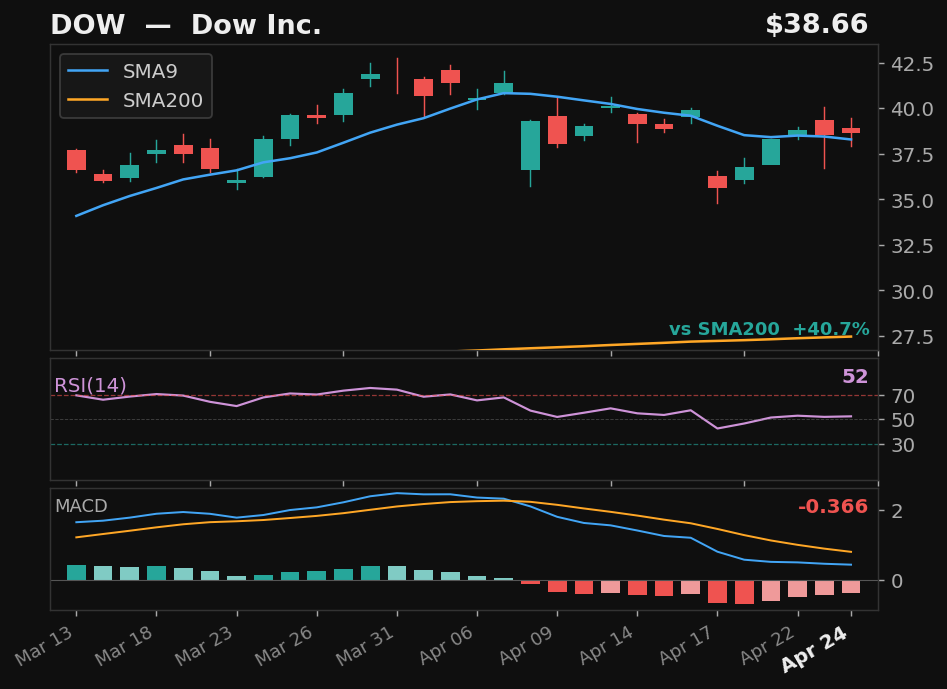
DOW
Dow Inc.
NYSE
- 14.0% pullback — full candle body above SMA9
- RSI at 52, rising above 50
- MACD histogram rising while still negative — early recovery signal
- 40.7% above SMA200 — extended from trend
Emp Score46.3Body Above✓
Returns
StockMktDiff
1D-1.4%+0.2%-1.6%
2D———
3D———
5D———
10D———
 click to enlarge
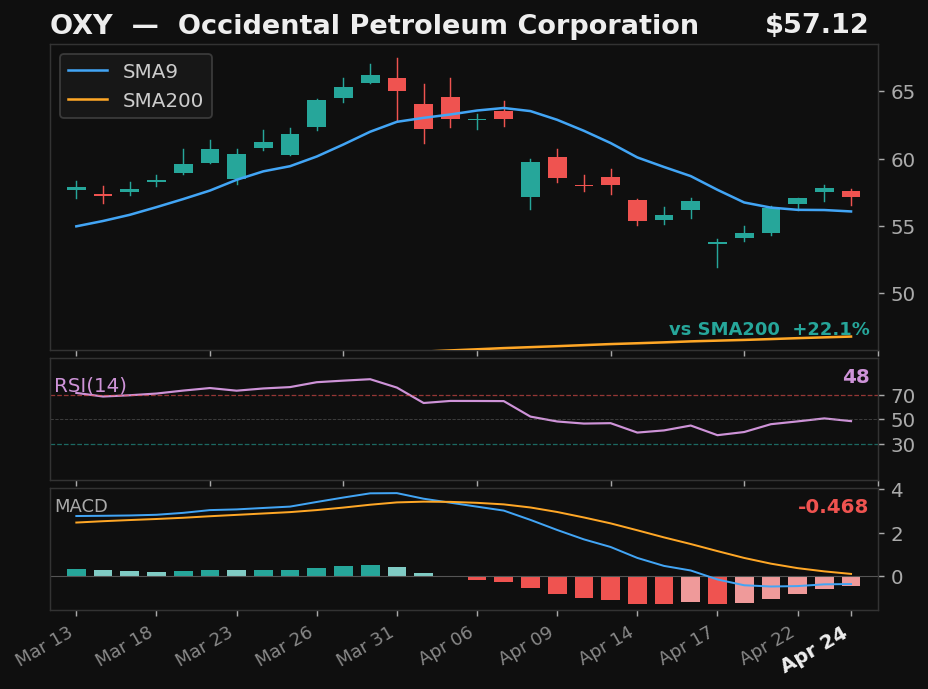
OXY
Occidental Petroleum Corporation
NYSE
- 17.2% pullback — full candle body above SMA9
- MACD histogram rising while still negative — early recovery signal
- 22.1% above SMA200 — extended from trend
Emp Score44.1Body Above✓
Returns
StockMktDiff
1D+0.3%+0.2%+0.1%
2D———
3D———
5D———
10D———
 click to enlarge
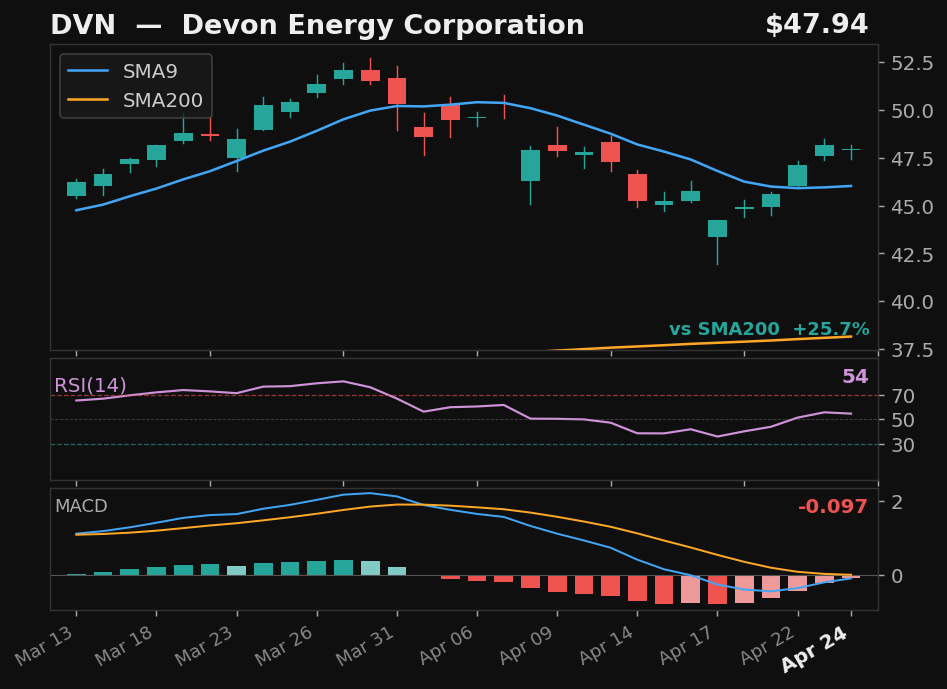
DVN
Devon Energy Corporation
NYSE
- 12.1% pullback — full candle body above SMA9
- MACD histogram rising while still negative — early recovery signal
- 25.7% above SMA200 — extended from trend
Emp Score37.9Body Above✓
Returns
StockMktDiff
1D+0.5%+0.2%+0.4%
2D———
3D———
5D———
10D———
 click to enlarge
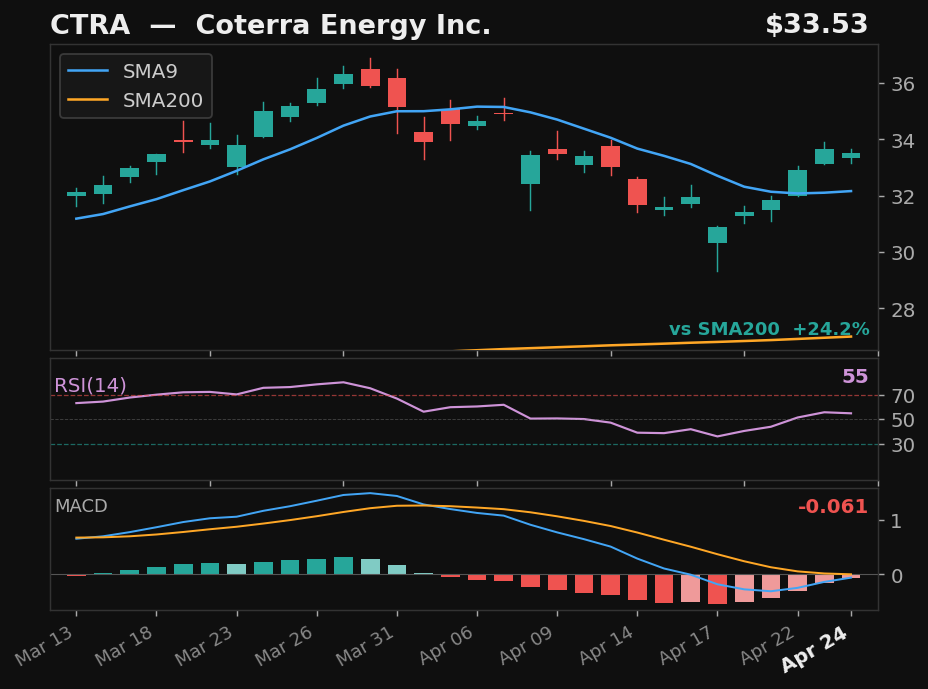
CTRA
Coterra Energy Inc.
NYSE
- 12.1% pullback — full candle body above SMA9
- MACD histogram rising while still negative — early recovery signal
- 24.2% above SMA200 — extended from trend
Emp Score37.4Body Above✓
Returns
StockMktDiff
1D+0.4%+0.2%+0.2%
2D———
3D———
5D———
10D———
click to enlarge
VLO★
Valero Energy Corporation
NYSE
- 11.1% pullback over 5 days — full candle above SMA9
- RSI at 51, rising above 50
- MACD histogram rising while still negative — early recovery signal
- 30.5% above SMA200 — extended from trend
Emp Score37.3Body Above✓
Returns
StockMktDiff
1D+1.0%+0.2%+0.8%
2D———
3D———
5D———
10D———
SwingTrader Setups
9
▼
 click to enlarge
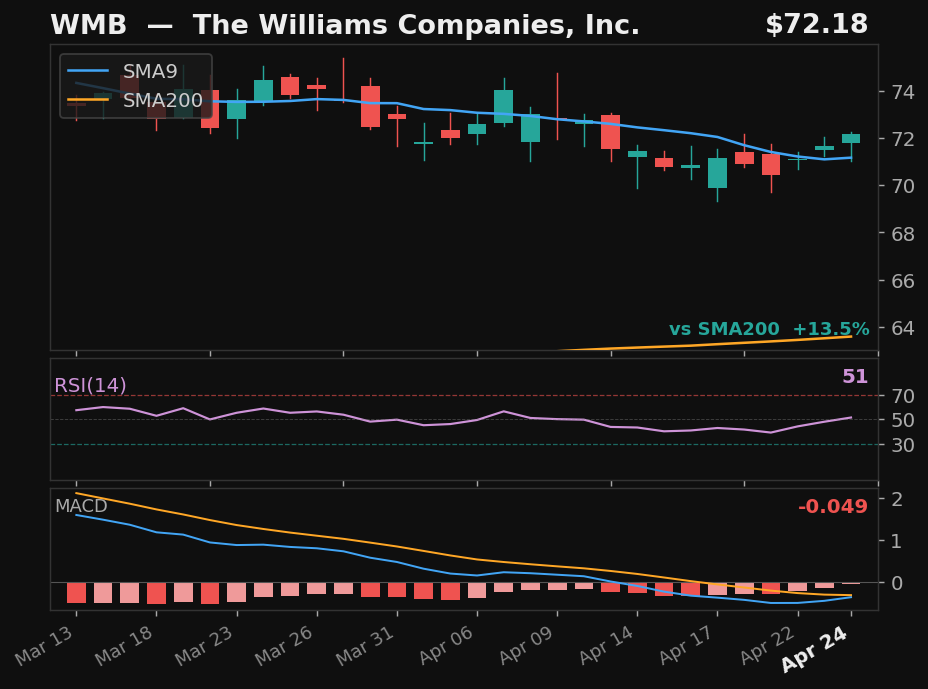
WMB
The Williams Companies, Inc.
NYSE
- 3.3% pullback to SMA9 over 8 days
- Crossed above SMA9 — 2 days above
- RSI at 51, rising
- MACD histogram improving
Base✓Strict✓Score84.0
Returns
StockMktDiff
1D-0.8%+0.2%-1.0%
2D———
3D———
5D———
10D———
click to enlarge
VLO★
Valero Energy Corporation
NYSE
- 11.1% pullback to SMA9 over 13 days
- Crossed back above SMA9 today
- RSI at 51, rising
- MACD histogram improving
Base✓Strict✓Score82.0
Returns
StockMktDiff
1D+1.0%+0.2%+0.8%
2D———
3D———
5D———
10D———
 click to enlarge
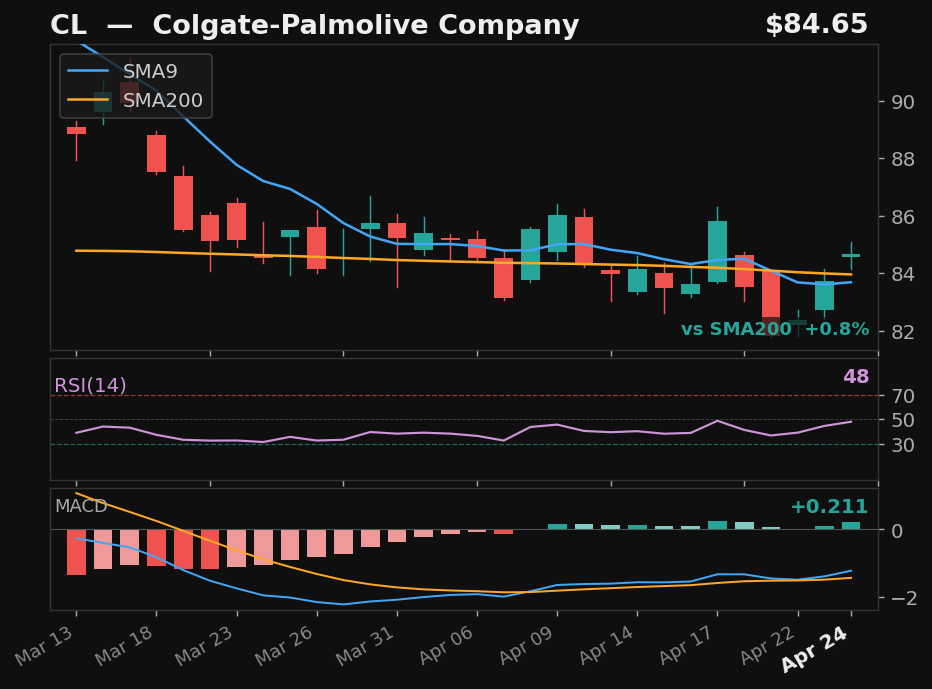
CL
Colgate-Palmolive Company
NYSE
- 4.9% pullback to SMA9 over 10 days
- Crossed above SMA9 — 2 days above
- RSI at 48, rising
- MACD momentum building
Base✓Strict✓Score80.0
Returns
StockMktDiff
1D-0.6%+0.2%-0.7%
2D———
3D———
5D———
10D———
 click to enlarge
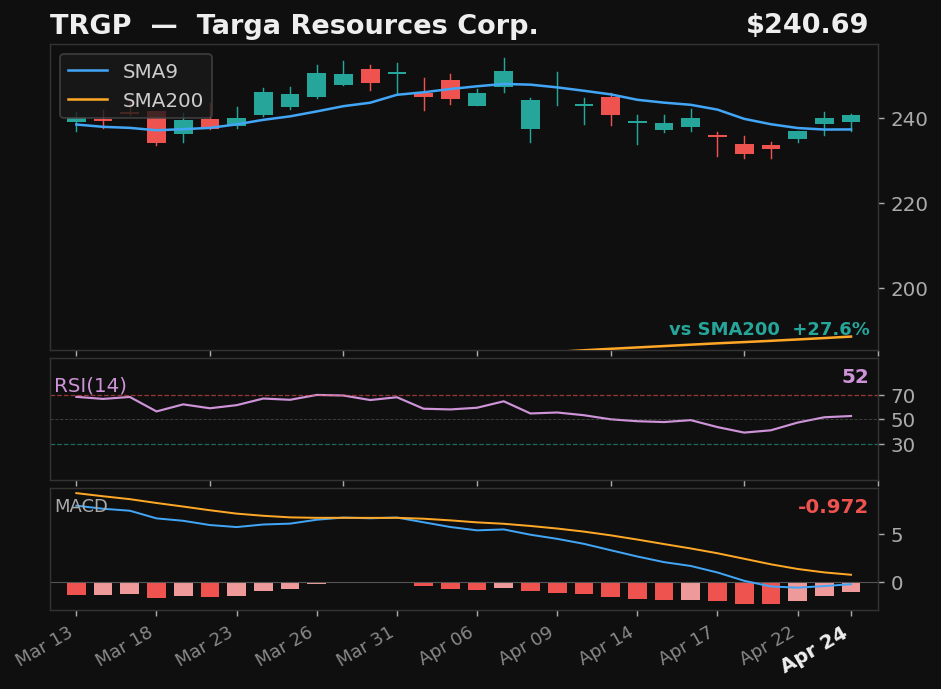
TRGP
Targa Resources Corp.
NYSE
- 7.8% pullback to SMA9 over 14 days
- Crossed above SMA9 — 2 days above
- RSI at 52, rising
- MACD histogram improving
Base✓Strict✓Score78.0
Returns
StockMktDiff
1D+0.2%+0.2%+0.1%
2D———
3D———
5D———
10D———
 click to enlarge
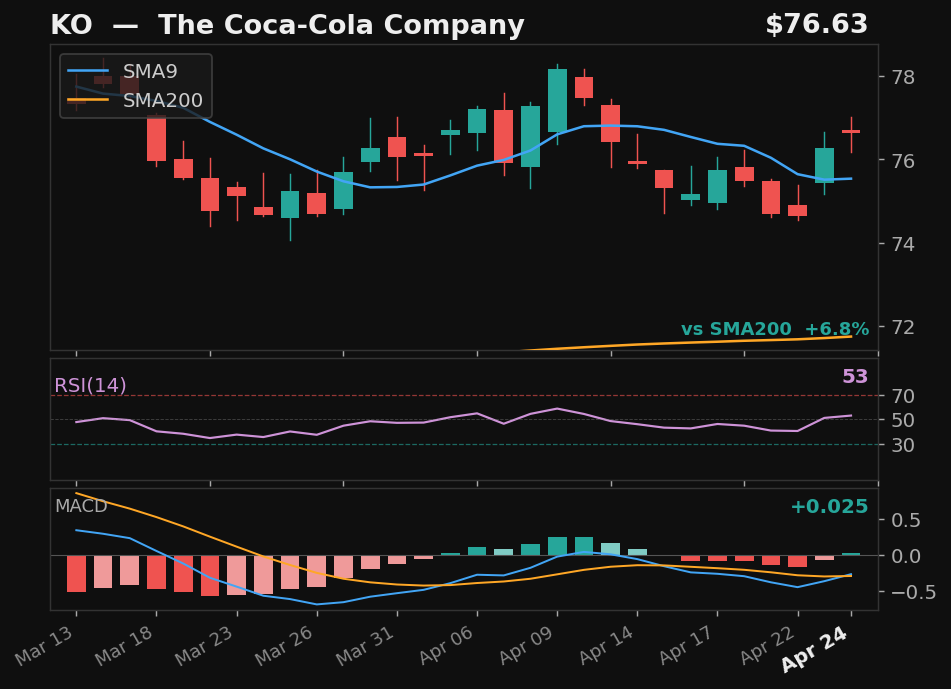
KO
The Coca-Cola Company
NYSE
- 3.7% pullback to SMA9 over 8 days
- Crossed above SMA9 — 2 days above
- RSI at 53, rising
- MACD histogram improving
Base✓Strict✗Score73.0
Returns
StockMktDiff
1D-1.6%+0.2%-1.7%
2D———
3D———
5D———
10D———
 click to enlarge
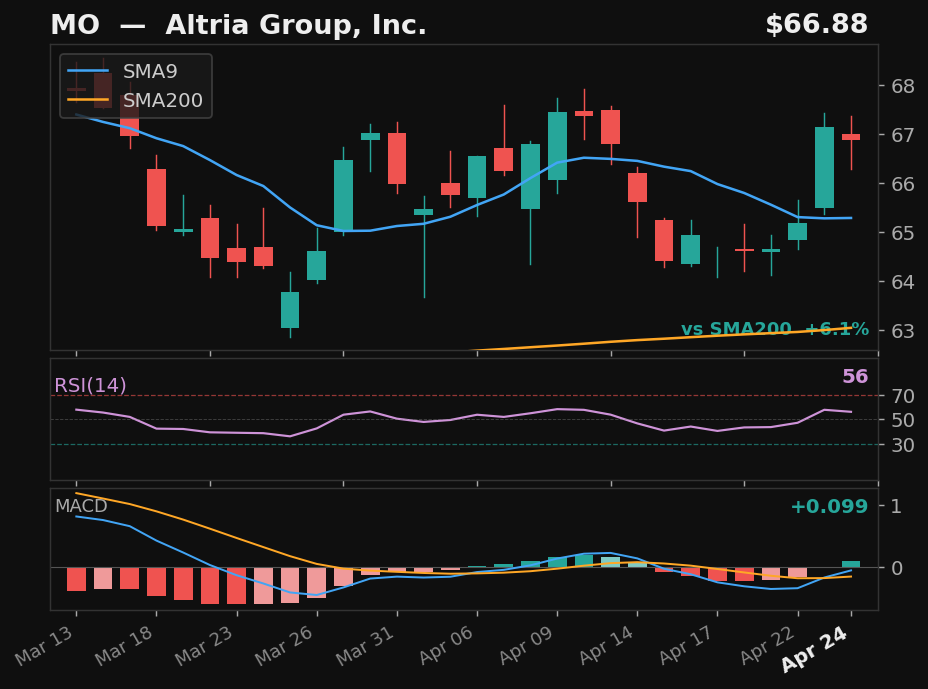
MO
Altria Group, Inc.
NYSE
- 4.0% pullback to SMA9 over 7 days
- Crossed above SMA9 — 2 days above
- MACD bullish cross 1 day ago
Base✓Strict✗Score67.0
Returns
StockMktDiff
1D-1.3%+0.2%-1.5%
2D———
3D———
5D———
10D———
 click to enlarge
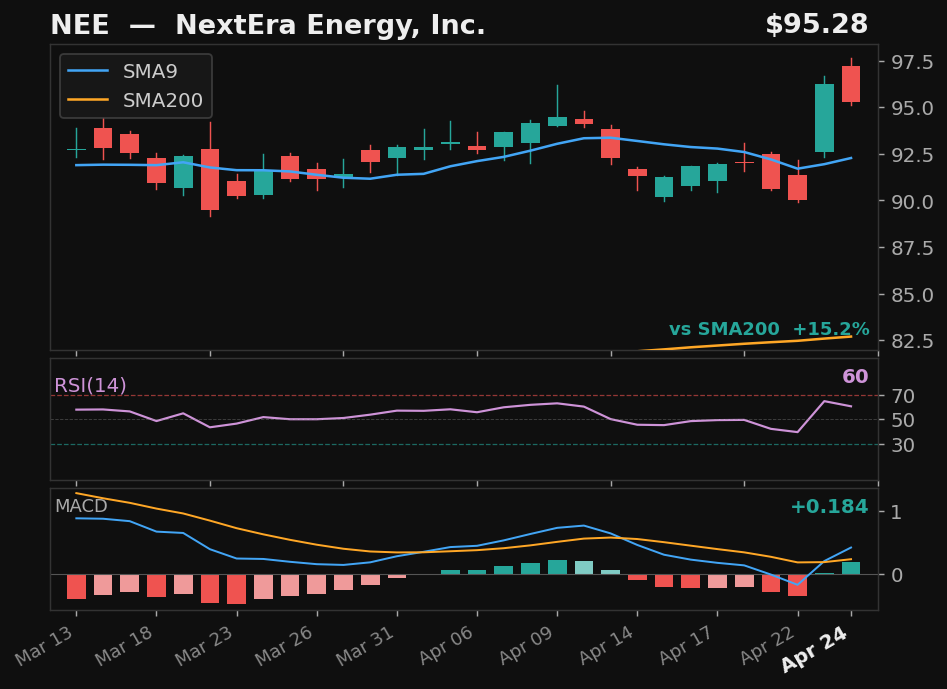
NEE
NextEra Energy, Inc.
NYSE
- 4.3% pullback to SMA9 over 8 days
- Crossed above SMA9 — 2 days above
- MACD bullish cross 1 day ago
- Long-term uptrend intact
Base✓Strict✗Score67.0
Returns
StockMktDiff
1D-0.5%+0.2%-0.6%
2D———
3D———
5D———
10D———
 click to enlarge
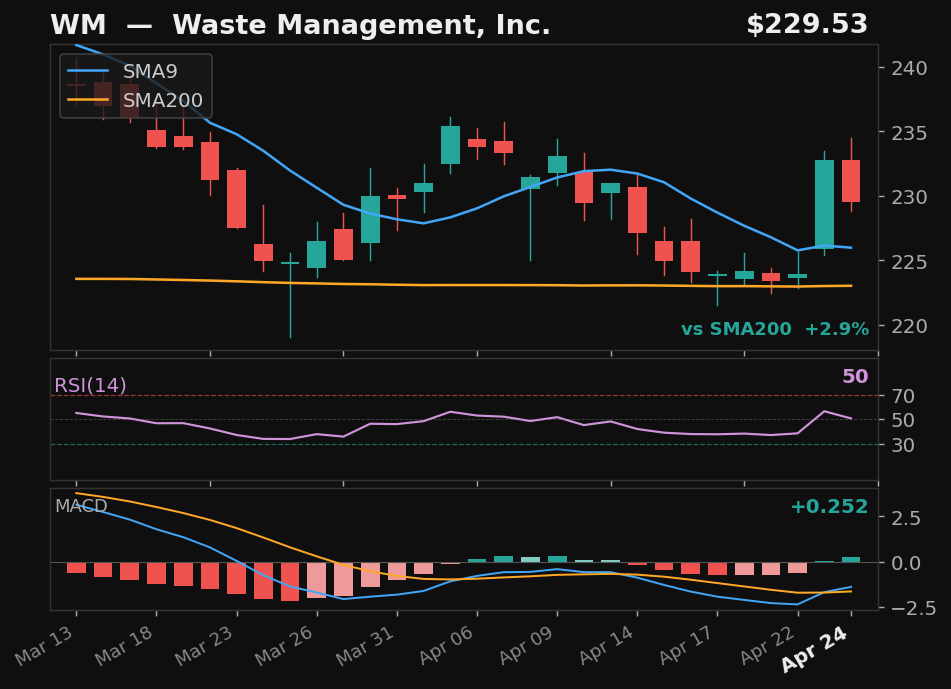
WM
Waste Management, Inc.
NYSE
- 4.2% pullback to SMA9 over 9 days
- Crossed above SMA9 — 2 days above
- MACD bullish cross 1 day ago
Base✓Strict✗Score66.0
Returns
StockMktDiff
1D-1.5%+0.2%-1.6%
2D———
3D———
5D———
10D———
 click to enlarge
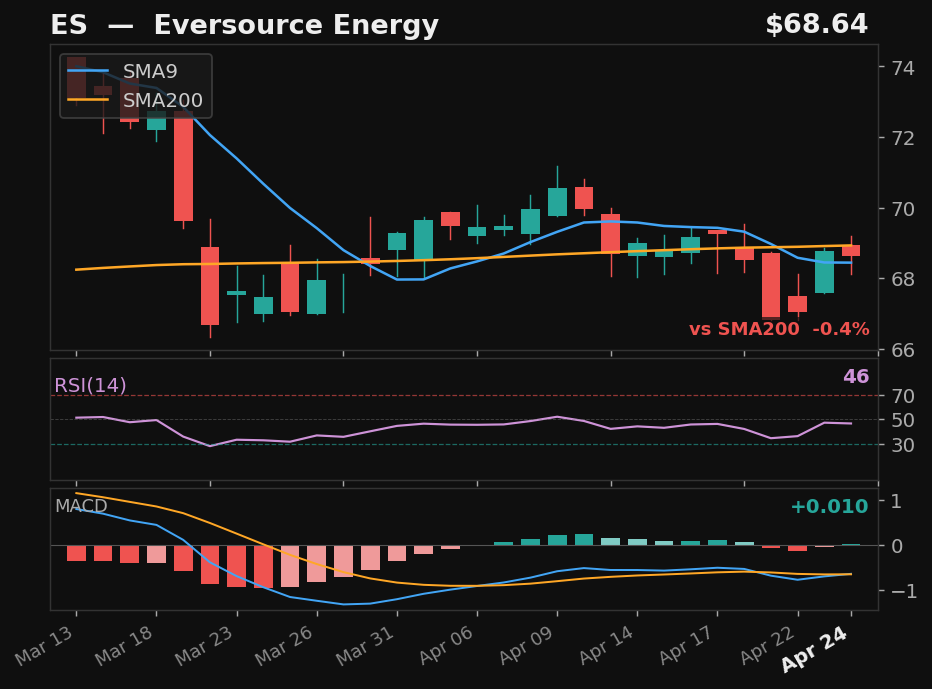
ES
Eversource Energy
NYSE
- 4.5% pullback to SMA9 over 8 days
- Crossed above SMA9 — 2 days above
- MACD histogram improving
Base✓Strict✗Score65.0
Returns
StockMktDiff
1D+0.1%+0.2%-0.1%
2D———
3D———
5D———
10D———