Tuesday, April 28, 2026 · After Close
★ Highlights
1
▼
 click to enlarge
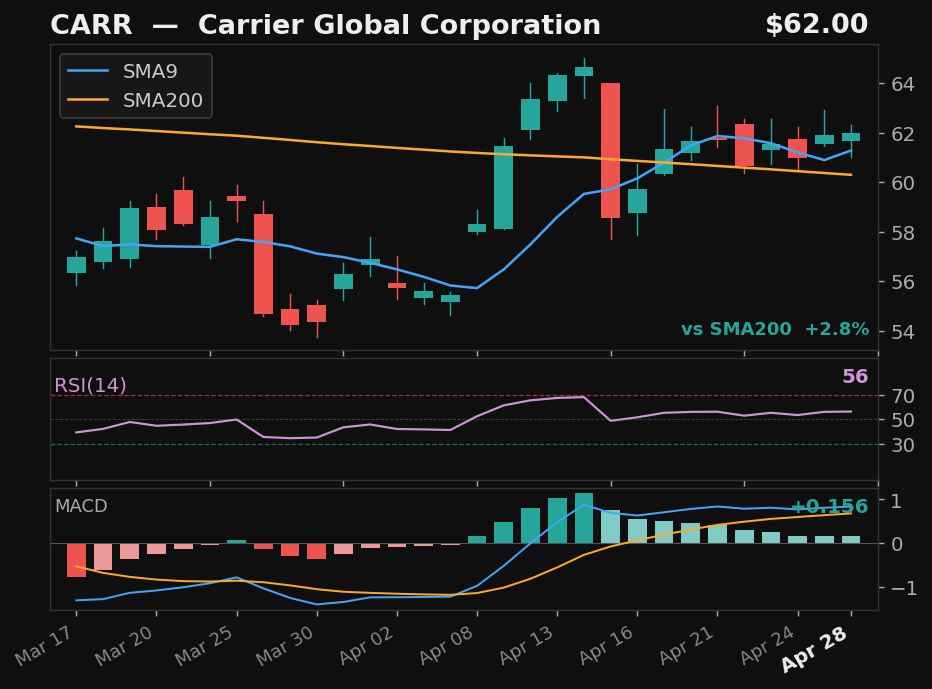
CARR★
Carrier Global Corporation
NYSE
- 9.4% pullback — full candle body above SMA9
- RSI at 55 — confirmed recovery momentum
Returns
StockMktDiff
1D———
2D———
3D———
5D———
10D———
results pending next close
Explosive Up Setups
1
▼
click to enlarge
CARR★
Carrier Global Corporation
NYSE
- 9.4% pullback — 6 days below SMA9
- Prior rally: 10%
- Above SMA200 (3%)
Exp Score41Days Below6Pullback%9.4
Returns
StockMktDiff
1D———
2D———
3D———
5D———
10D———
results pending next close
Empirical V1
5
▼
 click to enlarge
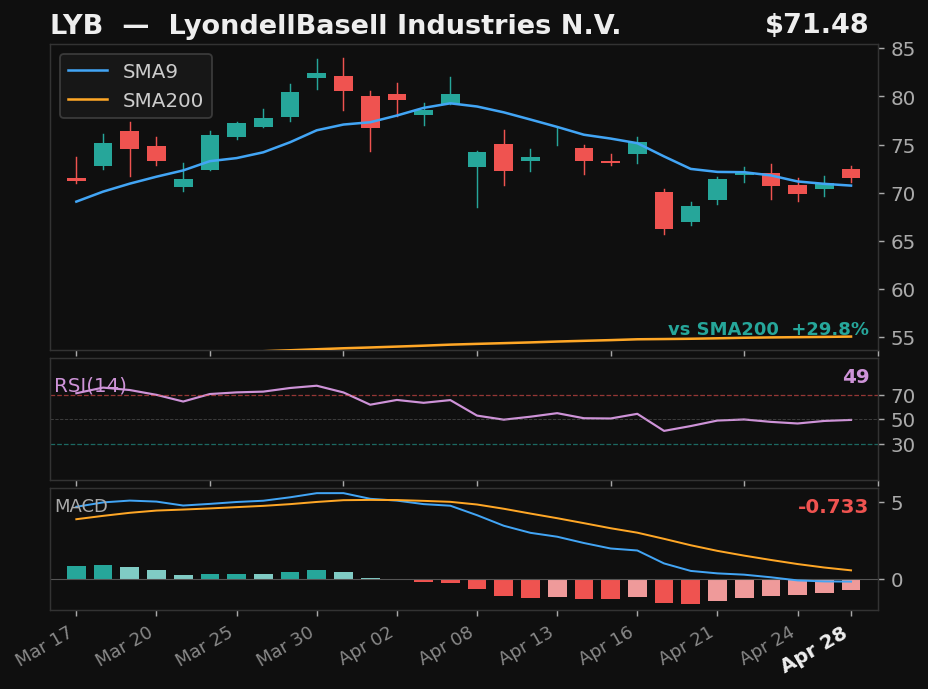
LYB
LyondellBasell Industries N.V.
NYSE
- 17.4% pullback — full candle body above SMA9
- RSI rising from 49
- MACD histogram rising while still negative — early recovery signal
- 29.8% above SMA200 — extended from trend
Emp Score46.8Body Above✓
Returns
StockMktDiff
1D———
2D———
3D———
5D———
10D———
results pending next close
 click to enlarge
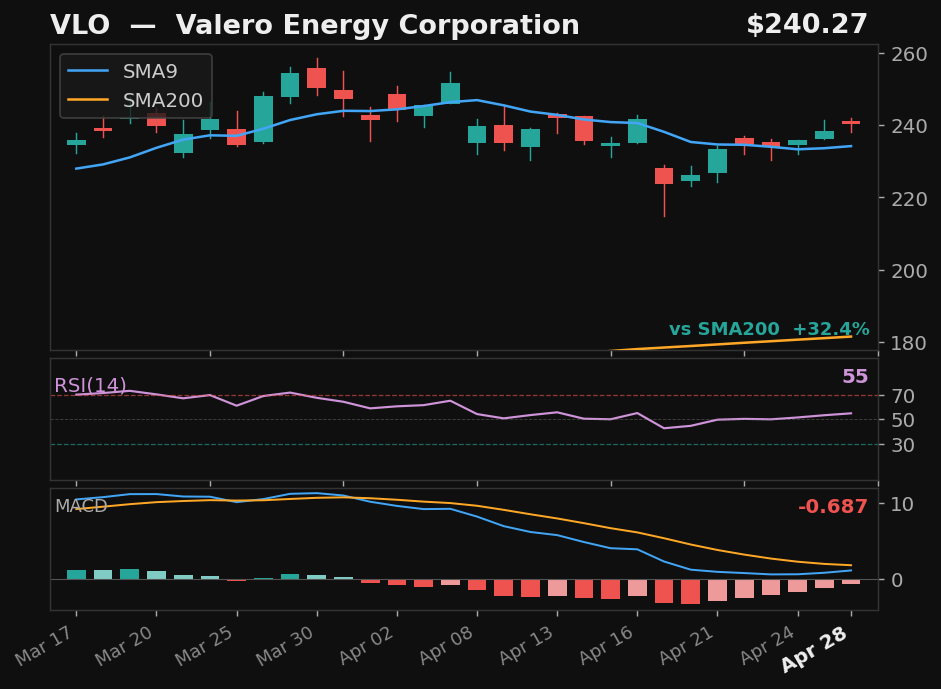
VLO
Valero Energy Corporation
NYSE
- 11.1% pullback — full candle body above SMA9
- RSI at 55, rising above 50
- MACD histogram rising while still negative — early recovery signal
- 32.4% above SMA200 — extended from trend
Emp Score37.9Body Above✓
Returns
StockMktDiff
1D———
2D———
3D———
5D———
10D———
results pending next close
 click to enlarge
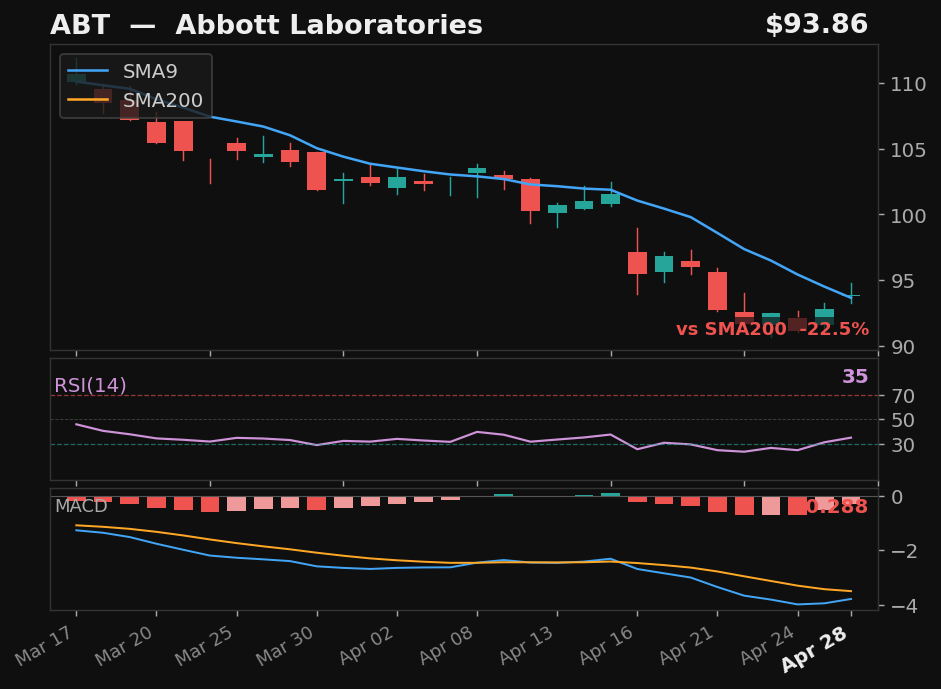
ABT
Abbott Laboratories
NYSE
- 11.3% pullback over 12 days — full candle above SMA9
- RSI rising from 35
- MACD histogram rising while still negative — early recovery signal
- 22.5% below SMA200 — extended from trend
Emp Score32.3Body Above✓
Returns
StockMktDiff
1D———
2D———
3D———
5D———
10D———
results pending next close
click to enlarge
CARR★
Carrier Global Corporation
NYSE
- 9.4% pullback — full candle body above SMA9
- RSI at 55 — confirmed recovery momentum
Emp Score24.8Body Above✓
Returns
StockMktDiff
1D———
2D———
3D———
5D———
10D———
results pending next close
 click to enlarge
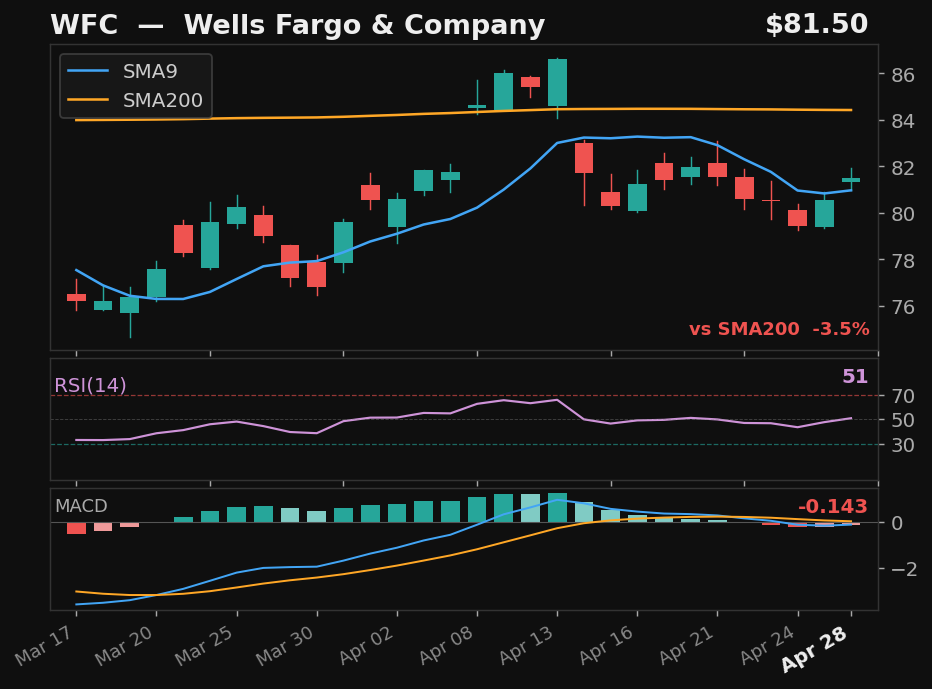
WFC
Wells Fargo & Company
NYSE
- 8.3% pullback over 10 days — full candle above SMA9
- RSI at 51, rising above 50
- MACD histogram rising while still negative — early recovery signal
Emp Score23.7Body Above✓
Returns
StockMktDiff
1D———
2D———
3D———
5D———
10D———
results pending next close
SwingTrader Setups
10
▼
 click to enlarge
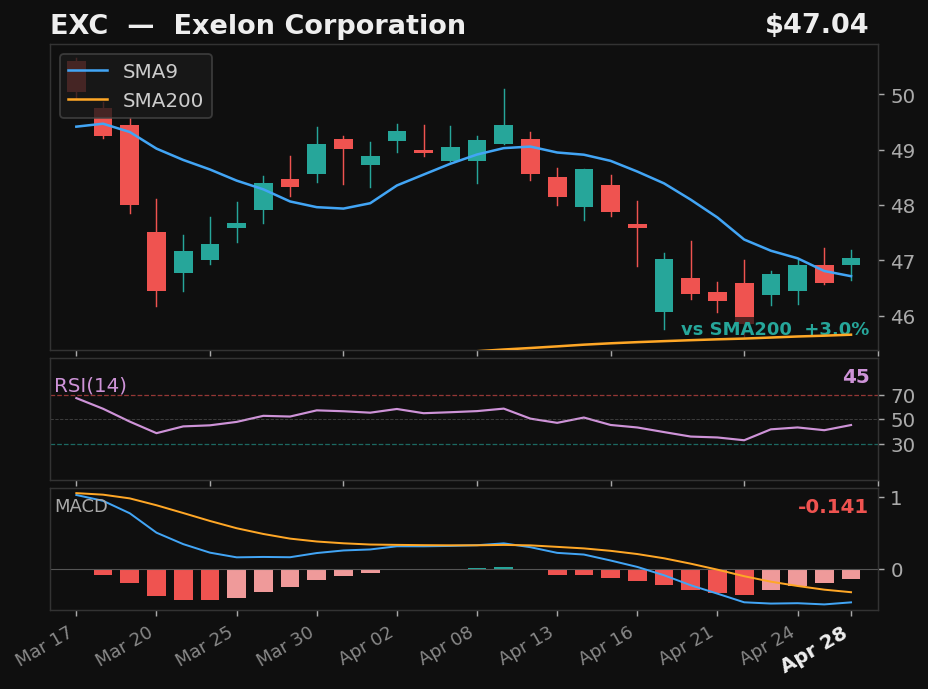
EXC
Exelon Corporation
NASDAQ
- 7.2% pullback to SMA9 over 12 days
- Crossed back above SMA9 today
- RSI rising from 45 — recovering momentum
- MACD histogram improving
Base✓Strict✓Score78.0
Returns
StockMktDiff
1D———
2D———
3D———
5D———
10D———
results pending next close
 click to enlarge
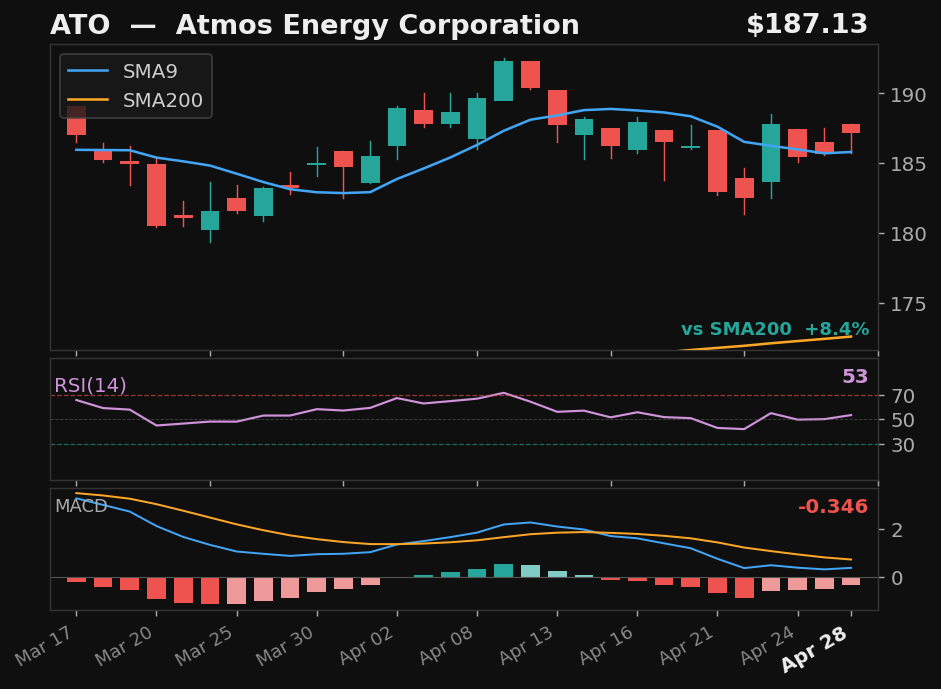
ATO
Atmos Energy Corporation
NYSE
- 4.1% pullback to SMA9 over 10 days
- Crossed back above SMA9 today
- RSI at 53, rising
- MACD histogram improving
Base✓Strict✗Score75.0
Returns
StockMktDiff
1D———
2D———
3D———
5D———
10D———
results pending next close
 click to enlarge
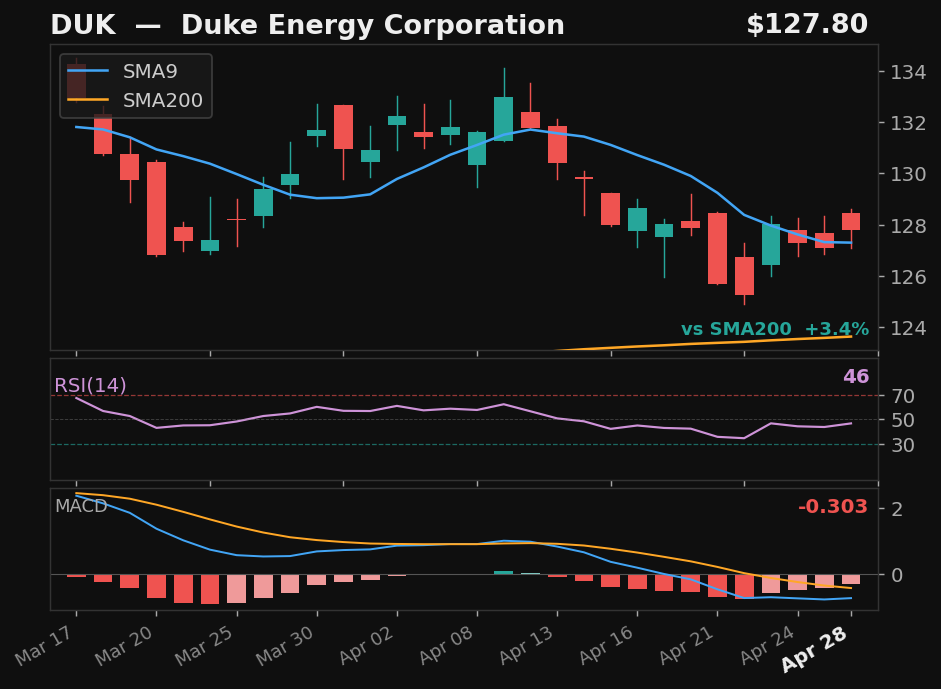
DUK
Duke Energy Corporation
NYSE
- 5.0% pullback to SMA9 over 10 days
- Crossed back above SMA9 today
- RSI at 46, rising
- MACD histogram improving
Base✓Strict✗Score73.0
Returns
StockMktDiff
1D———
2D———
3D———
5D———
10D———
results pending next close
 click to enlarge
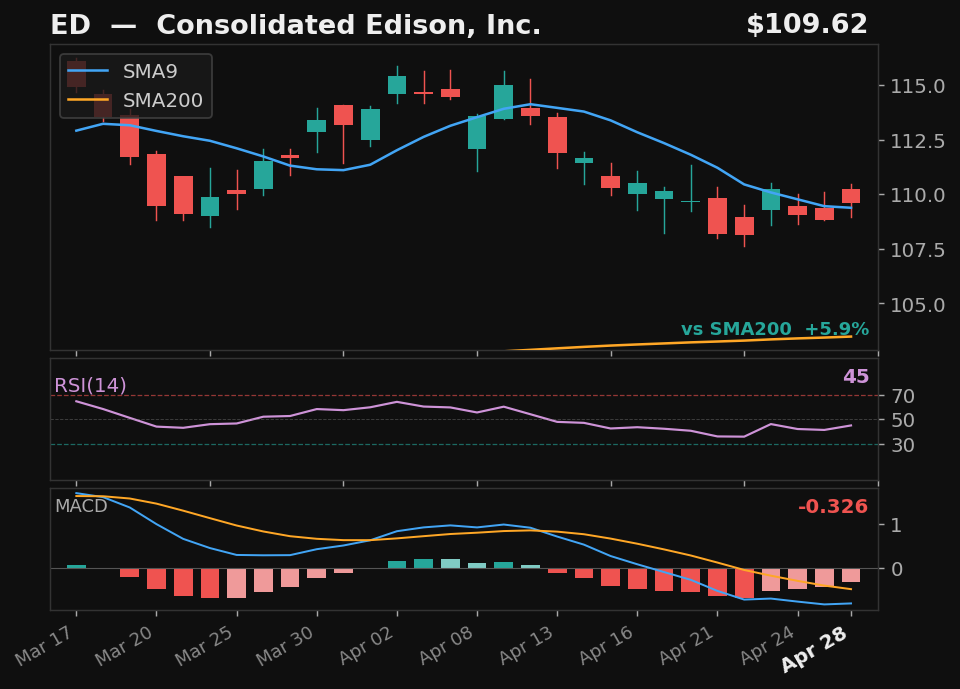
ED
Consolidated Edison, Inc.
NYSE
- 6.0% pullback to SMA9 over 11 days
- Crossed back above SMA9 today
- RSI rising from 44 — recovering momentum
- MACD histogram improving
Base✓Strict✗Score73.0
Returns
StockMktDiff
1D———
2D———
3D———
5D———
10D———
results pending next close
 click to enlarge
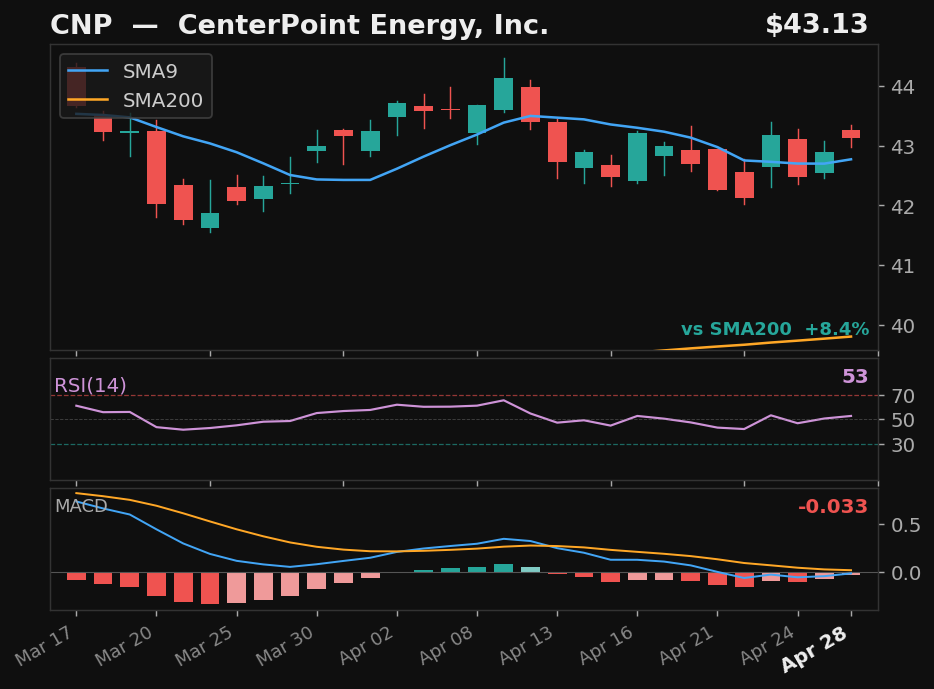
CNP
CenterPoint Energy, Inc.
NYSE
- 4.6% pullback to SMA9 over 10 days
- Crossed above SMA9 — 2 days above
- RSI at 53, rising
- MACD histogram improving
Base✓Strict✗Score69.0
Returns
StockMktDiff
1D———
2D———
3D———
5D———
10D———
results pending next close
 click to enlarge
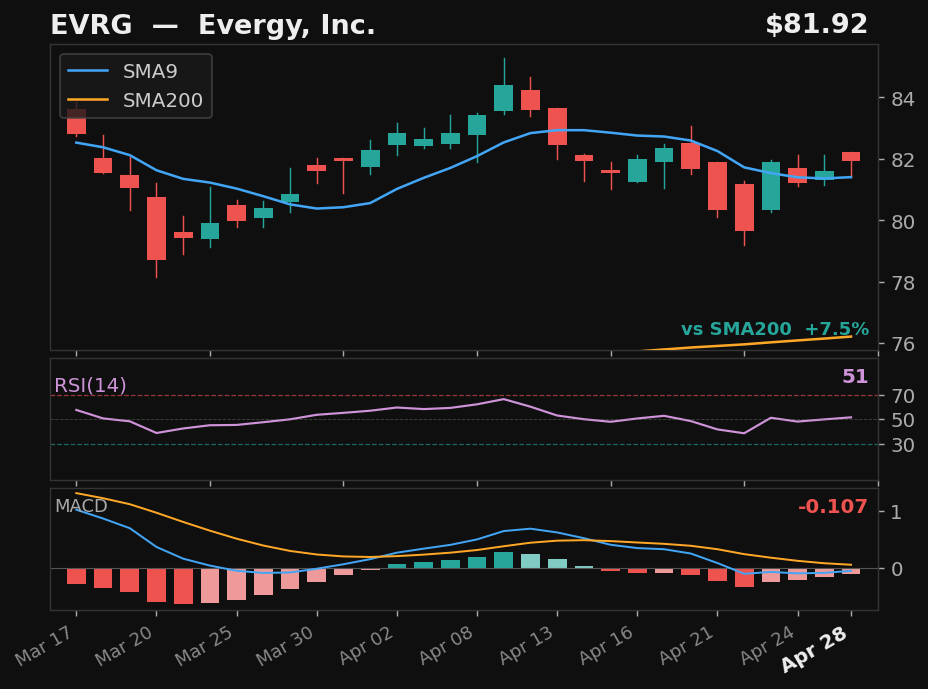
EVRG
Evergy, Inc.
NASDAQ
- 4.7% pullback to SMA9 over 9 days
- Crossed above SMA9 — 2 days above
- RSI at 51, rising
- MACD histogram improving
Base✓Strict✗Score69.0
Returns
StockMktDiff
1D———
2D———
3D———
5D———
10D———
results pending next close
 click to enlarge
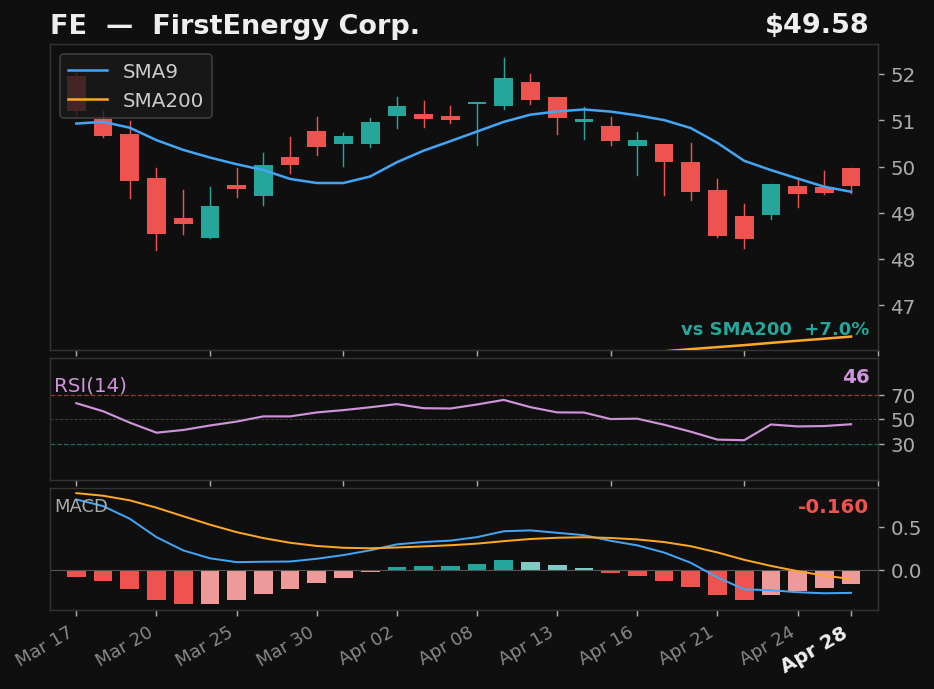
FE
FirstEnergy Corp.
NYSE
- 5.8% pullback to SMA9 over 11 days
- Crossed back above SMA9 today
- RSI at 46, rising
- MACD histogram improving
Base✓Strict✗Score69.0
Returns
StockMktDiff
1D———
2D———
3D———
5D———
10D———
results pending next close
 click to enlarge
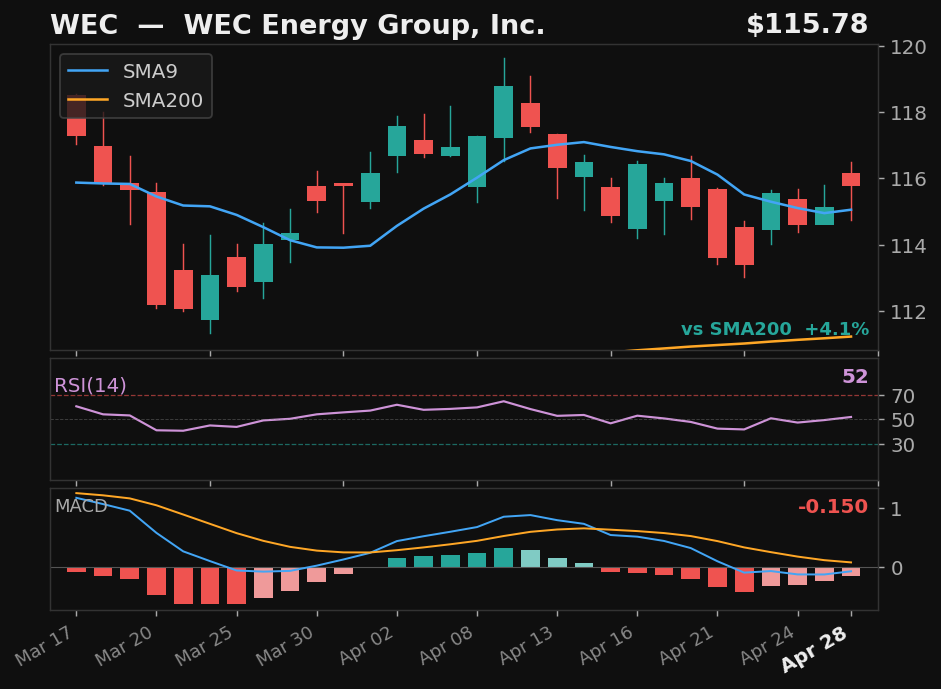
WEC
WEC Energy Group, Inc.
NYSE
- 3.5% pullback to SMA9 over 9 days
- Crossed above SMA9 — 2 days above
- RSI at 52, rising
- MACD histogram improving
Base✓Strict✗Score69.0
Returns
StockMktDiff
1D———
2D———
3D———
5D———
10D———
results pending next close
 click to enlarge
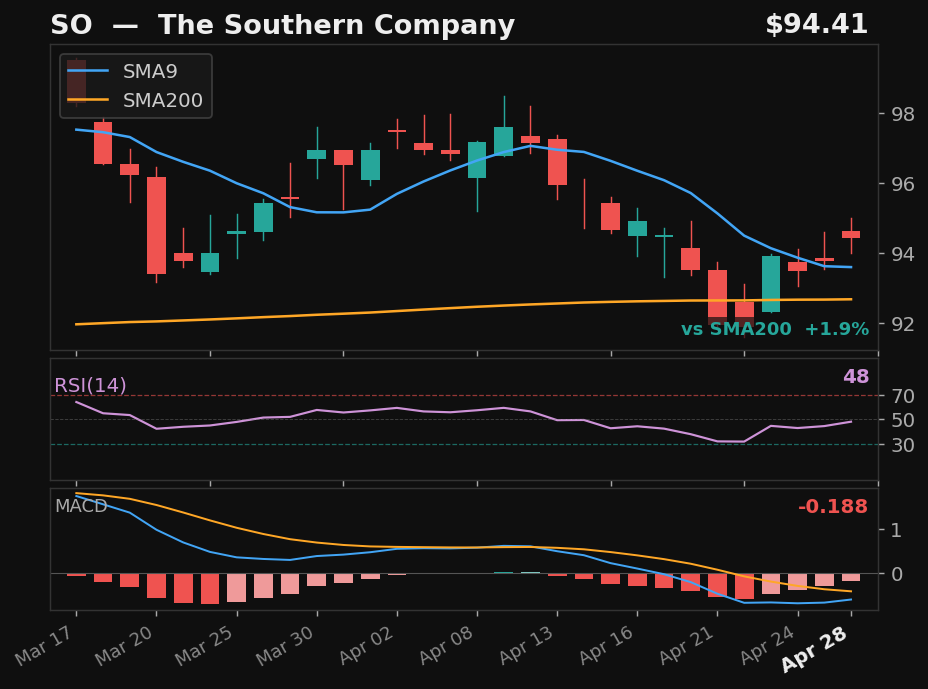
SO
The Southern Company
NYSE
- 5.4% pullback to SMA9 over 10 days
- Crossed above SMA9 — 2 days above
- RSI at 48, rising
- MACD histogram improving
Base✓Strict✗Score66.0
Returns
StockMktDiff
1D———
2D———
3D———
5D———
10D———
results pending next close
 click to enlarge
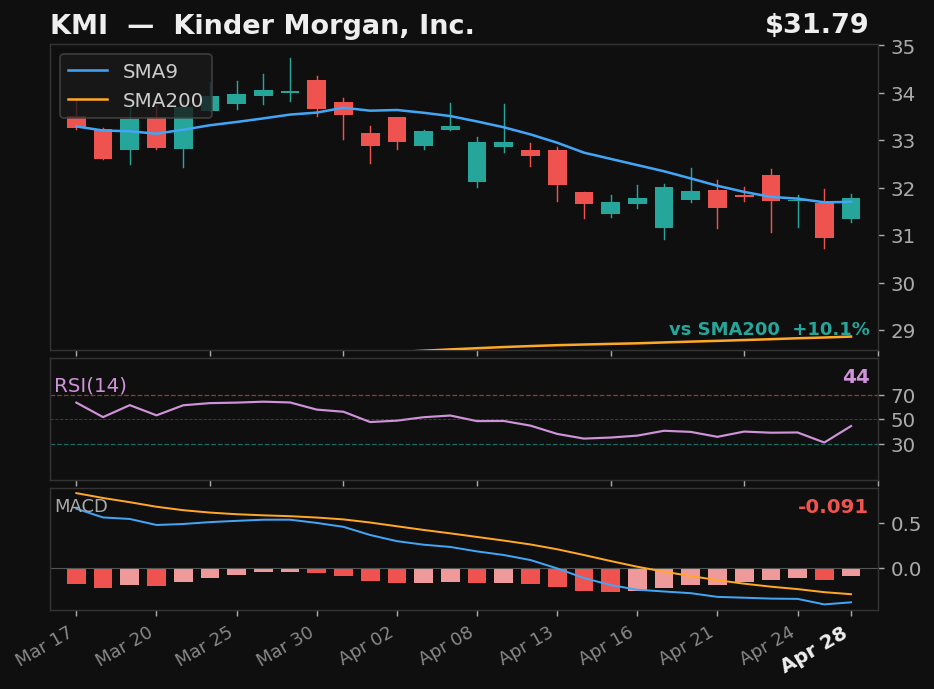
KMI
Kinder Morgan, Inc.
NYSE
- 8.0% pullback to SMA9 over 19 days
- Crossed back above SMA9 today
- RSI rising from 44 — recovering momentum
- MACD histogram improving
Base✓Strict✗Score59.0
Returns
StockMktDiff
1D———
2D———
3D———
5D———
10D———
results pending next close