Monday, May 4, 2026 · After Close
★ Highlights2
 click to enlarge
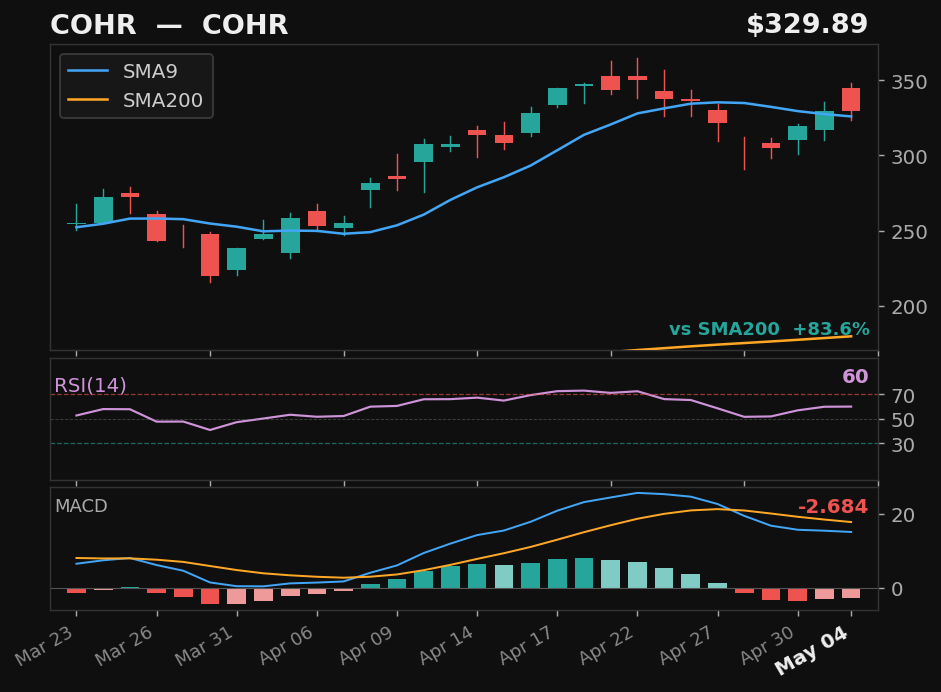
COHR★
COHR
NYSE
- 9.6% pullback — 4 days below SMA9
- Prior rally: 11%
- 84% above SMA200 — strong structural position
- MACD histogram rising from negative — early momentum signal
ExplosiveUpEmpirical
Returns
StockMktDiff
1D———
2D———
3D———
5D———
10D———
results pending next close
 click to enlarge
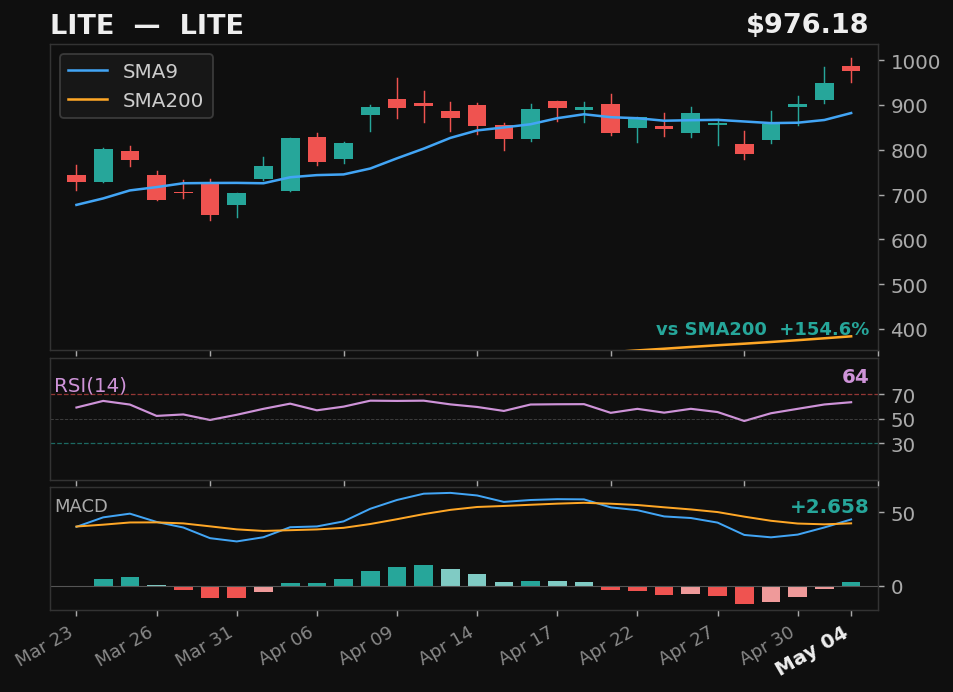
LITE★
LITE
NASDAQ
- 11.6% pullback — 5 days below SMA9
- Prior rally: 13%
- 155% above SMA200 — strong structural position
- MACD momentum building
ExplosiveUpEmpirical
Returns
StockMktDiff
1D———
2D———
3D———
5D———
10D———
results pending next close
 click to enlarge
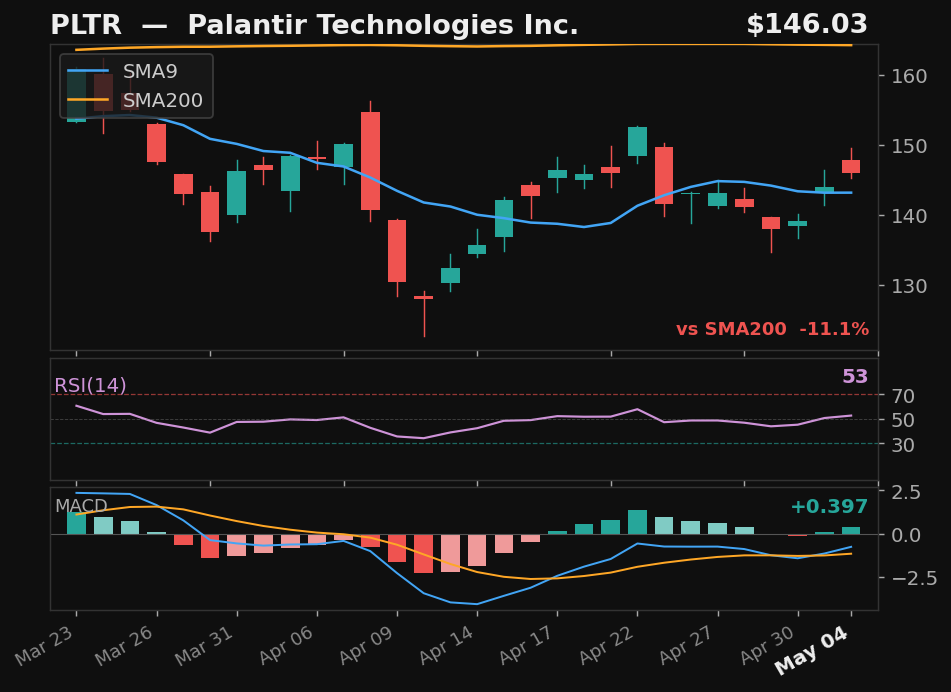
PLTR
Palantir Technologies Inc.
NASDAQ
- 9.6% pullback — 6 days below SMA9
- Prior rally: 11%
- MACD momentum building
ExplosiveUp
Exp Score44Days Below6Pullback%9.6
Returns
StockMktDiff
1D———
2D———
3D———
5D———
10D———
results pending next close
 click to enlarge
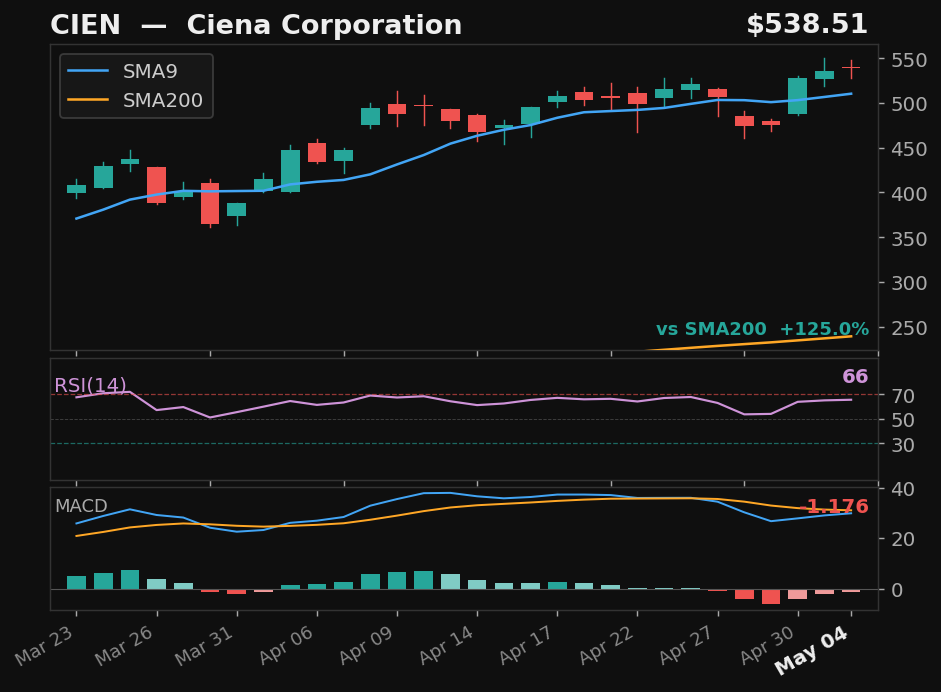
CIEN
Ciena Corporation
NYSE
- 6.4% pullback — full candle body above SMA9
- RSI at 65, rising above 50
- MACD histogram rising while still negative — early recovery signal
- 125.0% above SMA200 — extended from trend
Empirical
Emp Score53.4Body Above✓
Returns
StockMktDiff
1D———
2D———
3D———
5D———
10D———
results pending next close
 click to enlarge
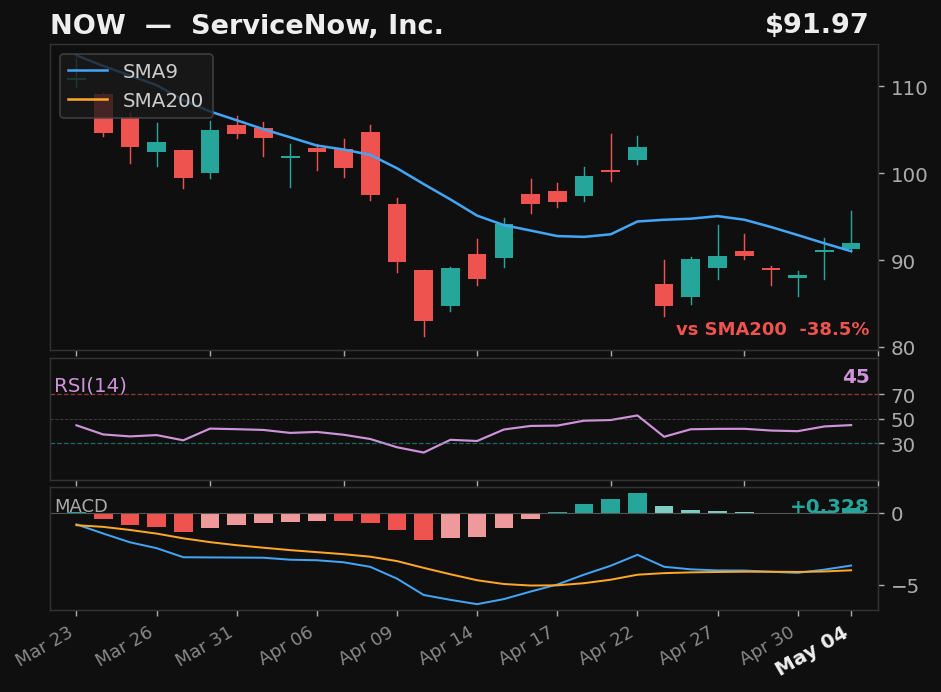
NOW
ServiceNow, Inc.
NYSE
- 17.7% pullback over 7 days — full candle above SMA9
- RSI rising from 45
- MACD bullish cross 1 day ago
- 38.5% below SMA200 — extended from trend
Empirical
Emp Score47.0Body Above✓
Returns
StockMktDiff
1D———
2D———
3D———
5D———
10D———
results pending next close