Thursday, May 14, 2026 · After Close
Empirical4
 click to enlarge
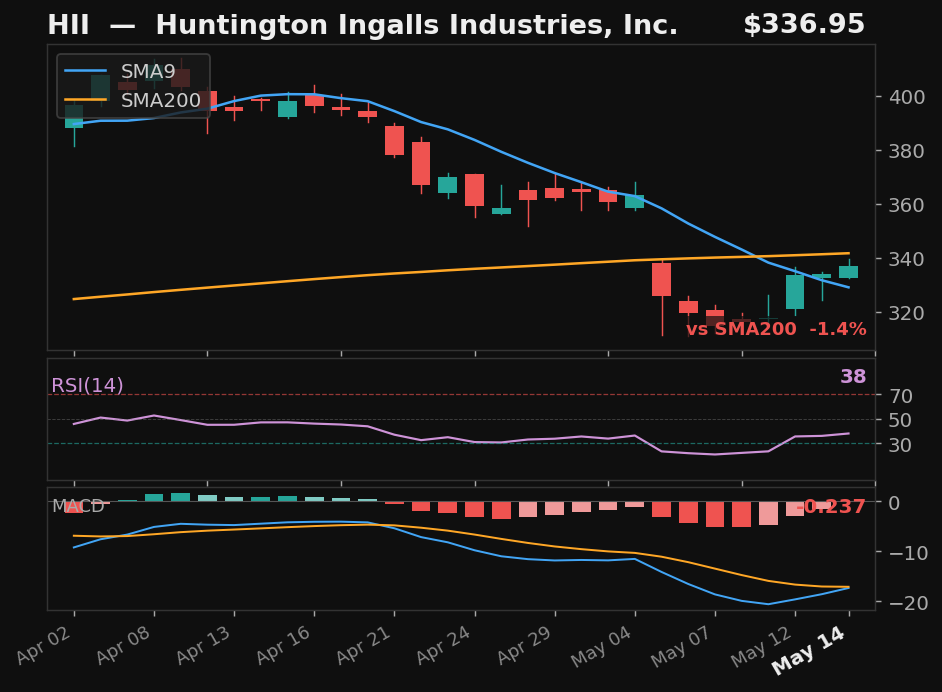
HII
Huntington Ingalls Industries, Inc.
NYSE
- 22.0% pullback — full candle body above SMA9
- RSI rising from 37
- MACD histogram rising while still negative — early recovery signal
Empirical
Emp Score47.4Body Above✓
Returns
StockMktDiff
1D———
2D———
3D———
5D———
10D———
results pending next close
 click to enlarge
ZBH
Zimmer Biomet Holdings, Inc.
NYSE
- 16.7% pullback — full candle body above SMA9
- MACD histogram rising while still negative — early recovery signal
- 12.4% below SMA200 — extended from trend
Empirical
Emp Score40.0Body Above✓
Returns
StockMktDiff
1D———
2D———
3D———
5D———
10D———
results pending next close
 click to enlarge
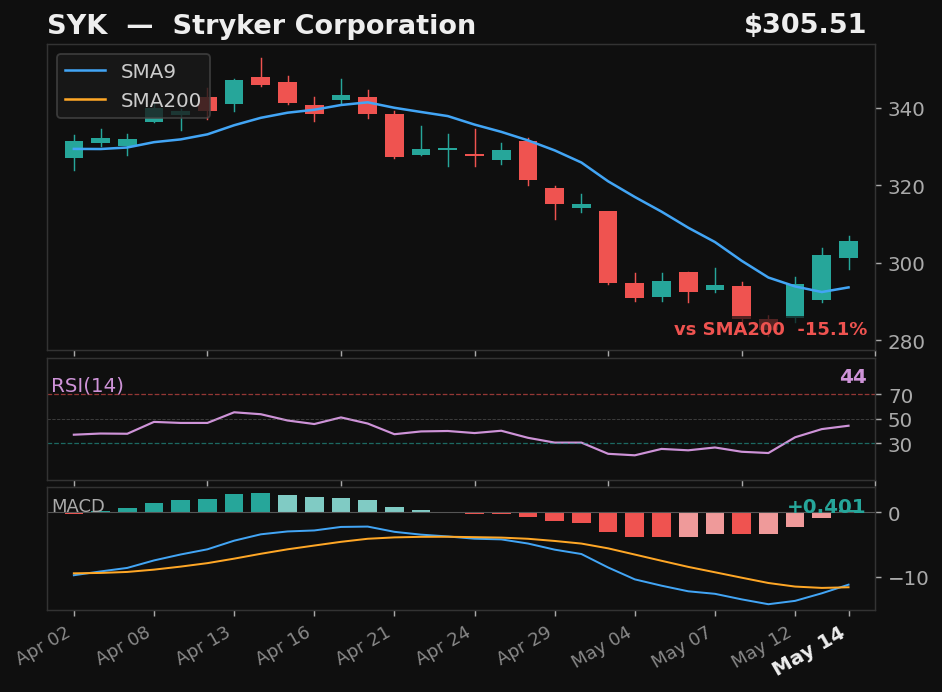
SYK
Stryker Corporation
NYSE
- 17.7% pullback — full candle body above SMA9
- RSI rising from 43
- 15.1% below SMA200 — extended from trend
Empirical
Emp Score39.9Body Above✓
Returns
StockMktDiff
1D———
2D———
3D———
5D———
10D———
results pending next close
 click to enlarge
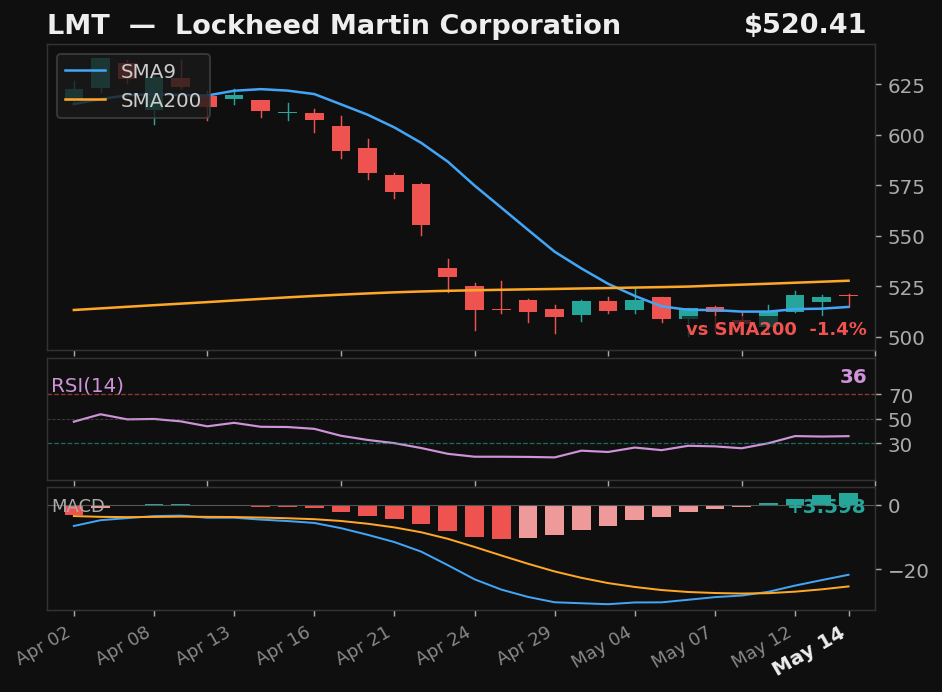
LMT
Lockheed Martin Corporation
NYSE
- 18.8% pullback — full candle body above SMA9
- RSI rising from 35
Empirical
Emp Score38.0Body Above✓
Returns
StockMktDiff
1D———
2D———
3D———
5D———
10D———
results pending next close