Wednesday, March 4, 2026 · After Close
SwingTrader Setups
6 candidates
 click to enlarge
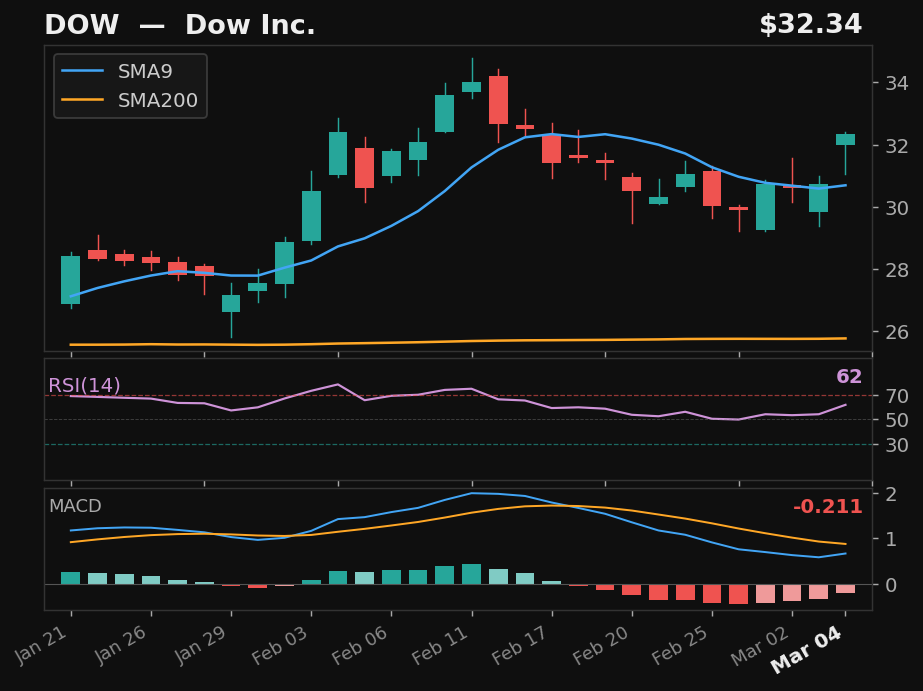
DOW
Dow Inc.
NYSE
- 8.0% pullback to SMA9
- Crossed above SMA9 — 2 days above
- RSI at 62, rising
- MACD histogram improving
Base✓Strict✓Score75.0
Returns
StockMktDiff
1D+4.3%-0.6%+4.8%
2D+2.9%-1.9%+4.8%
3D+6.1%-1.0%+7.1%
5D+6.3%-1.3%+7.6%
10D+16.5%-3.5%+20.0%
 click to enlarge
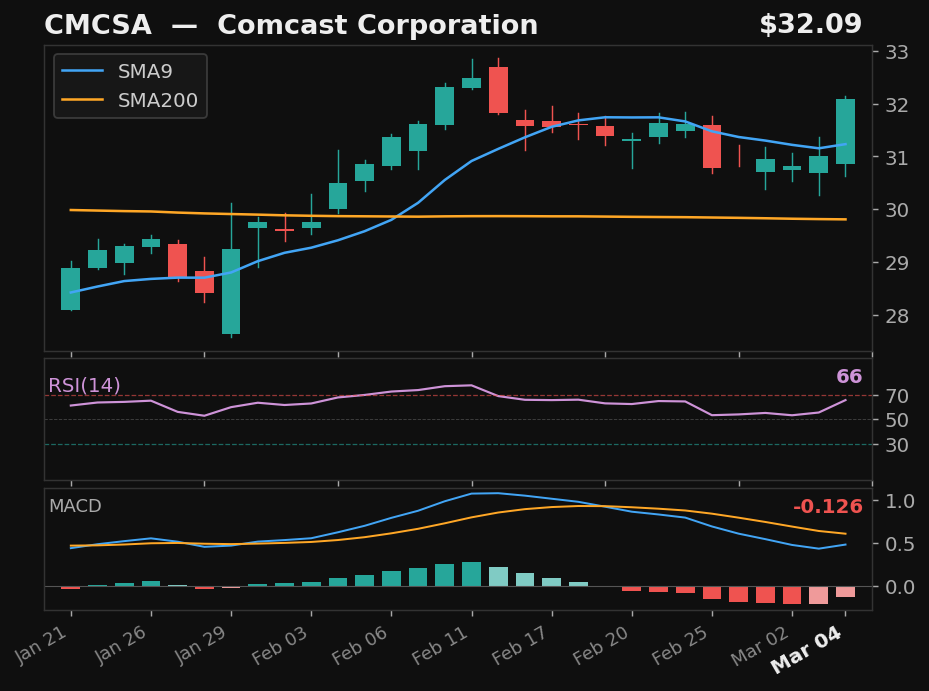
CMCSA
Comcast Corporation
NASDAQ
- 2.7% pullback to SMA9 over 11 days
- Crossed back above SMA9 today
- RSI at 66, rising
- MACD histogram improving
Base✓Strict✗Score65.0
Returns
StockMktDiff
1D-1.5%-0.6%-1.0%
2D-0.6%-1.9%+1.3%
3D-3.3%-1.0%-2.3%
5D-4.7%-1.3%-3.5%
10D-11.0%-3.5%-7.5%
 click to enlarge
PKG
Packaging Corporation of America
NYSE
- 6.2% pullback to SMA9 over 10 days
- Crossed back above SMA9 today
- RSI at 53, rising
- MACD histogram improving
Base✓Strict✗Score64.0
Returns
StockMktDiff
1D-2.7%-0.6%-2.2%
2D-4.3%-1.9%-2.5%
3D-4.2%-1.0%-3.2%
5D-4.3%-1.3%-3.0%
10D-9.9%-3.5%-6.5%
 click to enlarge
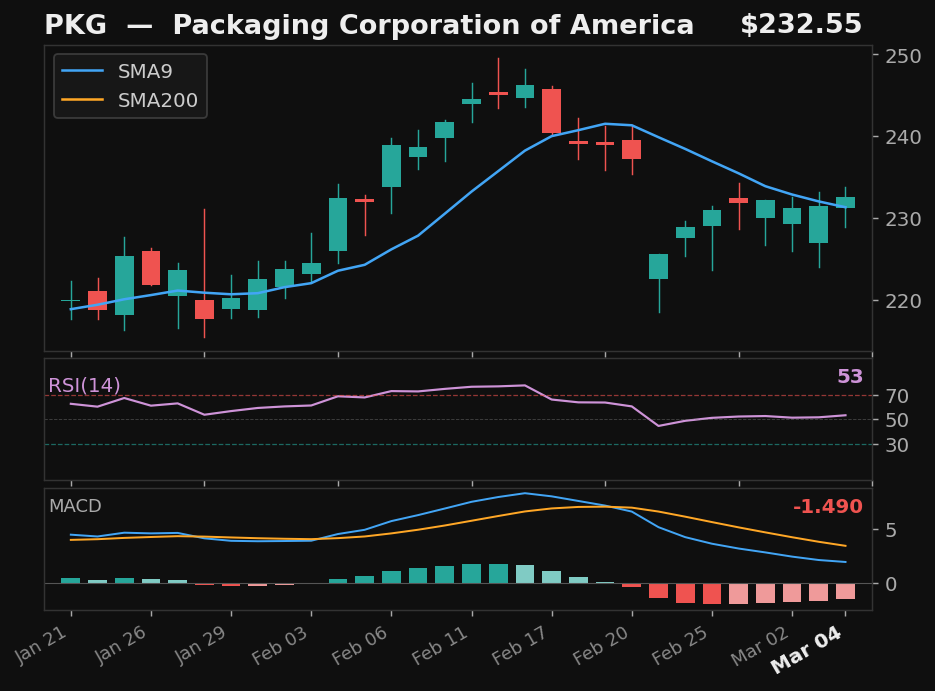
ANET
Arista Networks, Inc.
NYSE
- 10.7% pullback to SMA9 over 9 days
- Crossed back above SMA9 today
- RSI at 51, rising
- MACD histogram improving
Base✓Strict✗Score62.0
Returns
StockMktDiff
1D+3.4%-0.6%+3.9%
2D-1.4%-1.9%+0.4%
3D+1.7%-1.0%+2.7%
5D+2.5%-1.3%+3.8%
10D+0.9%-3.5%+4.4%
 click to enlarge
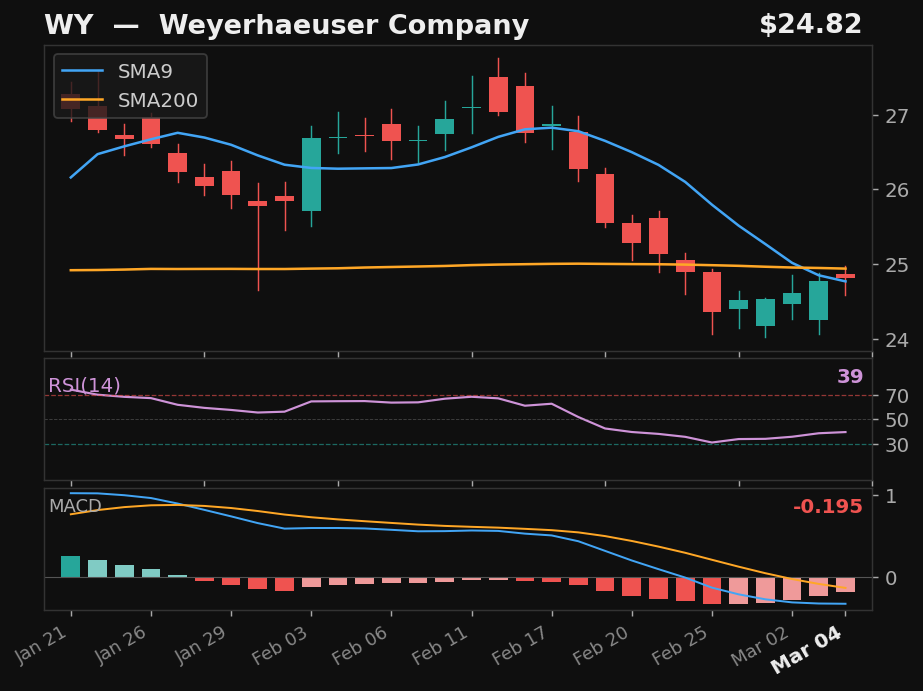
WY
Weyerhaeuser Company
NYSE
- 9.4% pullback to SMA9 over 10 days
- Crossed back above SMA9 today
- RSI rising from 39 — recovering momentum
- MACD histogram improving
Base✓Strict✗Score57.0
Returns
StockMktDiff
1D-0.8%-0.6%-0.2%
2D-1.3%-1.9%+0.6%
3D-1.5%-1.0%-0.5%
5D-6.4%-1.3%-5.1%
10D-5.6%-3.5%-2.1%
 click to enlarge
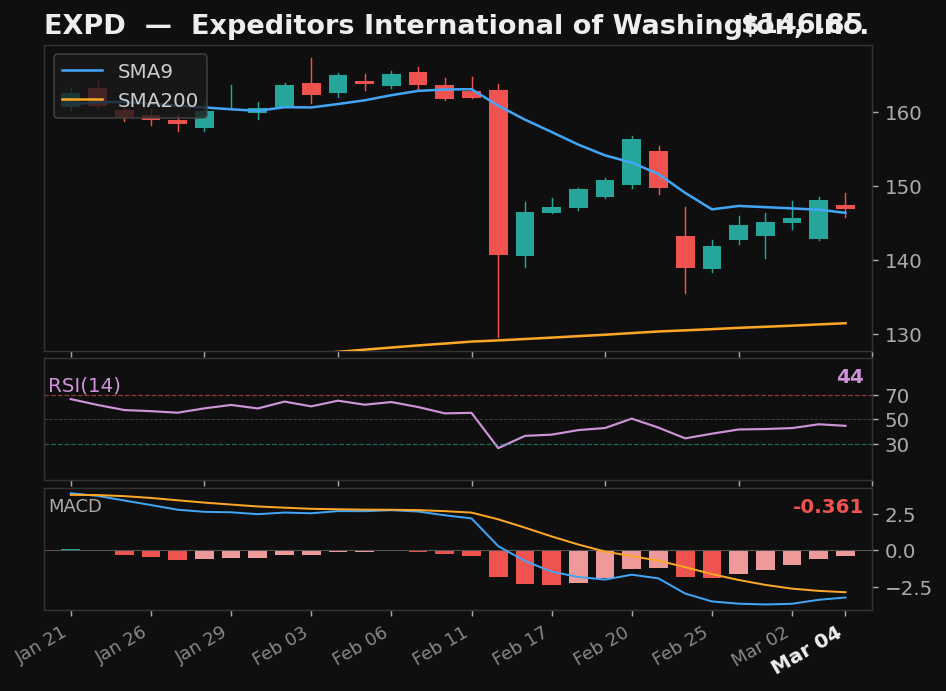
EXPD
Expeditors International of Washington, Inc.
NYSE
- 15.2% pullback to SMA9
- Crossed above SMA9 — 2 days above
- MACD histogram improving
- Long-term uptrend intact
Base✓Strict✗Score48.0
Returns
StockMktDiff
1D-0.1%-0.6%+0.5%
2D+0.0%-1.9%+1.9%
3D-1.1%-1.0%-0.1%
5D-4.1%-1.3%-2.8%
10D-1.5%-3.5%+1.9%
Alternative Setups
3 candidates · ranked by Empirical Score
 click to enlarge
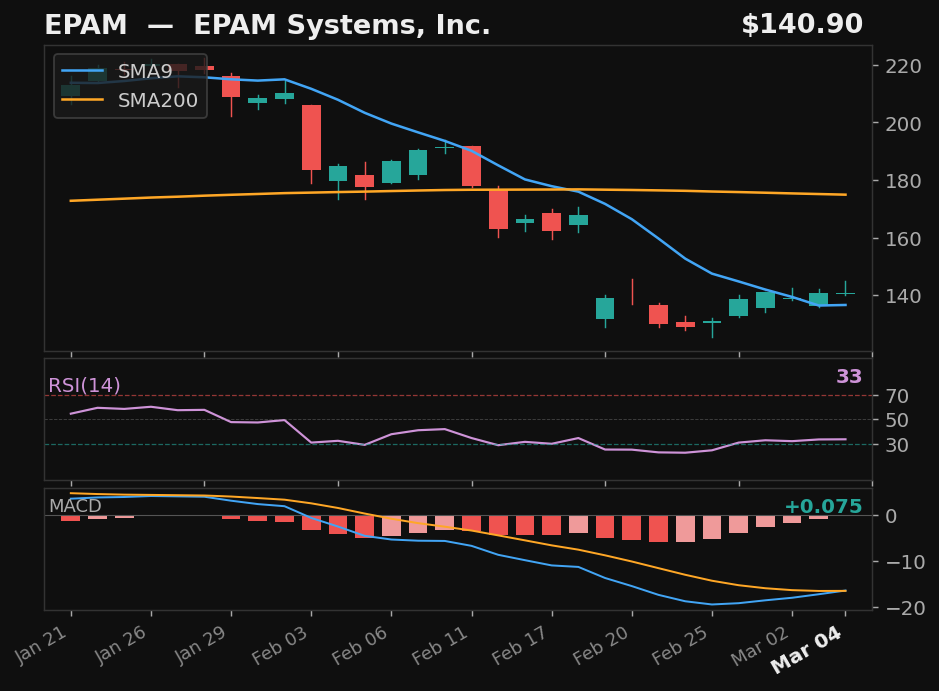
EPAM
EPAM Systems, Inc.
NYSE
- 41.0% pullback — full candle body above SMA9
- RSI rising from 33
- 19.4% below SMA200 — extended from trend
Emp Score87.8Body Above✓
Returns
StockMktDiff
1D+2.6%-0.6%+3.2%
2D+3.5%-1.9%+5.4%
3D+3.8%-1.0%+4.8%
5D+0.8%-1.3%+2.1%
10D-4.9%-3.5%-1.5%
 click to enlarge
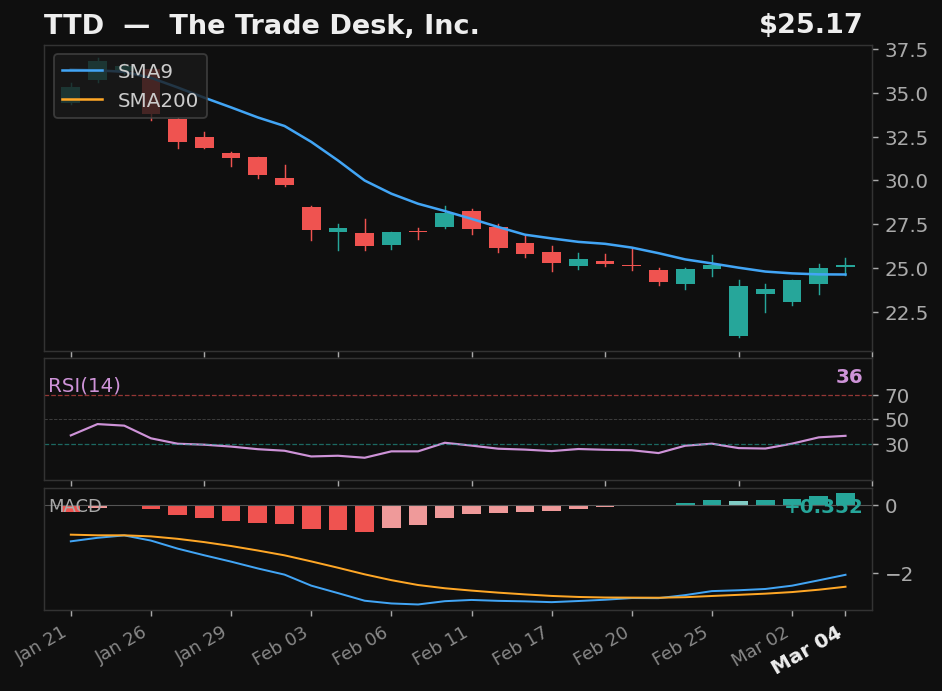
TTD
The Trade Desk, Inc.
OTHER
- 34.8% pullback — full candle body above SMA9
- RSI rising from 36
- 51.4% below SMA200 — extended from trend
Emp Score85.1Body Above✓
Returns
StockMktDiff
1D+18.4%-0.6%+18.9%
2D+16.3%-1.9%+18.2%
3D+13.5%-1.0%+14.5%
5D+8.4%-1.3%+9.7%
10D-6.4%-3.5%-3.0%
 click to enlarge
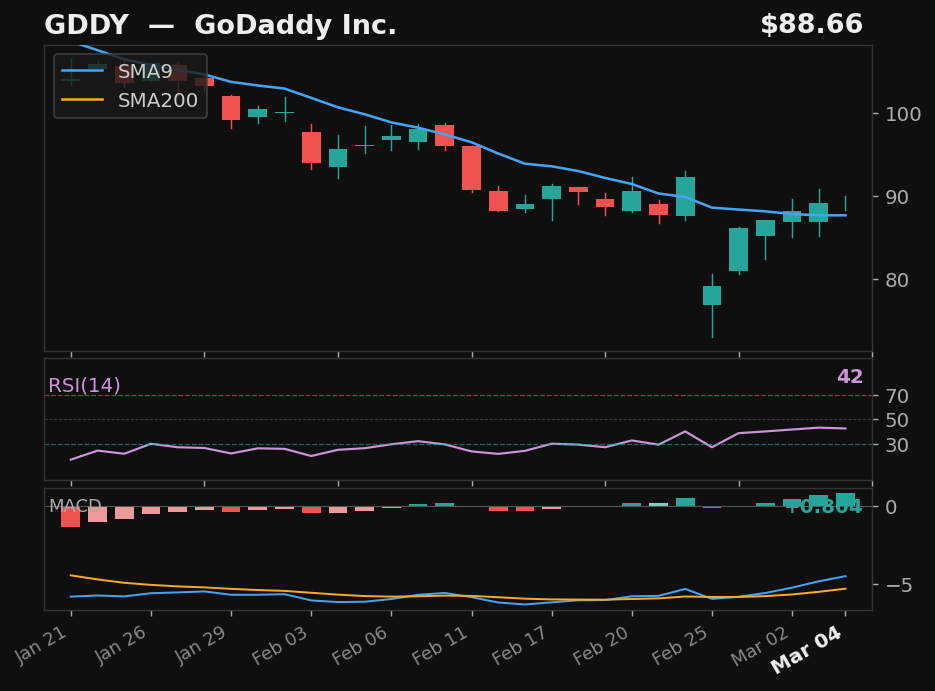
GDDY
GoDaddy Inc.
NYSE
- 36.2% pullback — full candle body above SMA9
- 36.1% below SMA200 — extended from trend
Emp Score83.3Body Above✓
Returns
StockMktDiff
1D+5.0%-0.6%+5.6%
2D+6.0%-1.9%+7.8%
3D+3.4%-1.0%+4.4%
5D-2.4%-1.3%-1.1%
10D-5.1%-3.5%-1.7%