Thursday, March 12, 2026 · After Close
SwingTrader Setups
3 candidates
 click to enlarge
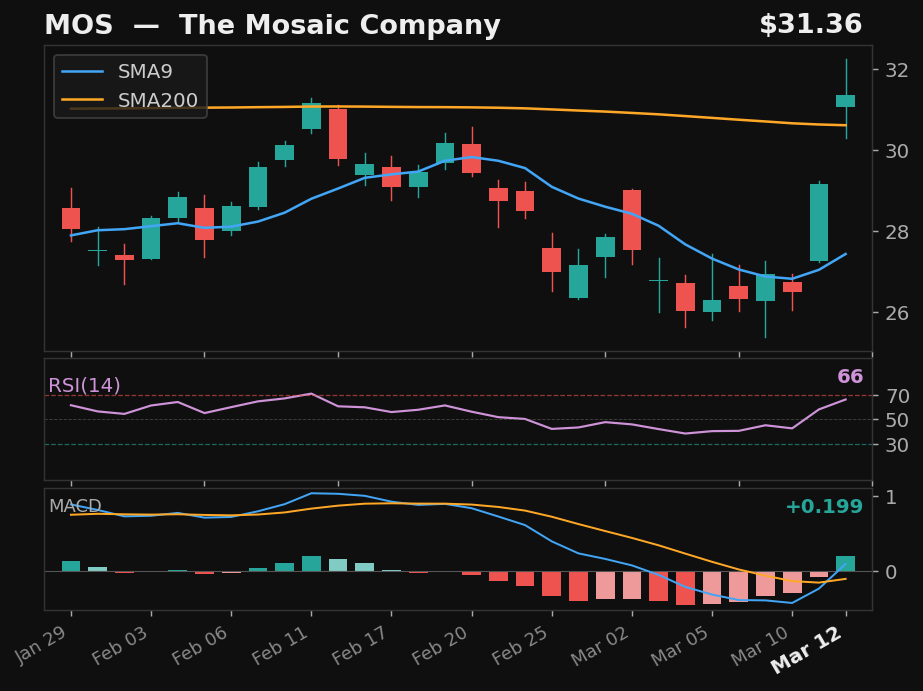
MOS
The Mosaic Company
NYSE
- 13.8% pullback to SMA9
- Crossed above SMA9 — 2 days above
- RSI at 66, rising
- MACD histogram improving
Base✓Strict✓Score73.0
Returns
StockMktDiff
1D-6.5%-0.6%-6.0%
2D-11.8%+0.4%-12.2%
3D-8.1%+0.7%-8.8%
5D-16.5%-0.9%-15.5%
10D-20.3%-3.1%-17.1%
 click to enlarge
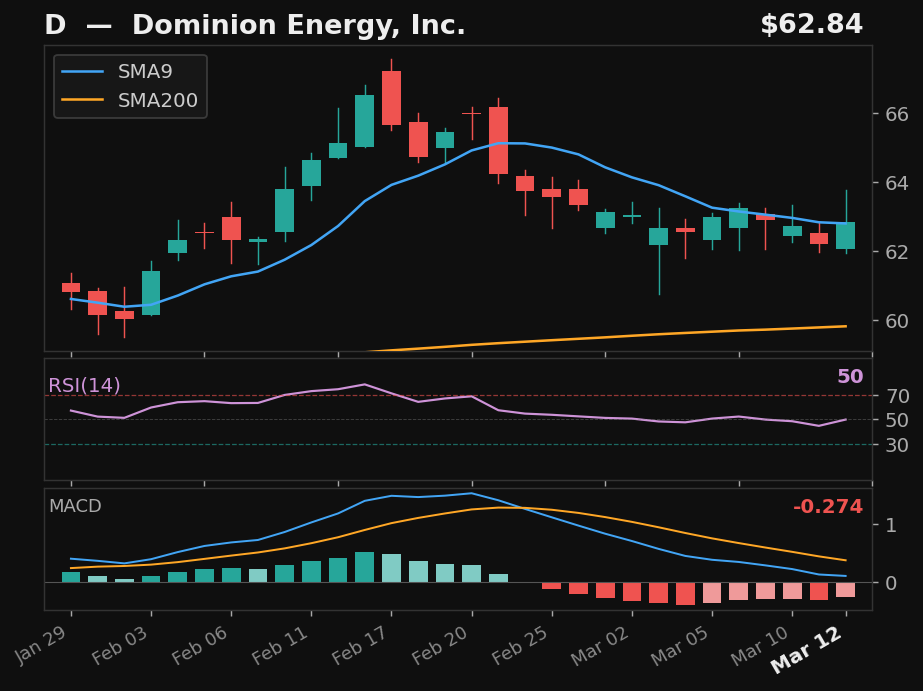
D
Dominion Energy, Inc.
NYSE
- Quick 5.7% pullback to SMA9 — 3 days
- Crossed back above SMA9 today
- RSI at 50, rising
- MACD histogram improving
Base✓Strict✗Score75.0
Returns
StockMktDiff
1D+0.6%-0.6%+1.2%
2D+0.9%+0.4%+0.5%
3D+0.3%+0.7%-0.4%
5D-2.9%-0.9%-2.0%
10D-3.1%-3.1%+0.1%
 click to enlarge
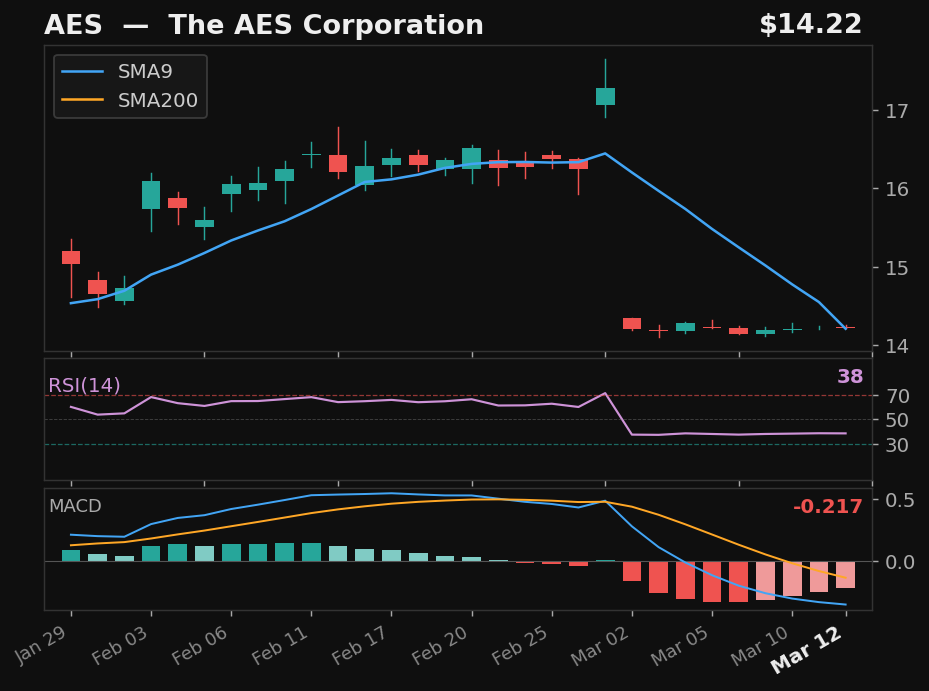
AES
The AES Corporation
NYSE
- 18.1% pullback to SMA9 over 8 days
- Crossed back above SMA9 today
- MACD histogram improving
- Long-term uptrend intact
Base✓Strict✗Score53.0
Returns
StockMktDiff
1D-0.2%-0.6%+0.4%
2D-0.1%+0.4%-0.6%
3D-0.1%+0.7%-0.9%
5D-0.5%-0.9%+0.4%
10D-1.5%-3.1%+1.7%
Alternative Setups
3 candidates · ranked by Empirical Score
 click to enlarge
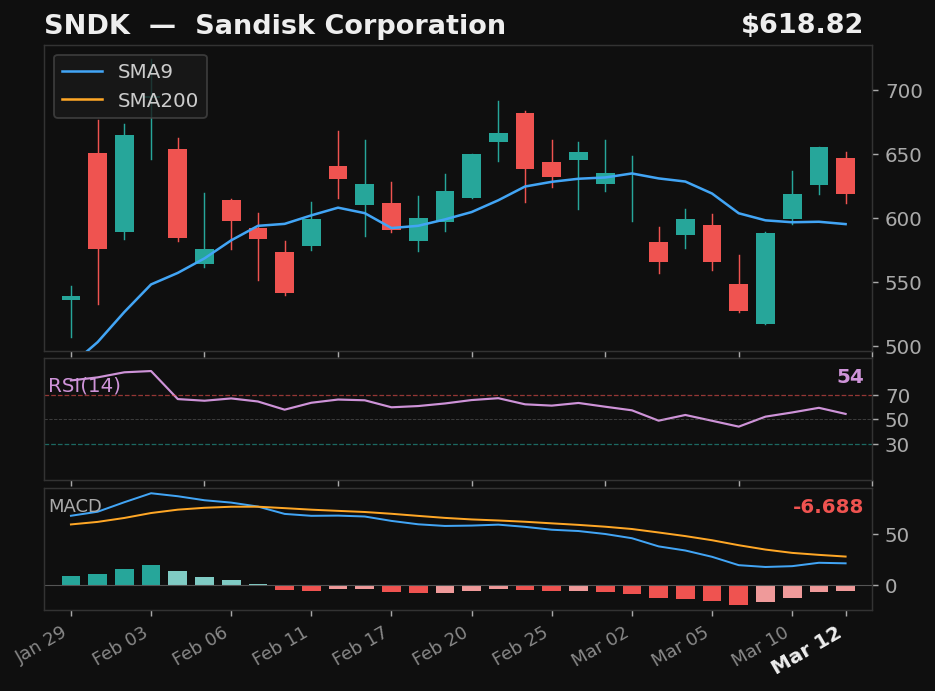
SNDK
Sandisk Corporation
NASDAQ
- 19.1% pullback — full candle body above SMA9
- MACD histogram rising while still negative — early recovery signal
- 186.5% above SMA200 — extended from trend
Emp Score100.2Body Above✓
Returns
StockMktDiff
1D+6.9%-0.6%+7.5%
2D+13.7%+0.4%+13.3%
3D+16.4%+0.7%+15.7%
5D+24.8%-0.9%+25.7%
10D-2.5%-3.1%+0.6%
 click to enlarge
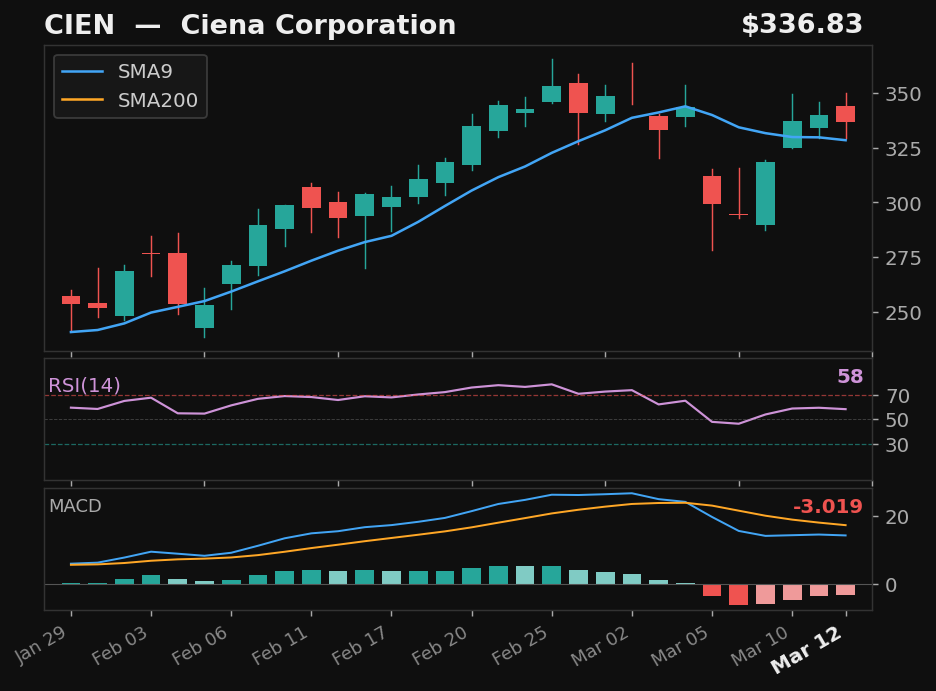
CIEN
Ciena Corporation
NYSE
- 16.8% pullback — full candle body above SMA9
- MACD histogram rising while still negative — early recovery signal
- 95.9% above SMA200 — extended from trend
Emp Score70.5Body Above✓
Returns
StockMktDiff
1D+0.2%-0.6%+0.7%
2D+8.0%+0.4%+7.6%
3D+9.9%+0.7%+9.2%
5D+22.5%-0.9%+23.4%
10D+15.2%-3.1%+18.3%
 click to enlarge
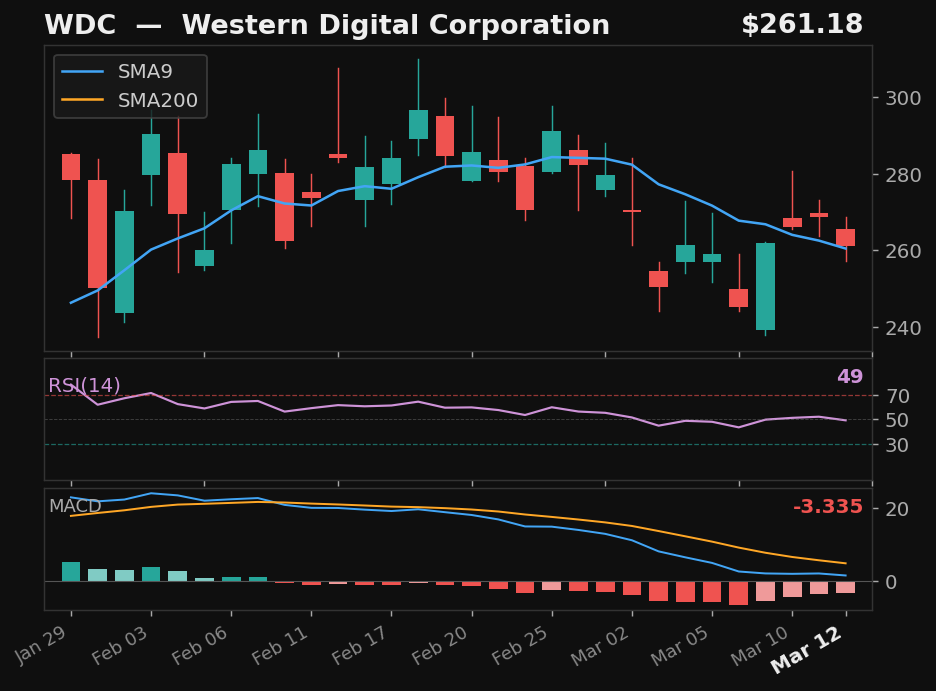
WDC
Western Digital Corporation
NASDAQ
- 15.7% pullback — full candle body above SMA9
- MACD histogram rising while still negative — early recovery signal
- 83.4% above SMA200 — extended from trend
Emp Score59.4Body Above✓
Returns
StockMktDiff
1D+4.3%-0.6%+4.8%
2D+9.6%+0.4%+9.1%
3D+20.2%+0.7%+19.4%
5D+21.3%-0.9%+22.3%
10D+4.7%-3.1%+7.8%