Friday, March 13, 2026 · After Close
★ Highlights
1 in both pools
 click to enlarge
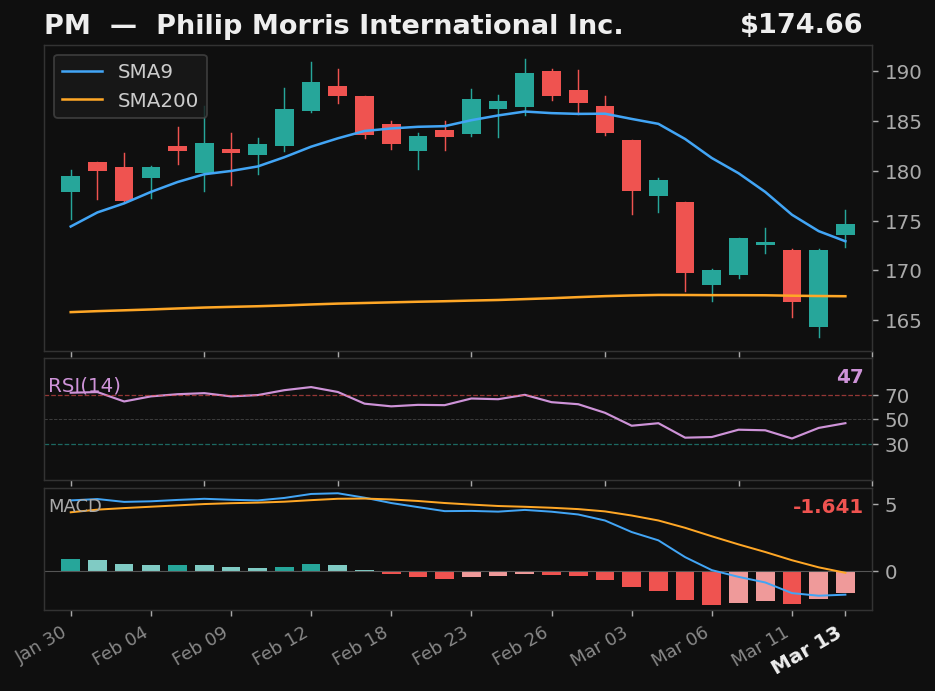
PM
Philip Morris International Inc.
NYSE
- 10.7% pullback to SMA9 over 9 days
- Crossed back above SMA9 today
- RSI at 47, rising
- MACD histogram improving
Base✓Strict✓Score73.0
Returns
StockMktDiff
1D+0.1%+1.0%-0.9%
2D-1.0%+1.3%-2.3%
3D-4.9%-0.1%-4.7%
5D-6.6%-2.1%-4.5%
10D-6.4%-4.3%-2.1%
SwingTrader Setups
9 candidates
 click to enlarge
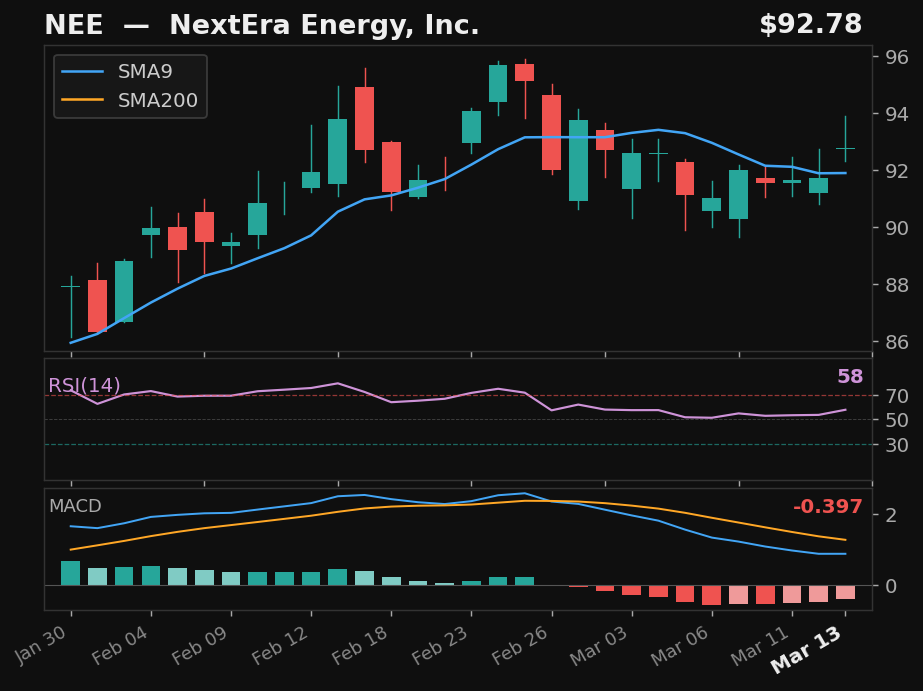
NEE
NextEra Energy, Inc.
NYSE
- 4.3% pullback to SMA9 over 9 days
- Crossed back above SMA9 today
- RSI at 58, rising
- MACD histogram improving
Base✓Strict✓Score85.0
Returns
StockMktDiff
1D+0.0%+1.0%-1.0%
2D-0.3%+1.3%-1.6%
3D-2.0%-0.1%-1.8%
5D-3.5%-2.1%-1.5%
10D-1.5%-4.3%+2.8%
 click to enlarge
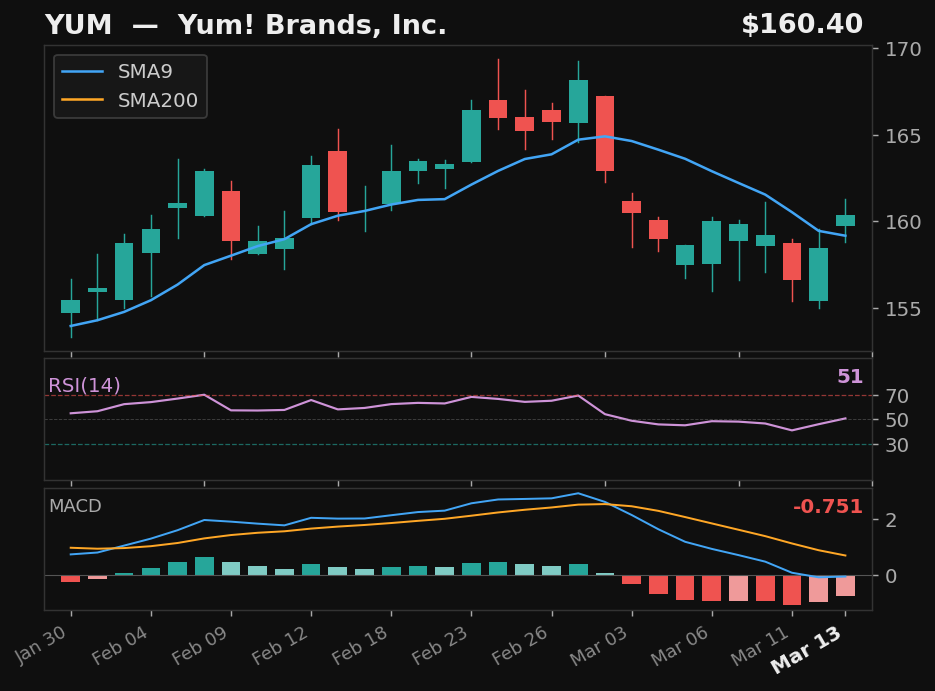
YUM
Yum! Brands, Inc.
NYSE
- 6.9% pullback to SMA9 over 9 days
- Crossed back above SMA9 today
- RSI at 51, rising
- MACD histogram improving
Base✓Strict✓Score79.0
Returns
StockMktDiff
1D+0.9%+1.0%-0.2%
2D+2.1%+1.3%+0.8%
3D-0.8%-0.1%-0.7%
5D-2.5%-2.1%-0.4%
10D-4.0%-4.3%+0.2%
click to enlarge
PM
Philip Morris International Inc.
NYSE
- 10.7% pullback to SMA9 over 9 days
- Crossed back above SMA9 today
- RSI at 47, rising
- MACD histogram improving
Base✓Strict✓Score73.0
Returns
StockMktDiff
1D+0.1%+1.0%-0.9%
2D-1.0%+1.3%-2.3%
3D-4.9%-0.1%-4.7%
5D-6.6%-2.1%-4.5%
10D-6.4%-4.3%-2.1%
 click to enlarge
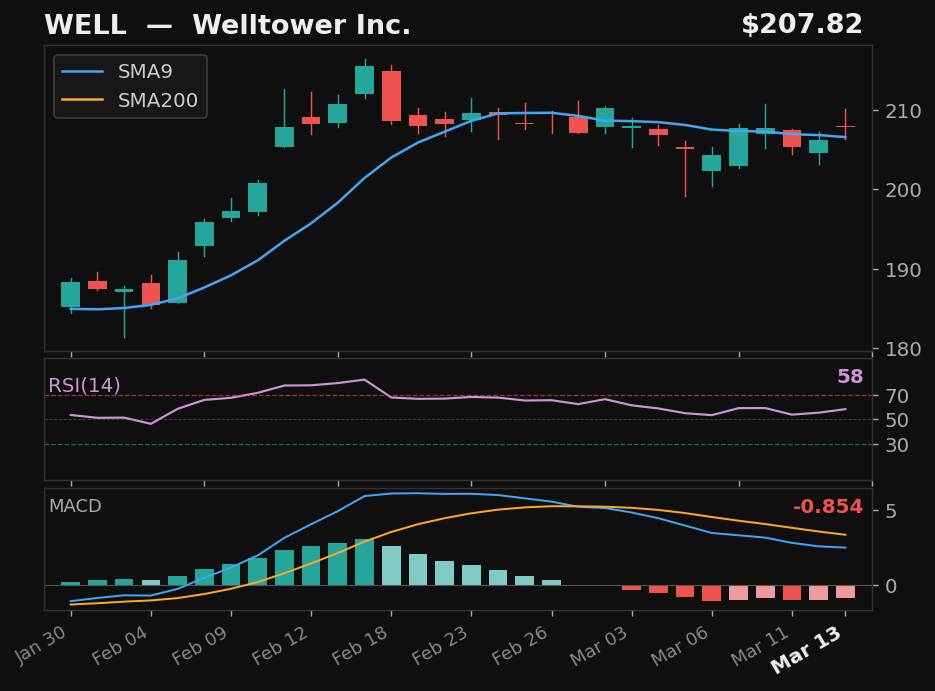
WELL
Welltower Inc.
NYSE
- Quick 2.8% pullback to SMA9 — 2 days
- Crossed back above SMA9 today
- RSI at 58, rising
- MACD histogram improving
Base✓Strict✗Score72.0
Returns
StockMktDiff
1D+1.1%+1.0%+0.1%
2D+2.6%+1.3%+1.3%
3D+0.7%-0.1%+0.8%
5D-5.7%-2.1%-3.6%
10D-5.8%-4.3%-1.5%
 click to enlarge
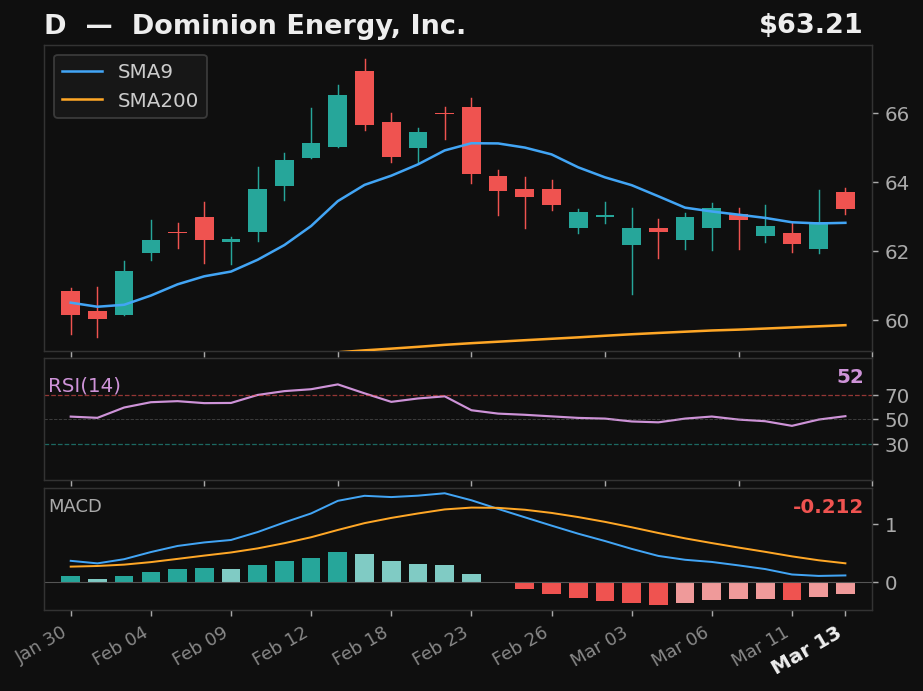
D
Dominion Energy, Inc.
NYSE
- 5.7% pullback to SMA9
- Crossed above SMA9 — 2 days above
- RSI at 52, rising
- MACD histogram improving
Base✓Strict✗Score69.0
Returns
StockMktDiff
1D+0.3%+1.0%-0.7%
2D-0.3%+1.3%-1.6%
3D-1.6%-0.1%-1.5%
5D-6.1%-2.1%-4.0%
10D-3.7%-4.3%+0.6%
 click to enlarge
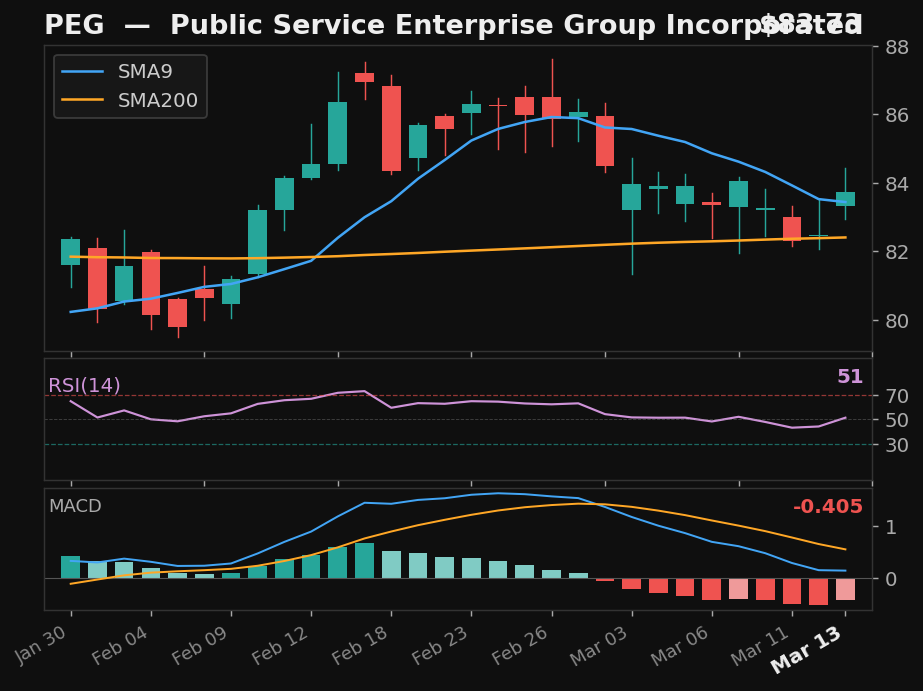
PEG
Public Service Enterprise Group Incorporated
NYSE
- 4.4% pullback to SMA9 over 9 days
- Crossed back above SMA9 today
- RSI at 51, rising
- MACD histogram improving
Base✓Strict✗Score69.0
Returns
StockMktDiff
1D+1.4%+1.0%+0.4%
2D+1.2%+1.3%-0.1%
3D+0.6%-0.1%+0.7%
5D-5.1%-2.1%-3.1%
10D-3.6%-4.3%+0.7%
 click to enlarge
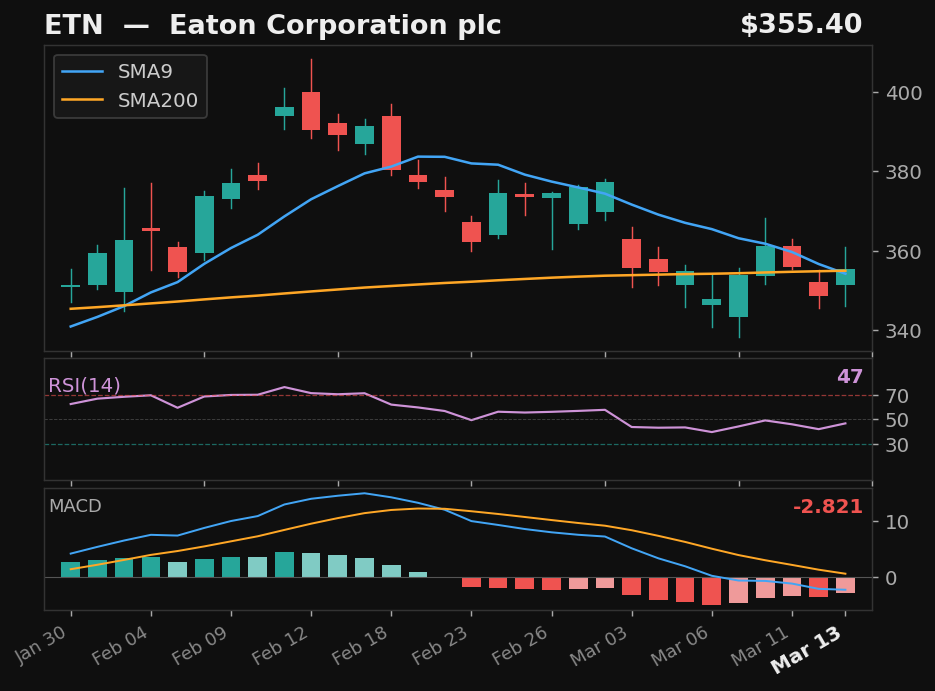
ETN
Eaton Corporation plc
NYSE
- 11.2% pullback to SMA9 over 8 days
- Crossed back above SMA9 today
- RSI at 47, rising
- MACD histogram improving
Base✓Strict✗Score62.0
Returns
StockMktDiff
1D+1.6%+1.0%+0.6%
2D+2.4%+1.3%+1.1%
3D+1.4%-0.1%+1.6%
5D+0.4%-2.1%+2.5%
10D+0.6%-4.3%+4.8%
 click to enlarge
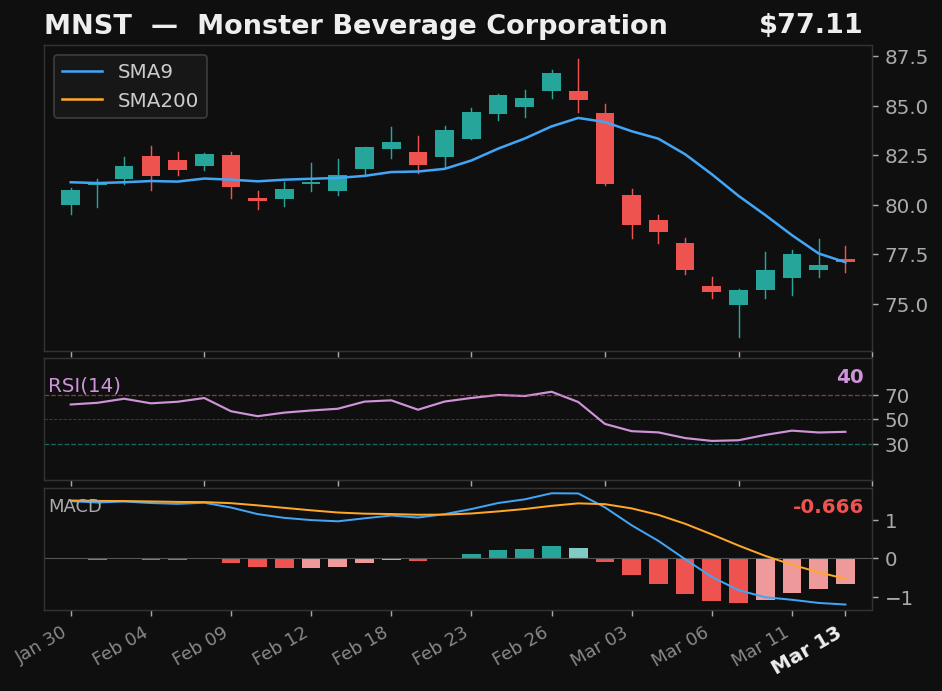
MNST
Monster Beverage Corporation
NASDAQ
- 11.4% pullback to SMA9 over 9 days
- Crossed back above SMA9 today
- RSI rising from 40 — recovering momentum
- MACD histogram improving
Base✓Strict✗Score59.0
Returns
StockMktDiff
1D-0.1%+1.0%-1.1%
2D+0.6%+1.3%-0.7%
3D-3.9%-0.1%-3.8%
5D-4.4%-2.1%-2.4%
10D-6.8%-4.3%-2.6%
 click to enlarge
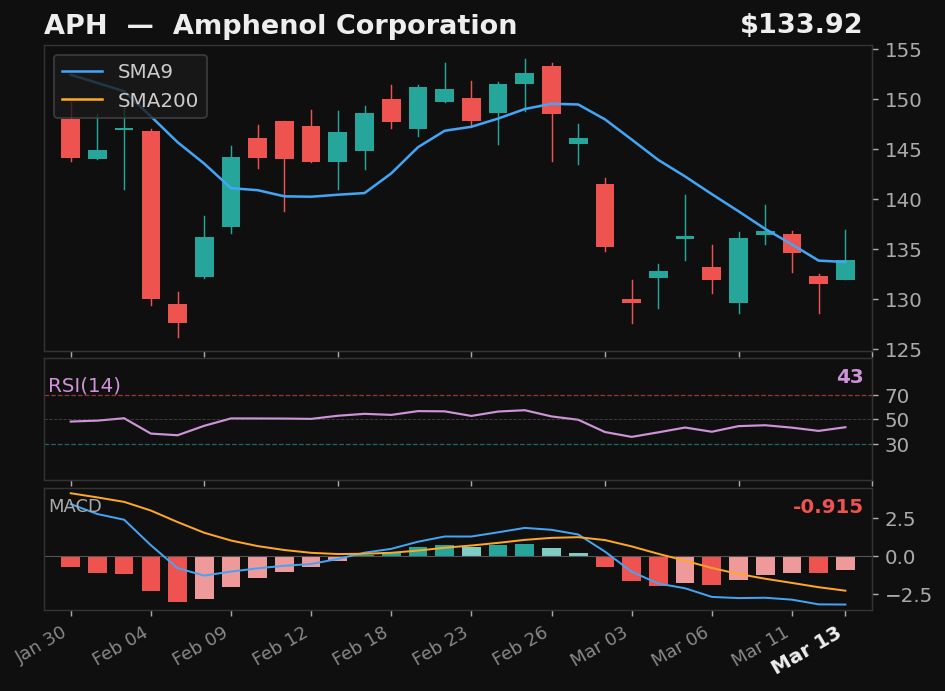
APH
Amphenol Corporation
NYSE
- 15.1% pullback to SMA9 over 11 days
- Crossed back above SMA9 today
- RSI rising from 43 — recovering momentum
- MACD histogram improving
Base✓Strict✗Score56.0
Returns
StockMktDiff
1D+2.2%+1.0%+1.1%
2D+0.9%+1.3%-0.4%
3D-4.6%-0.1%-4.4%
5D-5.4%-2.1%-3.3%
10D-7.7%-4.3%-3.4%
Alternative Setups
3 candidates · ranked by Empirical Score
 click to enlarge
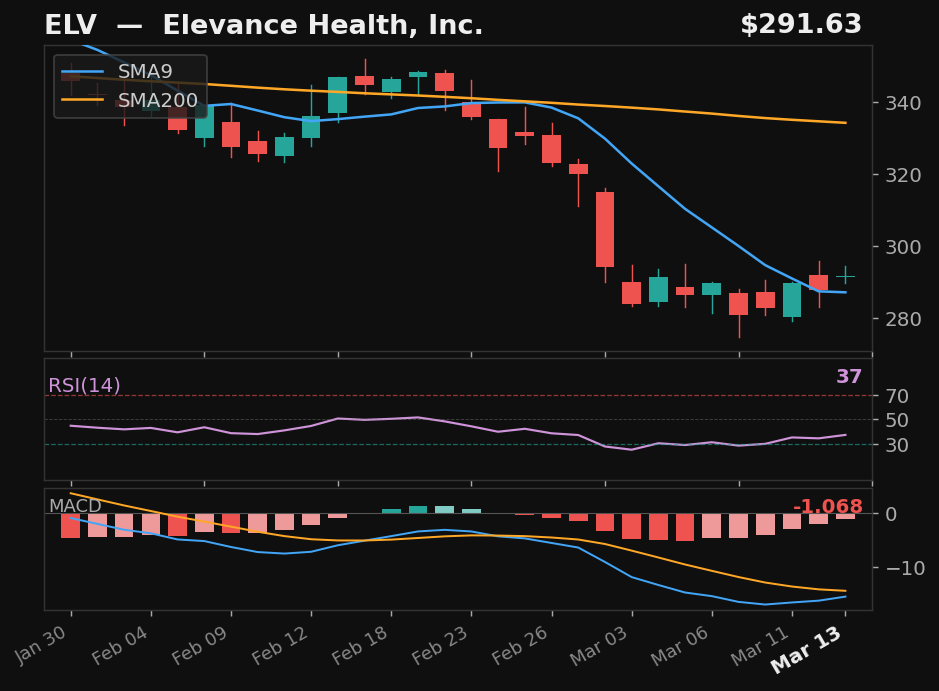
ELV
Elevance Health, Inc.
NYSE
- 18.1% pullback — full candle body above SMA9
- RSI rising from 37
- MACD histogram rising while still negative — early recovery signal
- 12.7% below SMA200 — extended from trend
Emp Score43.1Body Above✓
Returns
StockMktDiff
1D+0.2%+1.0%-0.9%
2D+1.4%+1.3%+0.1%
3D+1.1%-0.1%+1.3%
5D-0.1%-2.1%+2.0%
10D-1.8%-4.3%+2.5%
 click to enlarge
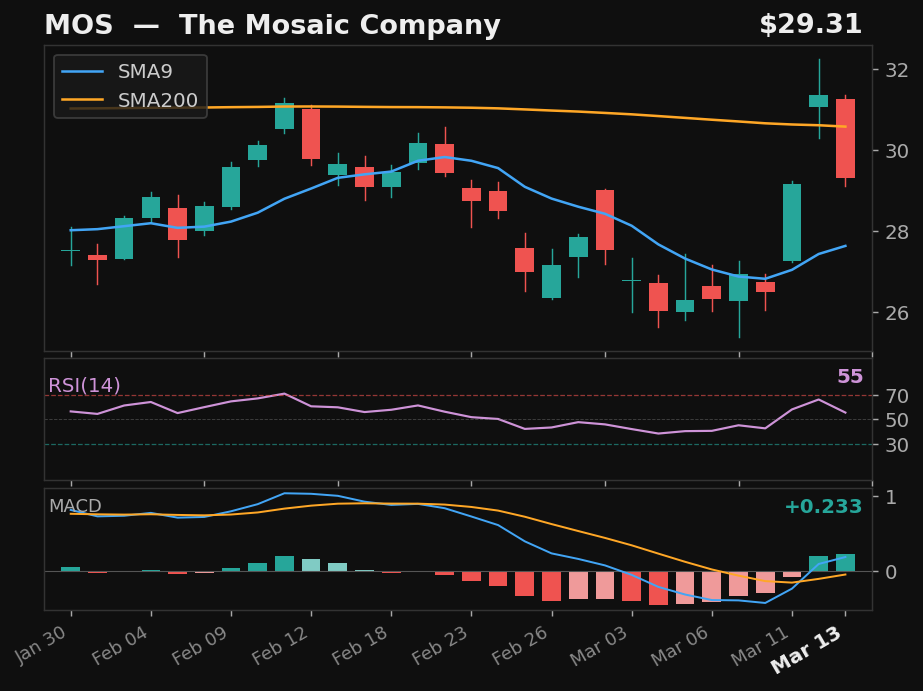
MOS
The Mosaic Company
NYSE
- 13.8% pullback — full candle body above SMA9
- MACD bullish cross 1 day ago
Emp Score33.8Body Above✓
Returns
StockMktDiff
1D-5.6%+1.0%-6.6%
2D-1.6%+1.3%-2.9%
3D-5.2%-0.1%-5.1%
5D-19.5%-2.1%-17.4%
10D-14.7%-4.3%-10.4%
click to enlarge
PM
Philip Morris International Inc.
NYSE
- 10.7% pullback over 9 days — full candle above SMA9
- RSI rising from 47
- MACD histogram rising while still negative — early recovery signal
Emp Score25.7Body Above✓
Returns
StockMktDiff
1D+0.1%+1.0%-0.9%
2D-1.0%+1.3%-2.3%
3D-4.9%-0.1%-4.7%
5D-6.6%-2.1%-4.5%
10D-6.4%-4.3%-2.1%