Monday, March 16, 2026 · After Close
★ Highlights
1 in both pools
 click to enlarge
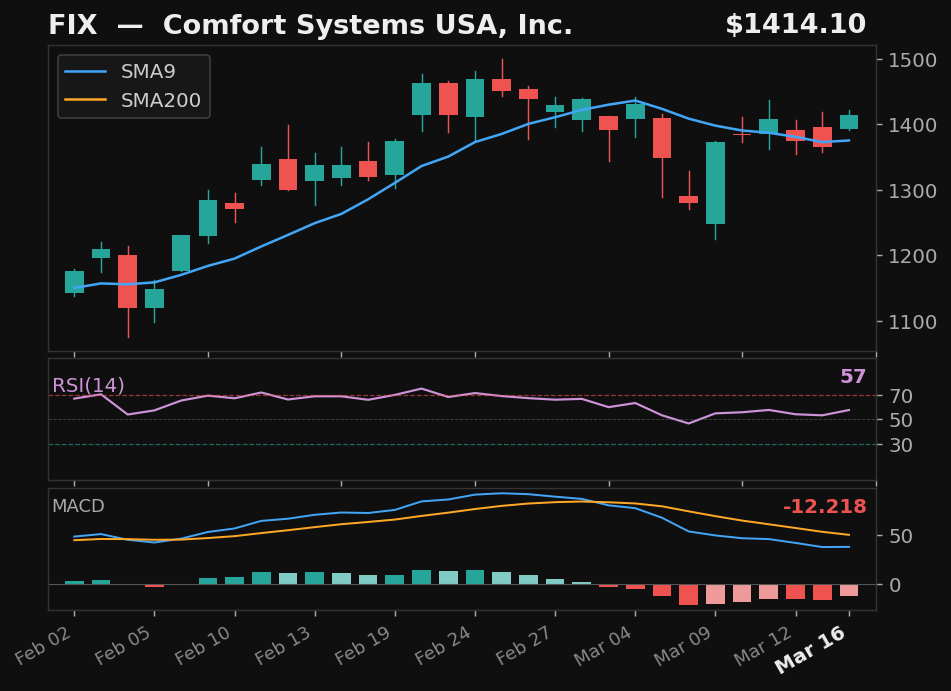
FIX
Comfort Systems USA, Inc.
NYSE
- Quick 11.1% pullback to SMA9 — 2 days
- Crossed back above SMA9 today
- RSI at 57, rising
- MACD histogram improving
Base✓Strict✓Score80.0
Returns
StockMktDiff
1D+0.7%+0.3%+0.5%
2D+0.6%-1.1%+1.8%
3D+2.2%-1.4%+3.5%
5D-0.4%-2.0%+1.6%
10D———
SwingTrader Setups
8 candidates
 click to enlarge
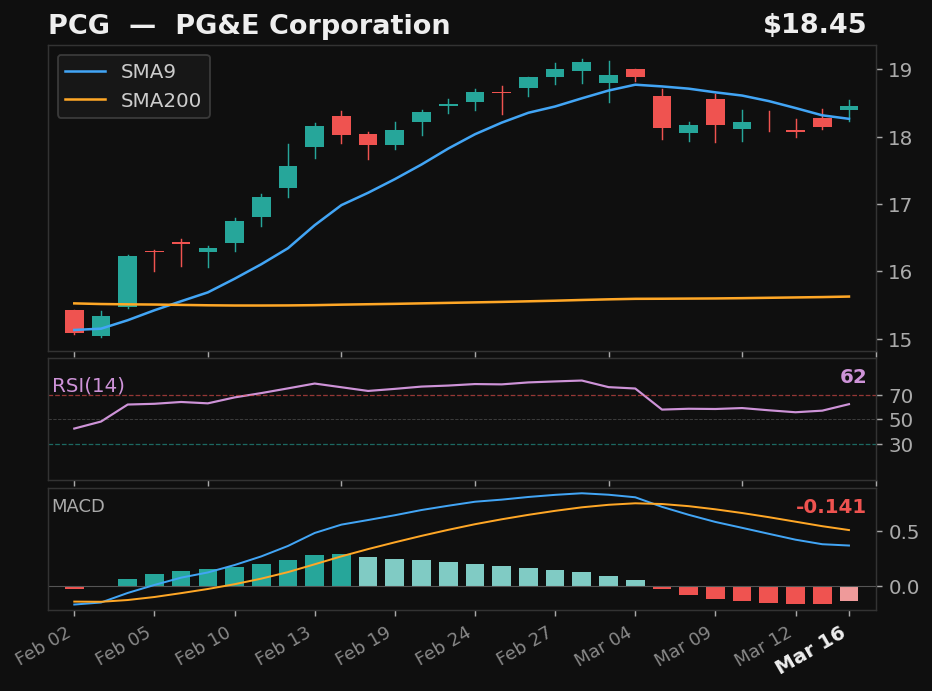
PCG
PG&E Corporation
NYSE
- 4.3% pullback to SMA9 over 7 days
- Crossed back above SMA9 today
- RSI at 62, rising
- MACD histogram improving
Base✓Strict✓Score85.0
Returns
StockMktDiff
1D-0.5%+0.3%-0.8%
2D-1.5%-1.1%-0.4%
3D-1.4%-1.4%-0.0%
5D-5.7%-2.0%-3.7%
10D———
 click to enlarge
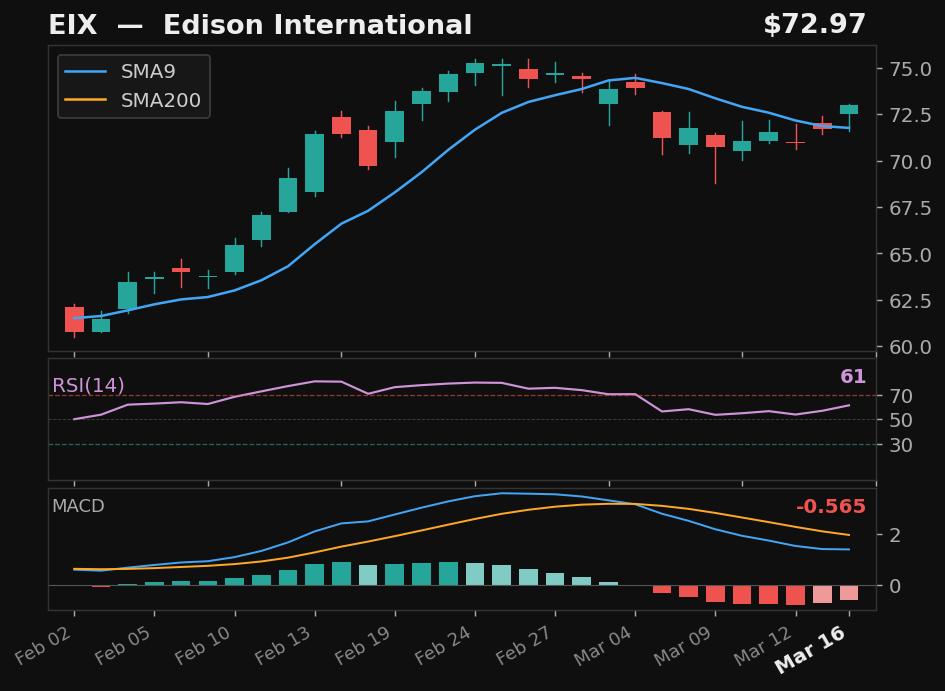
EIX
Edison International
NYSE
- 5.0% pullback to SMA9 over 9 days
- Crossed back above SMA9 today
- RSI at 61, rising
- MACD histogram improving
Base✓Strict✓Score83.0
Returns
StockMktDiff
1D-0.1%+0.3%-0.3%
2D-0.4%-1.1%+0.7%
3D-1.5%-1.4%-0.1%
5D-3.2%-2.0%-1.1%
10D———
 click to enlarge
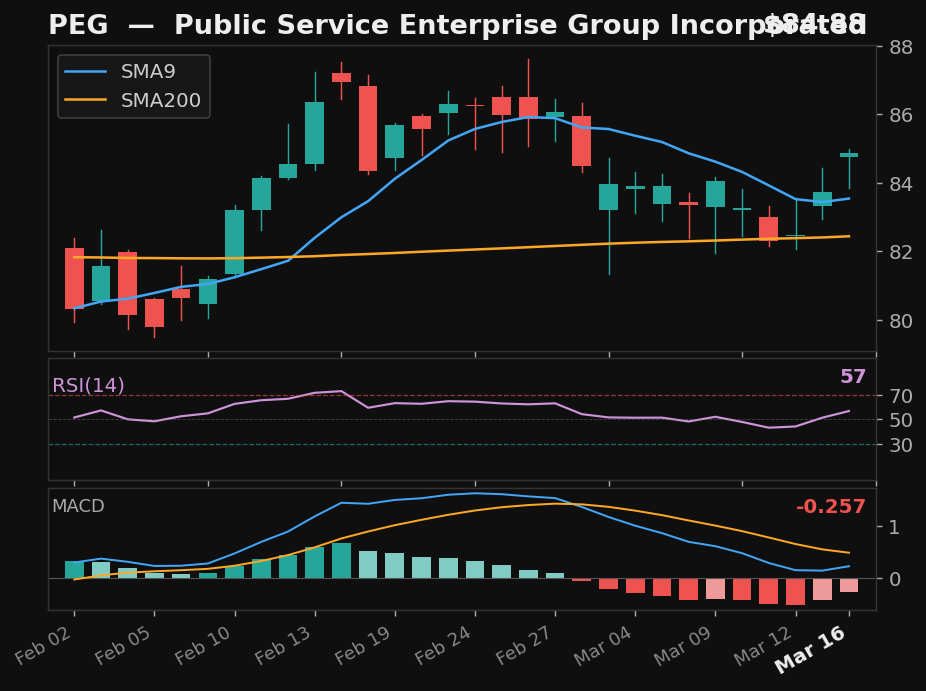
PEG
Public Service Enterprise Group Incorporated
NYSE
- 4.4% pullback to SMA9
- Crossed above SMA9 — 2 days above
- RSI at 57, rising
- MACD histogram improving
Base✓Strict✓Score83.0
Returns
StockMktDiff
1D-0.2%+0.3%-0.4%
2D-0.8%-1.1%+0.3%
3D-2.5%-1.4%-1.1%
5D-6.0%-2.0%-3.9%
10D———
 click to enlarge
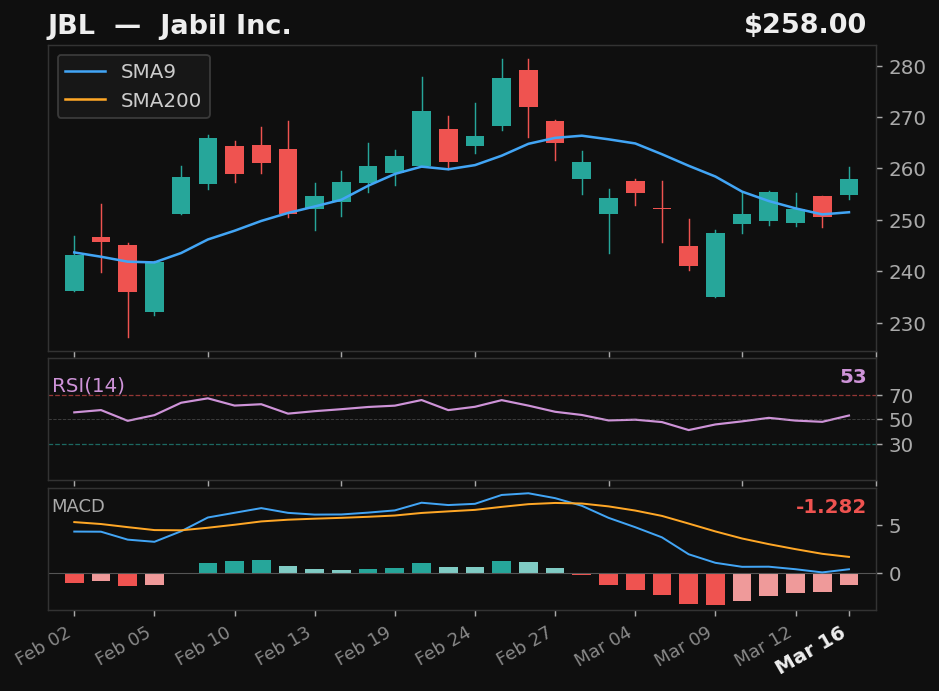
JBL
Jabil Inc.
NYSE
- Quick 11.3% pullback to SMA9 — 2 days
- Crossed back above SMA9 today
- RSI at 53, rising
- MACD histogram improving
Base✓Strict✓Score81.0
Returns
StockMktDiff
1D+1.7%+0.3%+1.4%
2D+0.3%-1.1%+1.4%
3D+2.8%-1.4%+4.2%
5D+3.2%-2.0%+5.2%
10D———
 click to enlarge
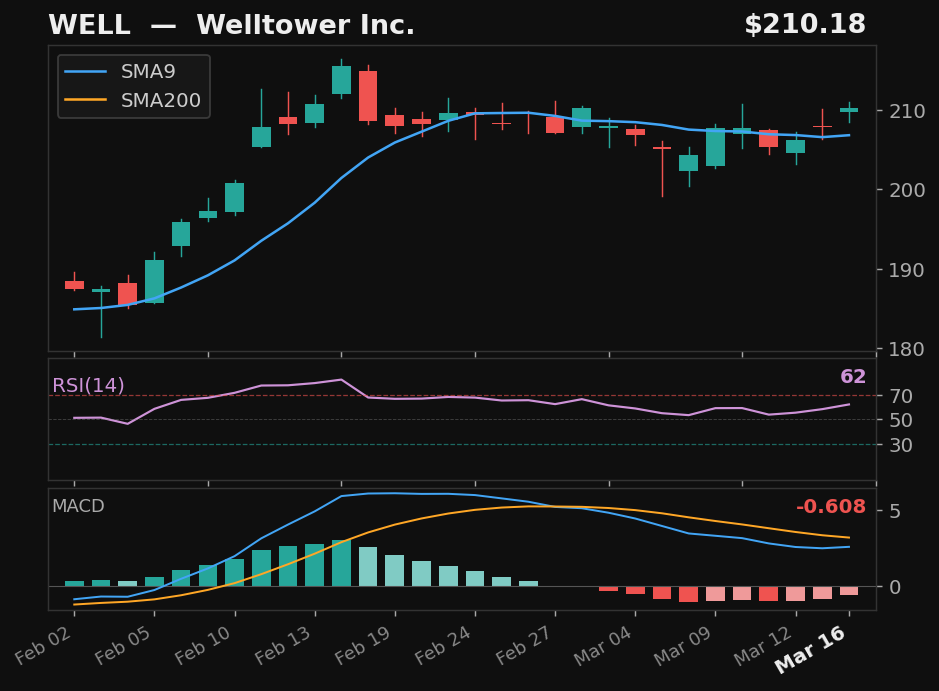
WELL
Welltower Inc.
NYSE
- 2.8% pullback to SMA9
- Crossed above SMA9 — 2 days above
- RSI at 62, rising
- MACD histogram improving
Base✓Strict✓Score81.0
Returns
StockMktDiff
1D+1.4%+0.3%+1.2%
2D-0.5%-1.1%+0.7%
3D-1.9%-1.4%-0.6%
5D-7.2%-2.0%-5.2%
10D———
click to enlarge
FIX
Comfort Systems USA, Inc.
NYSE
- Quick 11.1% pullback to SMA9 — 2 days
- Crossed back above SMA9 today
- RSI at 57, rising
- MACD histogram improving
Base✓Strict✓Score80.0
Returns
StockMktDiff
1D+0.7%+0.3%+0.5%
2D+0.6%-1.1%+1.8%
3D+2.2%-1.4%+3.5%
5D-0.4%-2.0%+1.6%
10D———
 click to enlarge
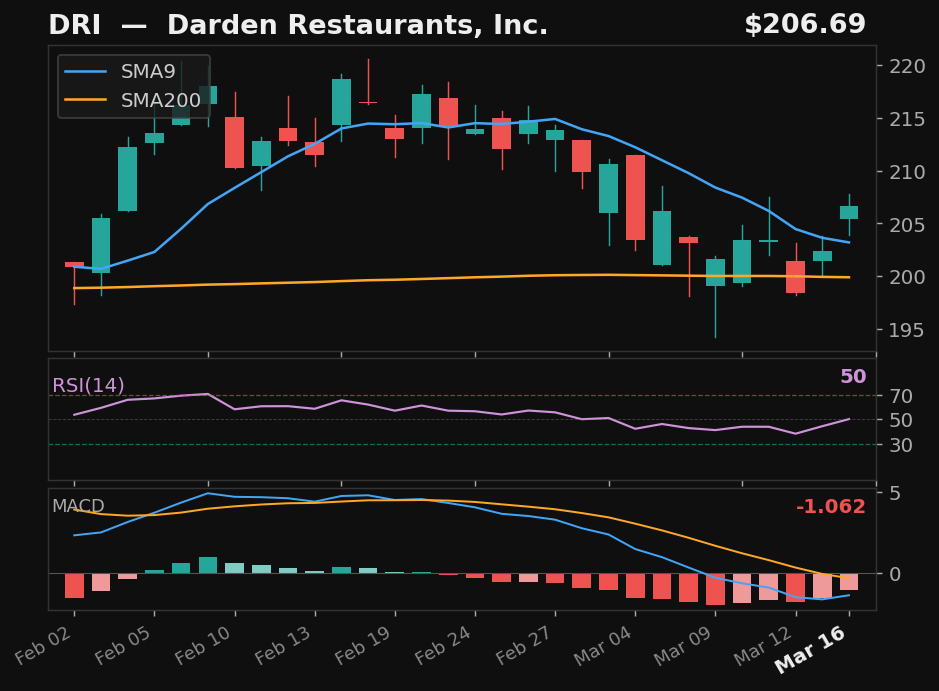
DRI
Darden Restaurants, Inc.
NYSE
- 7.6% pullback to SMA9 over 11 days
- Crossed back above SMA9 today
- RSI at 50, rising
- MACD histogram improving
Base✓Strict✓Score79.0
Returns
StockMktDiff
1D-1.4%+0.3%-1.6%
2D-2.9%-1.1%-1.8%
3D-1.1%-1.4%+0.3%
5D-5.2%-2.0%-3.1%
10D———
 click to enlarge
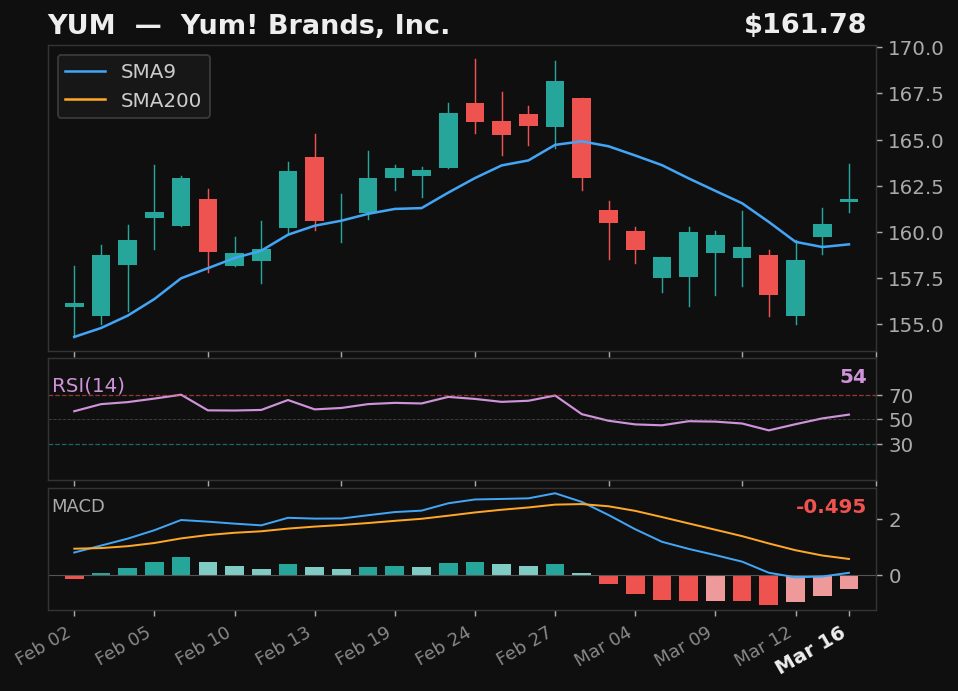
YUM
Yum! Brands, Inc.
NYSE
- 6.9% pullback to SMA9
- Crossed above SMA9 — 2 days above
- RSI at 54, rising
- MACD histogram improving
Base✓Strict✓Score78.0
Returns
StockMktDiff
1D+1.2%+0.3%+0.9%
2D-1.7%-1.1%-0.5%
3D-3.4%-1.4%-2.0%
5D-2.0%-2.0%+0.0%
10D———
Alternative Setups
3 candidates · ranked by Empirical Score
 click to enlarge
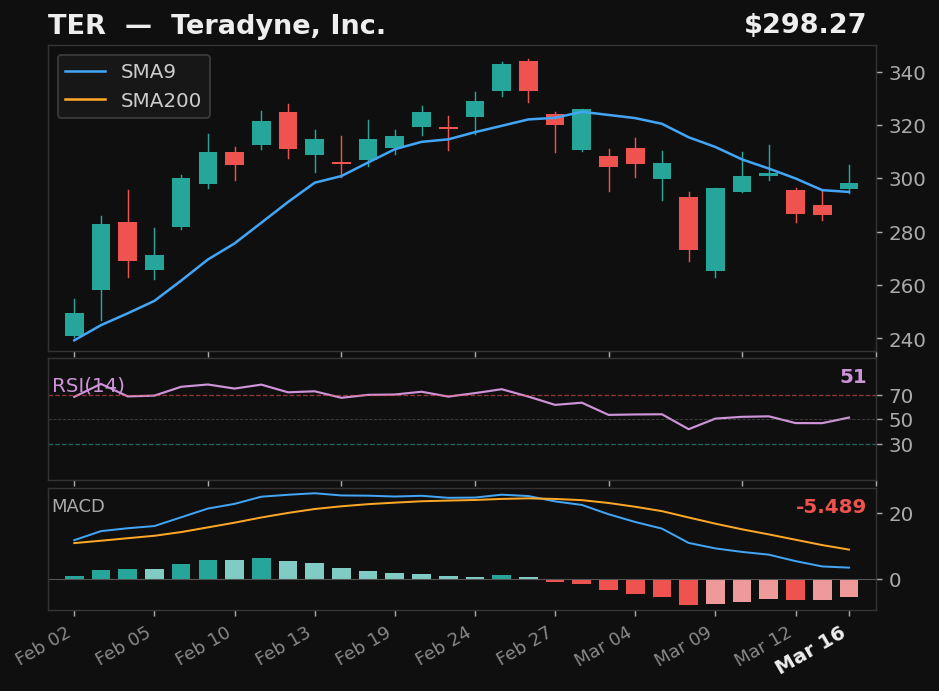
TER
Teradyne, Inc.
NASDAQ
- 17.9% pullback over 9 days — full candle above SMA9
- RSI at 51, rising above 50
- MACD histogram rising while still negative — early recovery signal
- 77.7% above SMA200 — extended from trend
Emp Score65.2Body Above✓
Returns
StockMktDiff
1D+0.4%+0.3%+0.1%
2D+0.6%-1.1%+1.7%
3D+1.4%-1.4%+2.8%
5D+1.9%-2.0%+3.9%
10D———
 click to enlarge
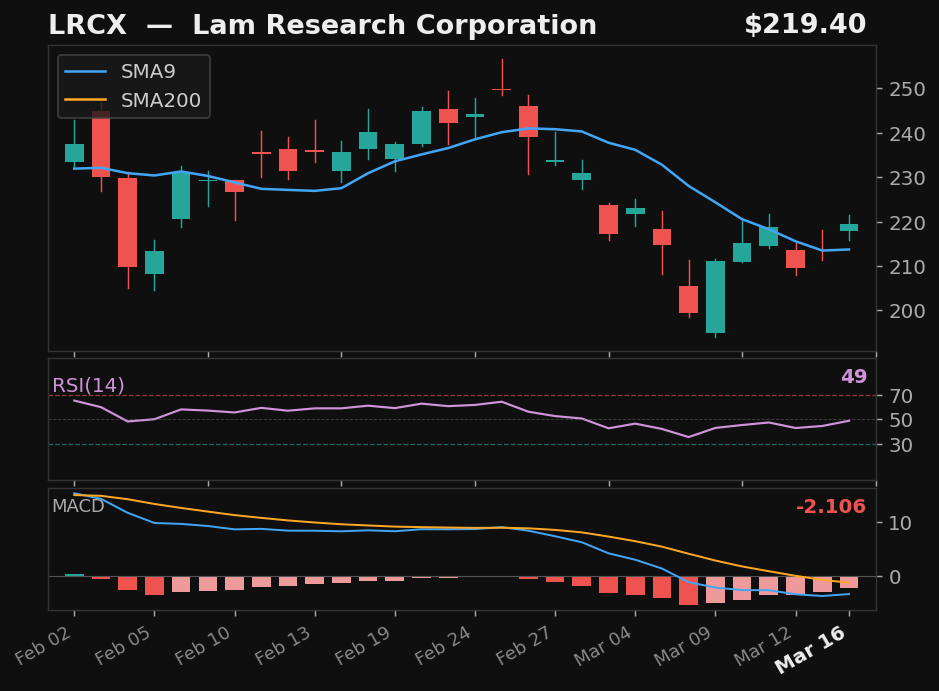
LRCX
Lam Research Corporation
NASDAQ
- 20.1% pullback — full candle body above SMA9
- RSI rising from 49
- MACD histogram rising while still negative — early recovery signal
- 46.8% above SMA200 — extended from trend
Emp Score57.2Body Above✓
Returns
StockMktDiff
1D+3.2%+0.3%+3.0%
2D+2.4%-1.1%+3.6%
3D+6.6%-1.4%+8.0%
5D+6.3%-2.0%+8.4%
10D———
click to enlarge
FIX
Comfort Systems USA, Inc.
NYSE
- 11.1% pullback — full candle body above SMA9
- RSI at 57 — confirmed recovery momentum
- MACD histogram rising while still negative — early recovery signal
- 61.1% above SMA200 — extended from trend
Emp Score48.5Body Above✓
Returns
StockMktDiff
1D+0.7%+0.3%+0.5%
2D+0.6%-1.1%+1.8%
3D+2.2%-1.4%+3.5%
5D-0.4%-2.0%+1.6%
10D———