Tuesday, March 17, 2026 · After Close
SwingTrader Setups
7 candidates
 click to enlarge
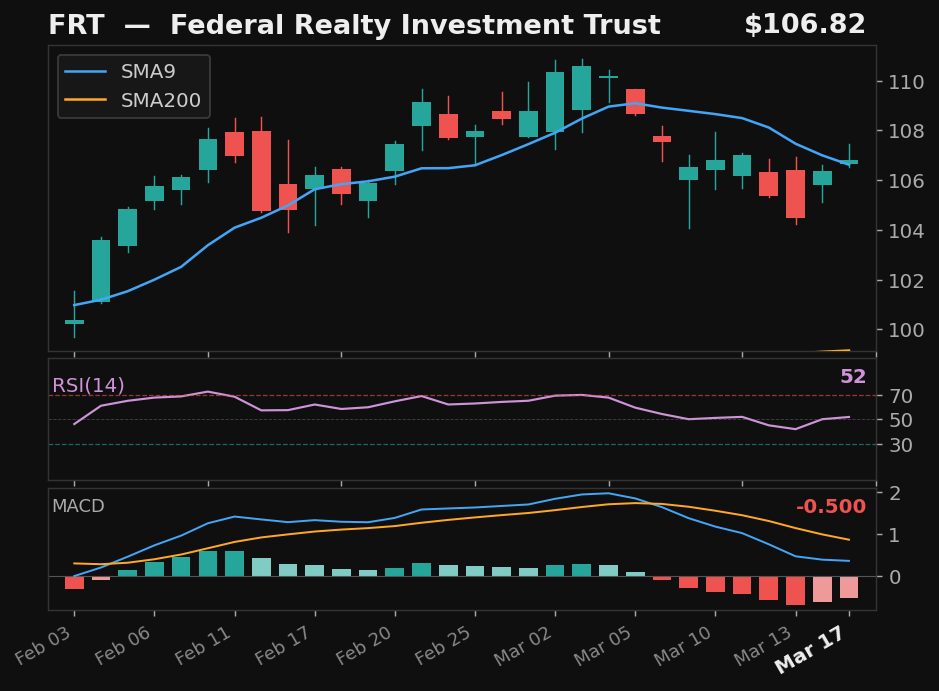
FRT
Federal Realty Investment Trust
NYSE
- 5.2% pullback to SMA9 over 8 days
- Crossed back above SMA9 today
- RSI at 52, rising
- MACD histogram improving
Base✓Strict✓Score88.0
Returns
StockMktDiff
1D-1.2%-1.4%+0.2%
2D-0.5%-1.6%+1.1%
3D-3.4%-3.3%-0.1%
5D-3.5%-2.6%-0.8%
10D———
 click to enlarge
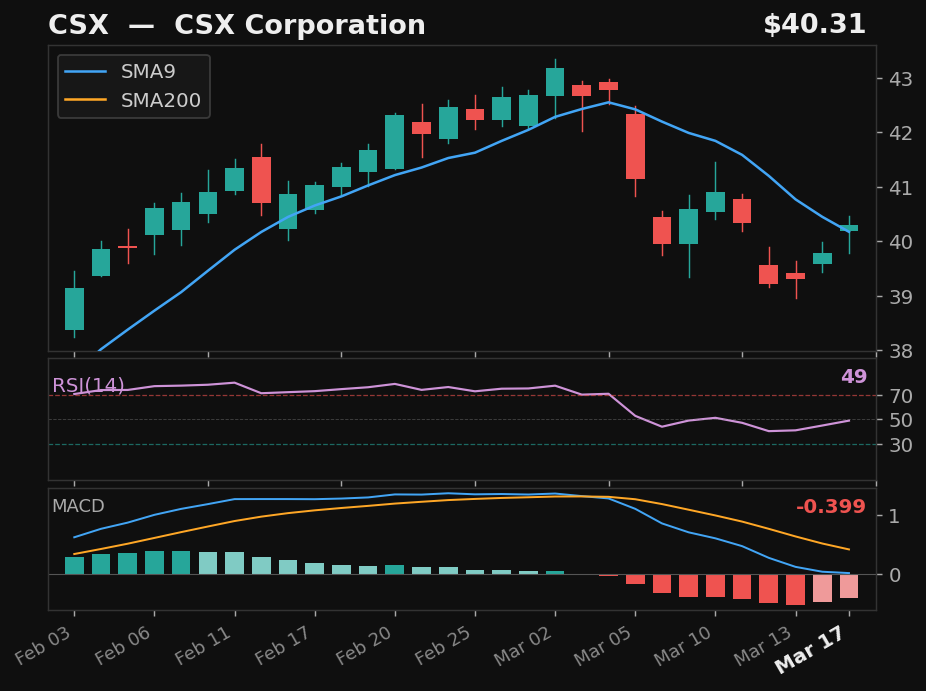
CSX
CSX Corporation
NASDAQ
- 8.3% pullback to SMA9 over 8 days
- Crossed back above SMA9 today
- RSI at 49, rising
- MACD histogram improving
Base✓Strict✓Score81.0
Returns
StockMktDiff
1D-1.7%-1.4%-0.3%
2D-4.5%-1.6%-2.9%
3D-5.3%-3.3%-2.0%
5D-3.6%-2.6%-0.9%
10D———
 click to enlarge
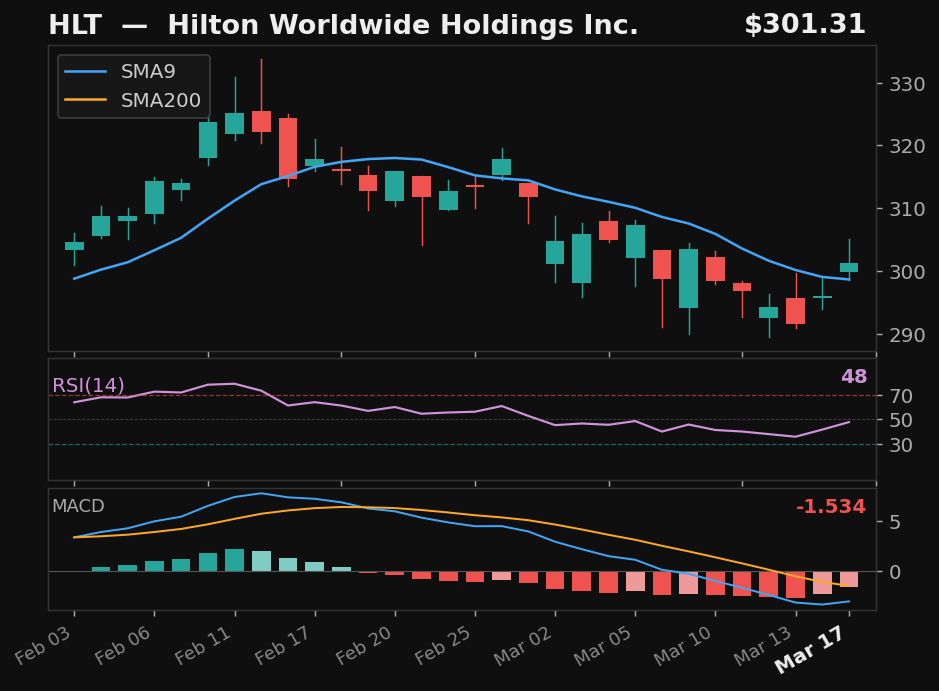
HLT
Hilton Worldwide Holdings Inc.
NYSE
- 8.3% pullback to SMA9 over 12 days
- Crossed back above SMA9 today
- RSI at 48, rising
- MACD histogram improving
Base✓Strict✓Score79.0
Returns
StockMktDiff
1D-2.2%-1.4%-0.8%
2D-1.2%-1.6%+0.5%
3D-2.9%-3.3%+0.4%
5D-0.5%-2.6%+2.2%
10D———
 click to enlarge
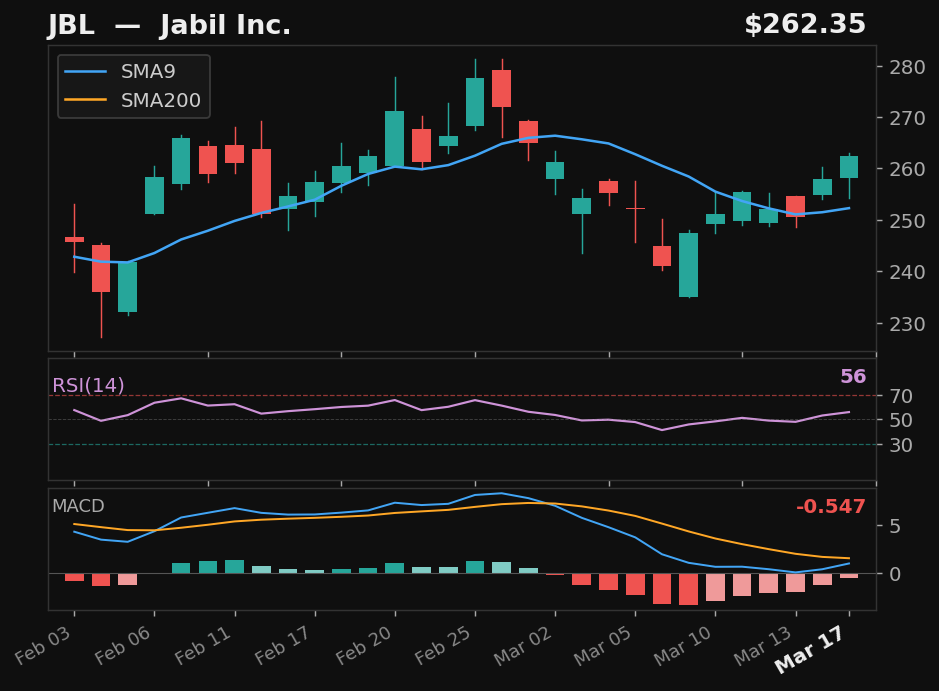
JBL
Jabil Inc.
NYSE
- 11.3% pullback to SMA9
- Crossed above SMA9 — 2 days above
- RSI at 56, rising
- MACD histogram improving
Base✓Strict✓Score75.0
Returns
StockMktDiff
1D-1.4%-1.4%-0.0%
2D+1.1%-1.6%+2.8%
3D-3.3%-3.3%-0.0%
5D+5.7%-2.6%+8.4%
10D———
 click to enlarge
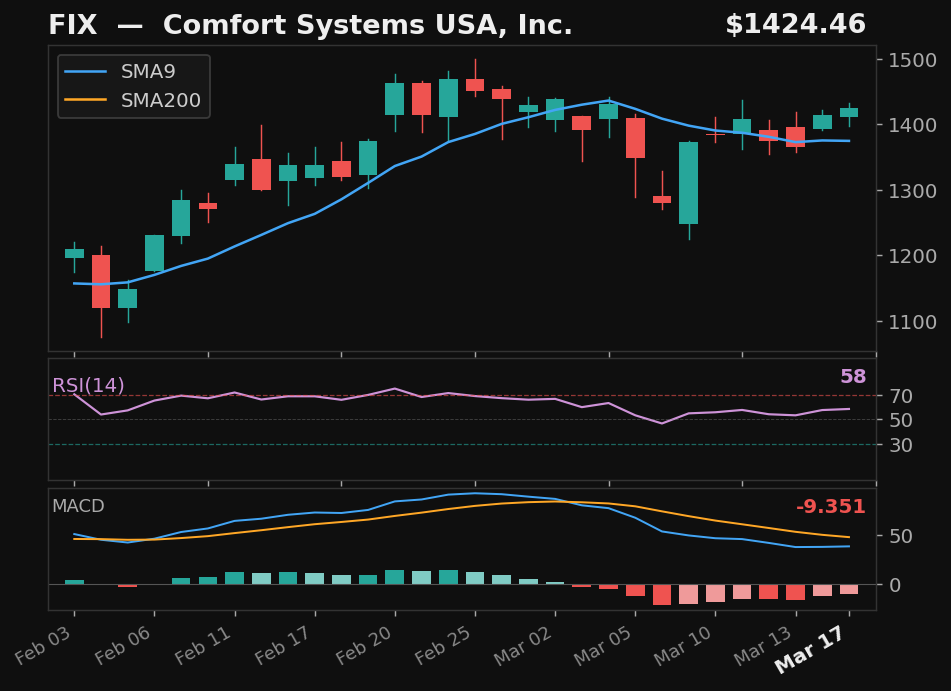
FIX
Comfort Systems USA, Inc.
NYSE
- 11.1% pullback to SMA9
- Crossed above SMA9 — 2 days above
- RSI at 58, rising
- MACD histogram improving
Base✓Strict✓Score74.0
Returns
StockMktDiff
1D-0.1%-1.4%+1.3%
2D+1.4%-1.6%+3.1%
3D-4.8%-3.3%-1.4%
5D+2.6%-2.6%+5.2%
10D———
 click to enlarge
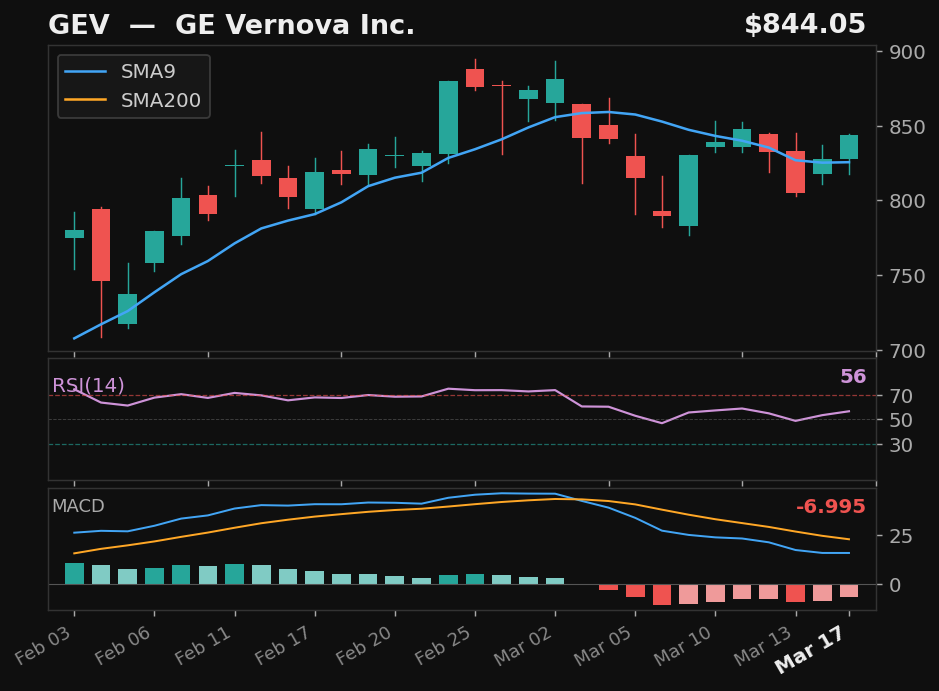
GEV
GE Vernova Inc.
NYSE
- 10.4% pullback to SMA9
- Crossed above SMA9 — 2 days above
- RSI at 56, rising
- MACD histogram improving
Base✓Strict✓Score74.0
Returns
StockMktDiff
1D+1.7%-1.4%+3.1%
2D+4.0%-1.6%+5.6%
3D+0.8%-3.3%+4.1%
5D+7.7%-2.6%+10.4%
10D———
 click to enlarge
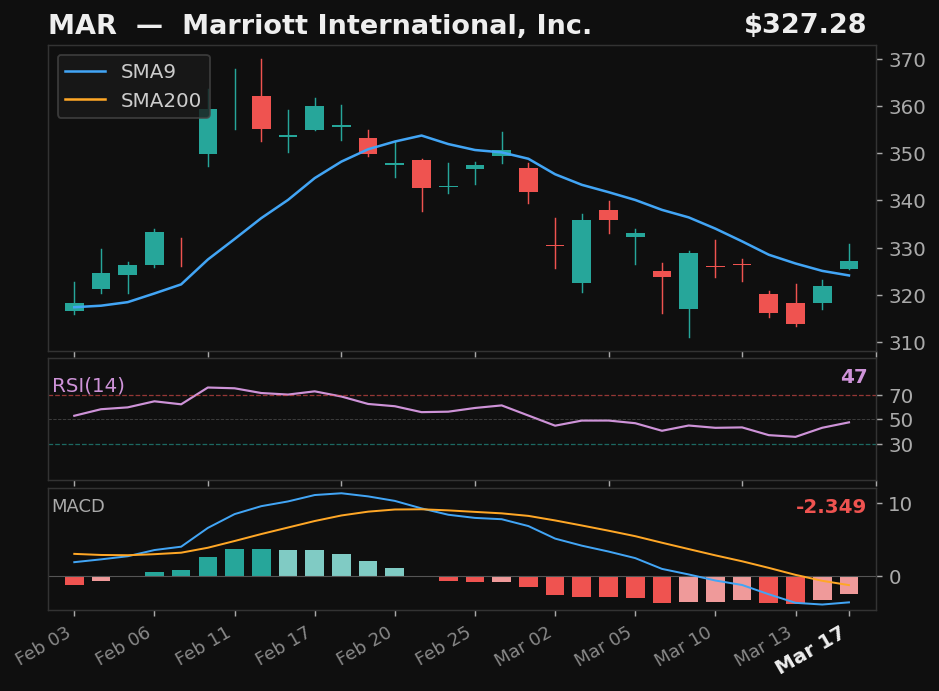
MAR
Marriott International, Inc.
NASDAQ
- 11.9% pullback to SMA9 over 12 days
- Crossed back above SMA9 today
- RSI at 47, rising
- MACD histogram improving
Base✓Strict✓Score74.0
Returns
StockMktDiff
1D-1.5%-1.4%-0.1%
2D-0.7%-1.6%+0.9%
3D-2.3%-3.3%+1.0%
5D-0.9%-2.6%+1.7%
10D———
Alternative Setups
3 candidates · ranked by Empirical Score
 click to enlarge
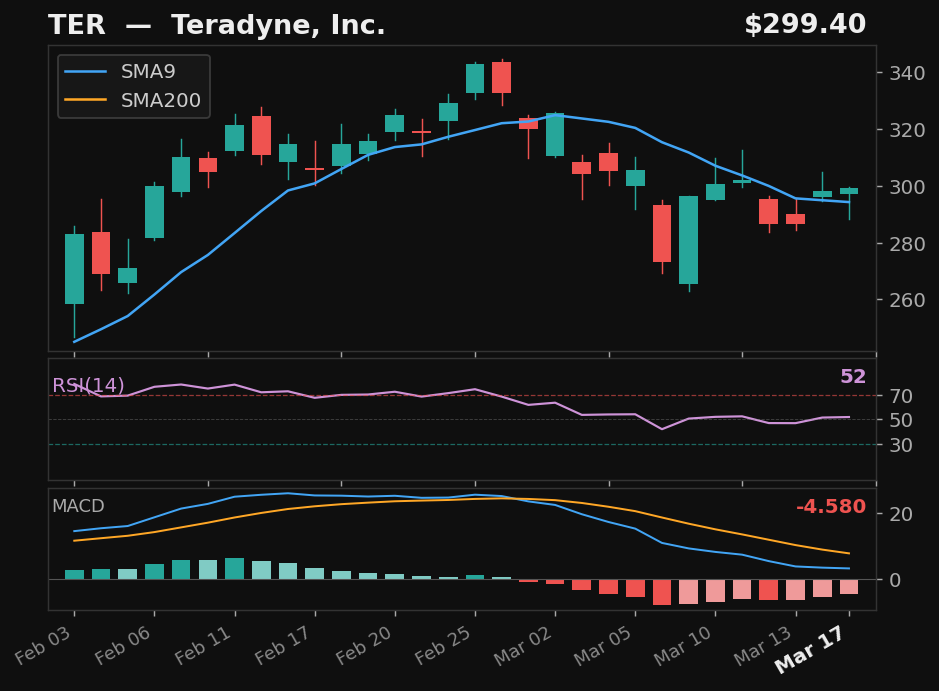
TER
Teradyne, Inc.
NASDAQ
- 17.9% pullback — full candle body above SMA9
- RSI at 52, rising above 50
- MACD histogram rising while still negative — early recovery signal
- 77.3% above SMA200 — extended from trend
Emp Score65.0Body Above✓
Returns
StockMktDiff
1D+0.2%-1.4%+1.6%
2D+1.0%-1.6%+2.6%
3D-2.9%-3.3%+0.5%
5D+6.9%-2.6%+9.6%
10D———
 click to enlarge
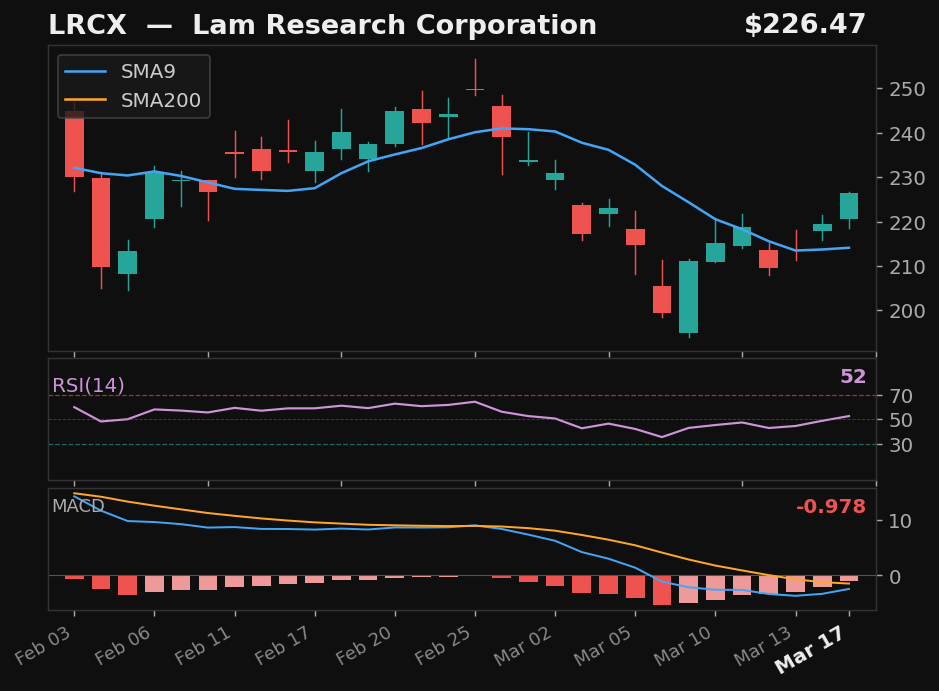
LRCX
Lam Research Corporation
NASDAQ
- 20.1% pullback — full candle body above SMA9
- RSI at 52, rising above 50
- MACD histogram rising while still negative — early recovery signal
- 50.8% above SMA200 — extended from trend
Emp Score61.4Body Above✓
Returns
StockMktDiff
1D-0.8%-1.4%+0.6%
2D+3.3%-1.6%+5.0%
3D+0.8%-3.3%+4.1%
5D+5.5%-2.6%+8.1%
10D———
 click to enlarge
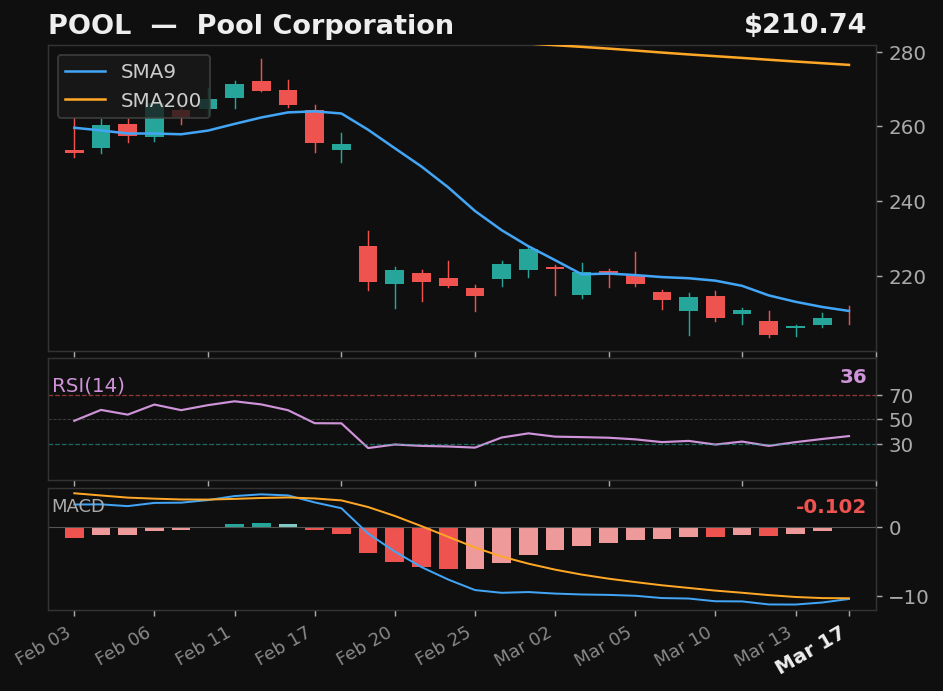
POOL
Pool Corporation
NASDAQ
- 23.2% pullback over 9 days — full candle above SMA9
- RSI rising from 36
- MACD histogram rising while still negative — early recovery signal
- 23.8% below SMA200 — extended from trend
Emp Score56.6Body Above✓
Returns
StockMktDiff
1D-2.4%-1.4%-1.0%
2D-3.0%-1.6%-1.4%
3D-4.9%-3.3%-1.6%
5D-3.6%-2.6%-0.9%
10D———