Wednesday, March 18, 2026 · After Close
SwingTrader Setups
10 candidates
 click to enlarge
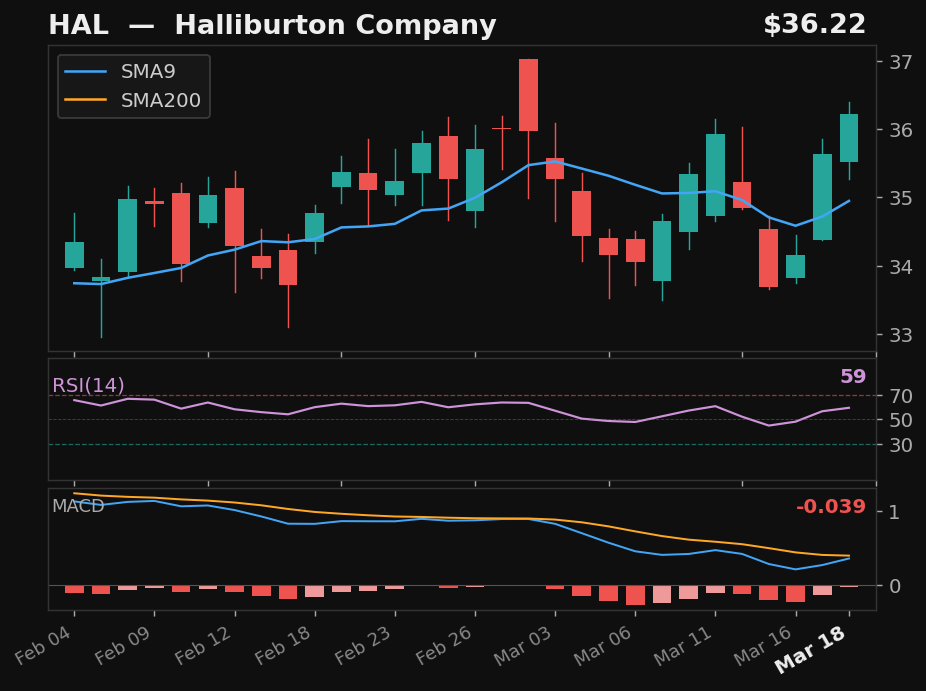
HAL
Halliburton Company
NYSE
- 6.3% pullback to SMA9
- Crossed above SMA9 — 2 days above
- RSI at 59, rising
- MACD histogram improving
Base✓Strict✓Score78.0
Returns
StockMktDiff
1D+2.0%-0.2%+2.2%
2D+0.9%-1.9%+2.8%
3D+3.6%-0.9%+4.5%
5D+6.7%-0.7%+7.4%
10D———
 click to enlarge
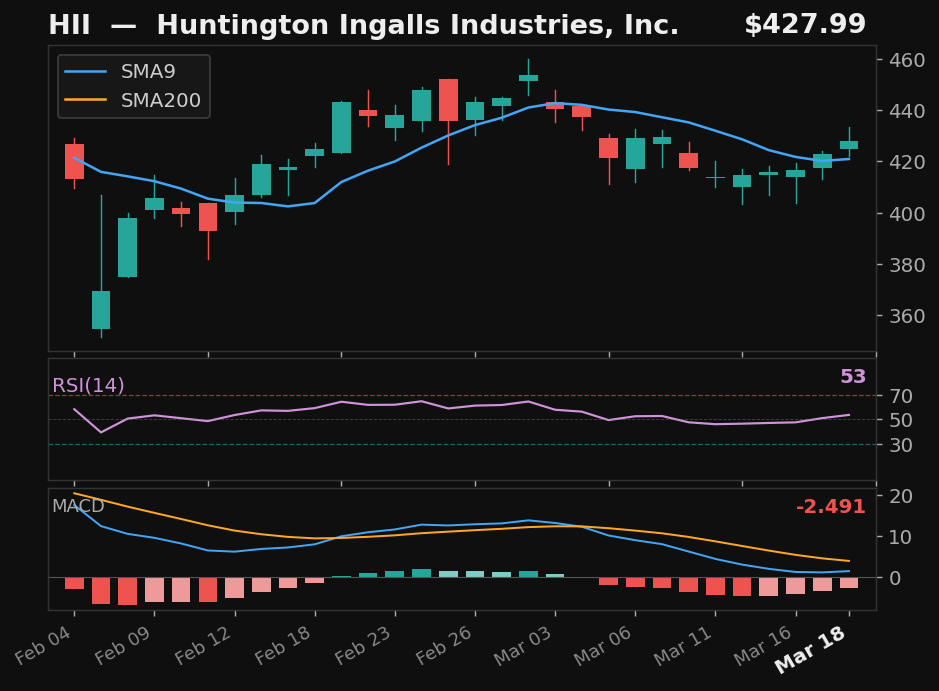
HII
Huntington Ingalls Industries, Inc.
NYSE
- 8.8% pullback to SMA9
- Crossed above SMA9 — 2 days above
- RSI at 53, rising
- MACD histogram improving
Base✓Strict✓Score78.0
Returns
StockMktDiff
1D-2.2%-0.2%-2.0%
2D-4.7%-1.9%-2.7%
3D-7.3%-0.9%-6.4%
5D-5.9%-0.7%-5.2%
10D———
 click to enlarge
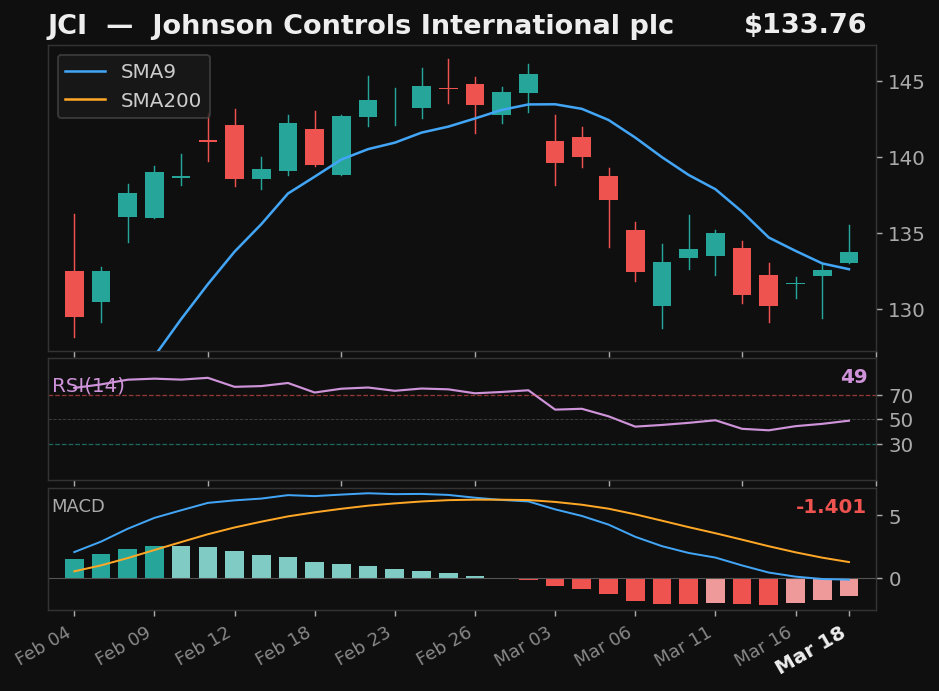
JCI
Johnson Controls International plc
NYSE
- 10.5% pullback to SMA9 over 11 days
- Crossed back above SMA9 today
- RSI at 49, rising
- MACD histogram improving
Base✓Strict✓Score74.0
Returns
StockMktDiff
1D-0.4%-0.2%-0.1%
2D-3.0%-1.9%-1.1%
3D-0.4%-0.9%+0.5%
5D+2.8%-0.7%+3.5%
10D———
 click to enlarge
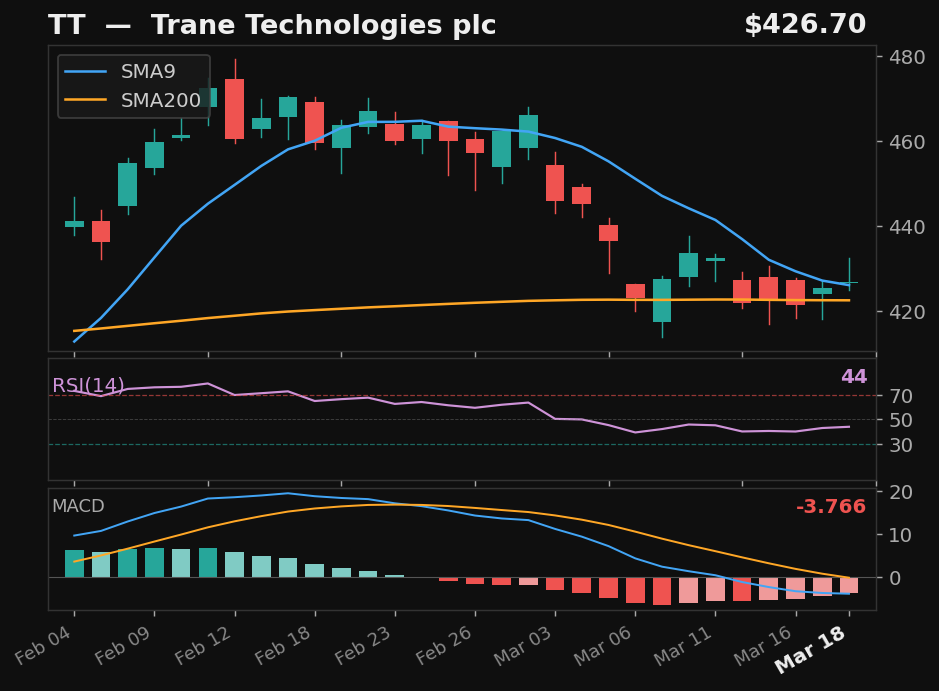
TT
Trane Technologies plc
NYSE
- 10.4% pullback to SMA9 over 11 days
- Crossed back above SMA9 today
- RSI rising from 44 — recovering momentum
- MACD histogram improving
Base✓Strict✓Score74.0
Returns
StockMktDiff
1D-0.9%-0.2%-0.6%
2D-3.8%-1.9%-1.9%
3D-0.4%-0.9%+0.5%
5D+1.7%-0.7%+2.4%
10D———
 click to enlarge
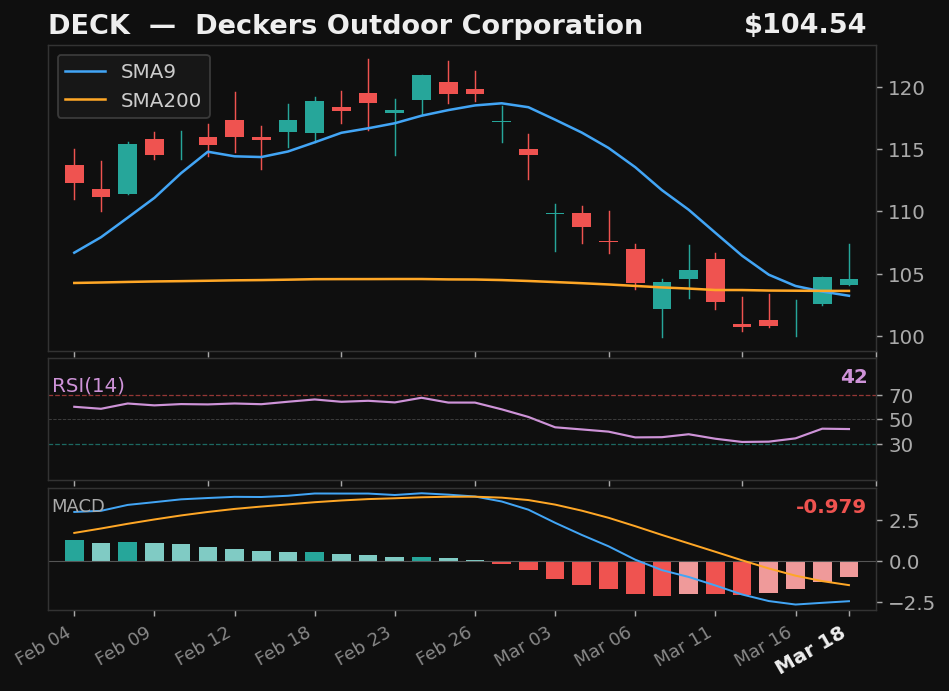
DECK
Deckers Outdoor Corporation
NYSE
- 15.7% pullback to SMA9
- Crossed above SMA9 — 2 days above
- MACD histogram improving
Base✓Strict✓Score61.0
Returns
StockMktDiff
1D+0.4%-0.2%+0.6%
2D-3.9%-1.9%-2.0%
3D-2.0%-0.9%-1.1%
5D-4.3%-0.7%-3.6%
10D———
 click to enlarge
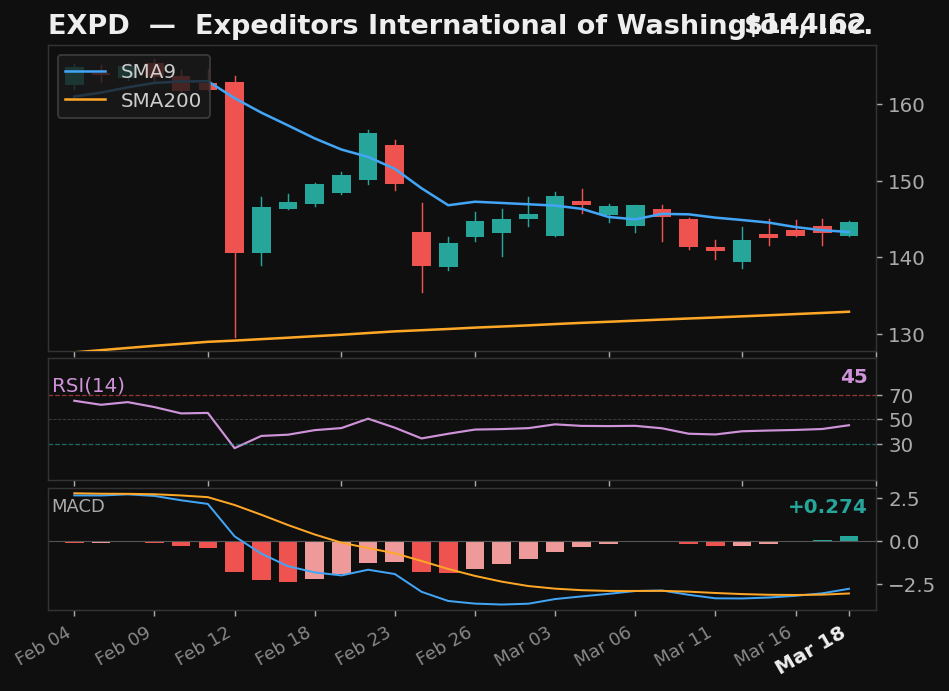
EXPD
Expeditors International of Washington, Inc.
NYSE
- 4.1% pullback to SMA9 over 7 days
- Crossed back above SMA9 today
- RSI at 45, rising
- MACD bullish cross 1 day ago
Base✓Strict✗Score76.0
Returns
StockMktDiff
1D+1.8%-0.2%+2.1%
2D+1.2%-1.9%+3.1%
3D-2.8%-0.9%-1.9%
5D-1.0%-0.7%-0.3%
10D———
 click to enlarge
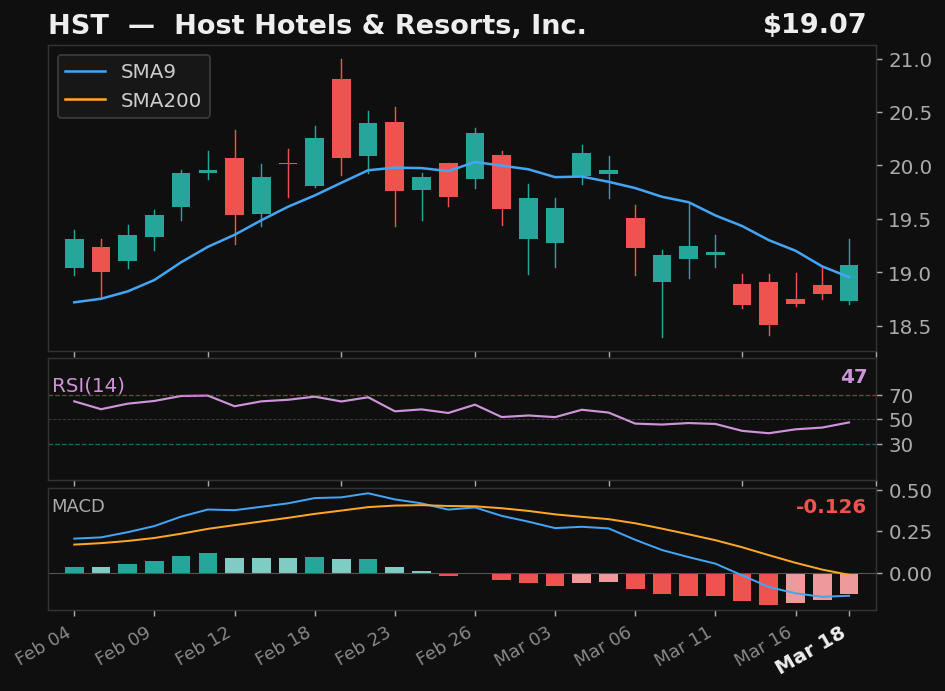
HST
Host Hotels & Resorts, Inc.
NASDAQ
- 7.3% pullback to SMA9 over 8 days
- Crossed back above SMA9 today
- RSI at 47, rising
- MACD histogram improving
Base✓Strict✗Score67.0
Returns
StockMktDiff
1D+0.2%-0.2%+0.4%
2D-2.5%-1.9%-0.5%
3D+0.4%-0.9%+1.3%
5D+2.1%-0.7%+2.8%
10D———
 click to enlarge
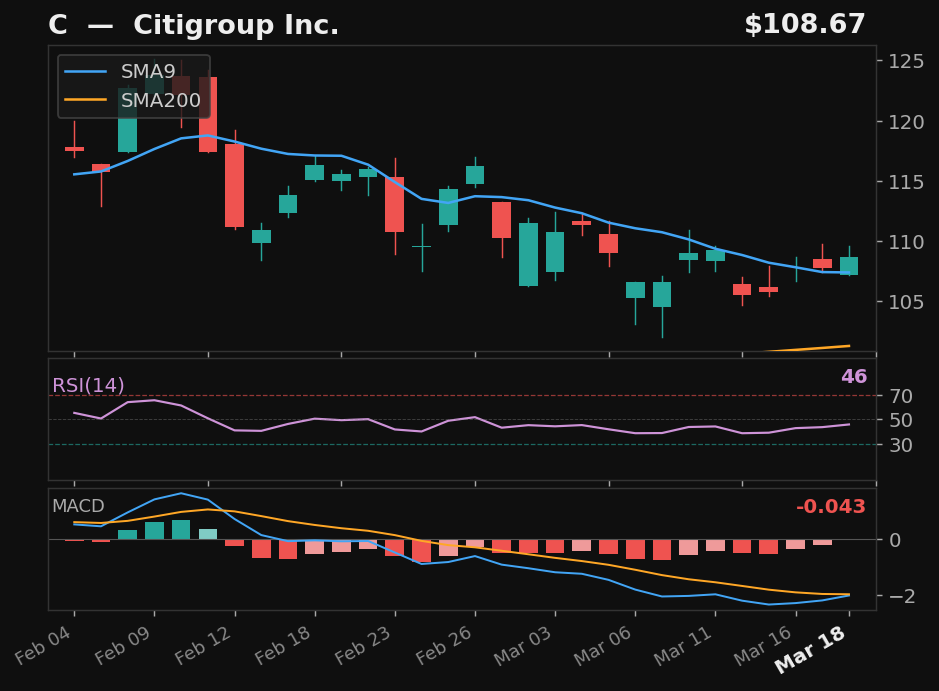
C
Citigroup Inc.
NYSE
- 9.2% pullback to SMA9
- Crossed above SMA9 — 2 days above
- RSI at 46, rising
- MACD histogram improving
Base✓Strict✗Score59.0
Returns
StockMktDiff
1D+1.1%-0.2%+1.3%
2D+0.8%-1.9%+2.7%
3D+2.7%-0.9%+3.6%
5D+5.3%-0.7%+6.0%
10D———
 click to enlarge
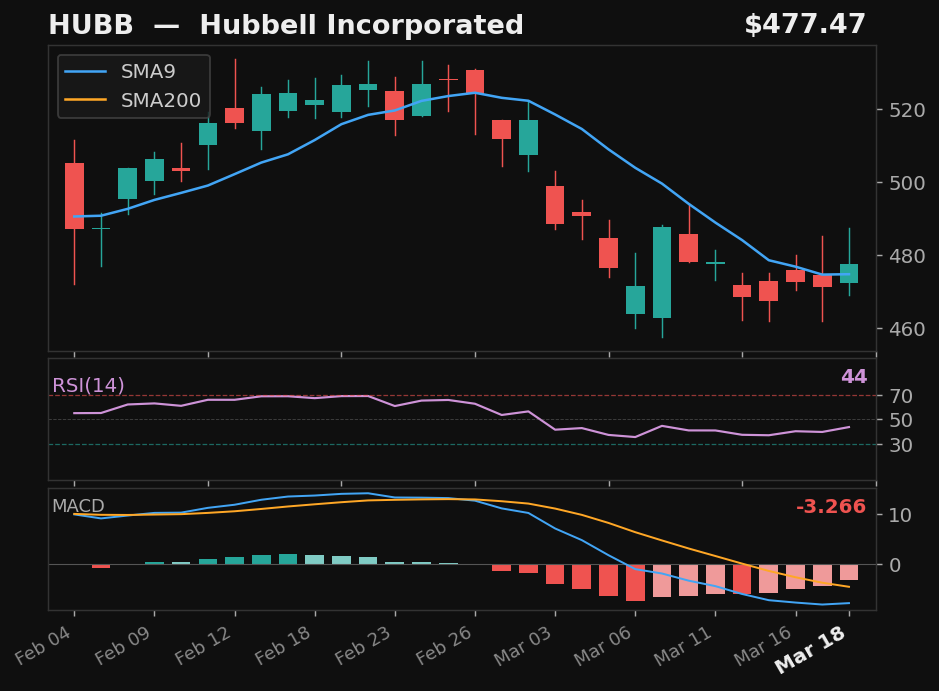
HUBB
Hubbell Incorporated
NYSE
- 11.5% pullback to SMA9 over 14 days
- Crossed back above SMA9 today
- RSI rising from 44 — recovering momentum
- MACD histogram improving
Base✓Strict✗Score57.0
Returns
StockMktDiff
1D+3.2%-0.2%+3.4%
2D-0.4%-1.9%+1.6%
3D+2.4%-0.9%+3.3%
5D+5.4%-0.7%+6.1%
10D———
 click to enlarge
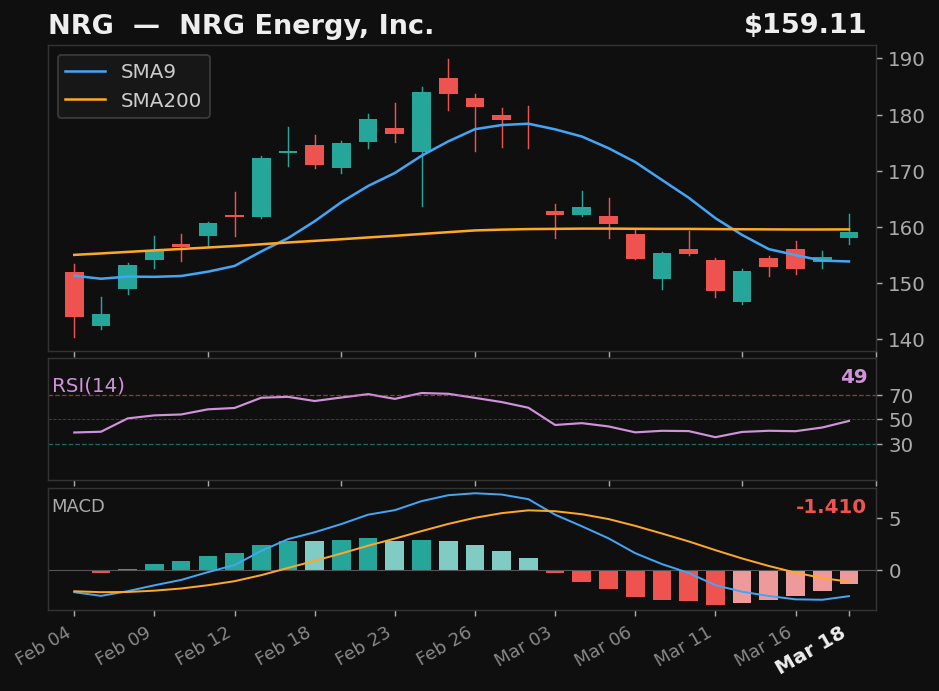
NRG
NRG Energy, Inc.
NYSE
- 16.9% pullback to SMA9
- Crossed above SMA9 — 2 days above
- RSI at 49, rising
- MACD histogram improving
Base✓Strict✗Score55.0
Returns
StockMktDiff
1D+1.4%-0.2%+1.7%
2D-8.4%-1.9%-6.4%
3D-4.6%-0.9%-3.7%
5D-5.1%-0.7%-4.4%
10D———
Alternative Setups
3 candidates · ranked by Empirical Score
 click to enlarge
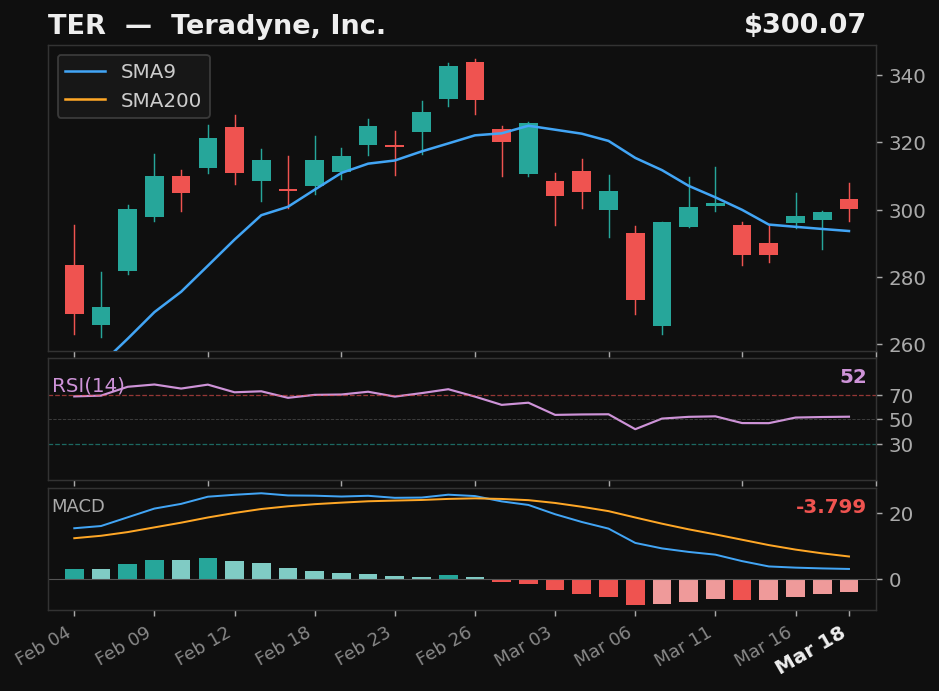
TER
Teradyne, Inc.
NASDAQ
- 17.9% pullback — full candle body above SMA9
- RSI at 52, rising above 50
- MACD histogram rising while still negative — early recovery signal
- 76.5% above SMA200 — extended from trend
Emp Score64.8Body Above✓
Returns
StockMktDiff
1D+0.8%-0.2%+1.0%
2D-3.1%-1.9%-1.1%
3D+1.3%-0.9%+2.2%
5D+7.8%-0.7%+8.5%
10D———
 click to enlarge
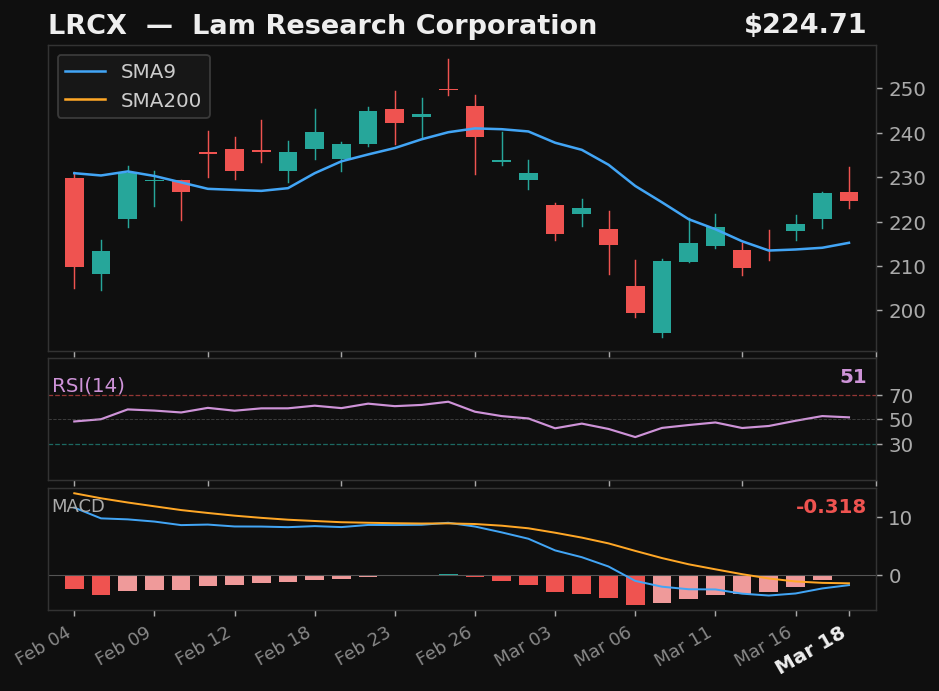
LRCX
Lam Research Corporation
NASDAQ
- 20.1% pullback — full candle body above SMA9
- MACD histogram rising while still negative — early recovery signal
- 48.9% above SMA200 — extended from trend
Emp Score60.9Body Above✓
Returns
StockMktDiff
1D+4.1%-0.2%+4.4%
2D+1.6%-1.9%+3.6%
3D+3.8%-0.9%+4.7%
5D+3.9%-0.7%+4.6%
10D———
 click to enlarge
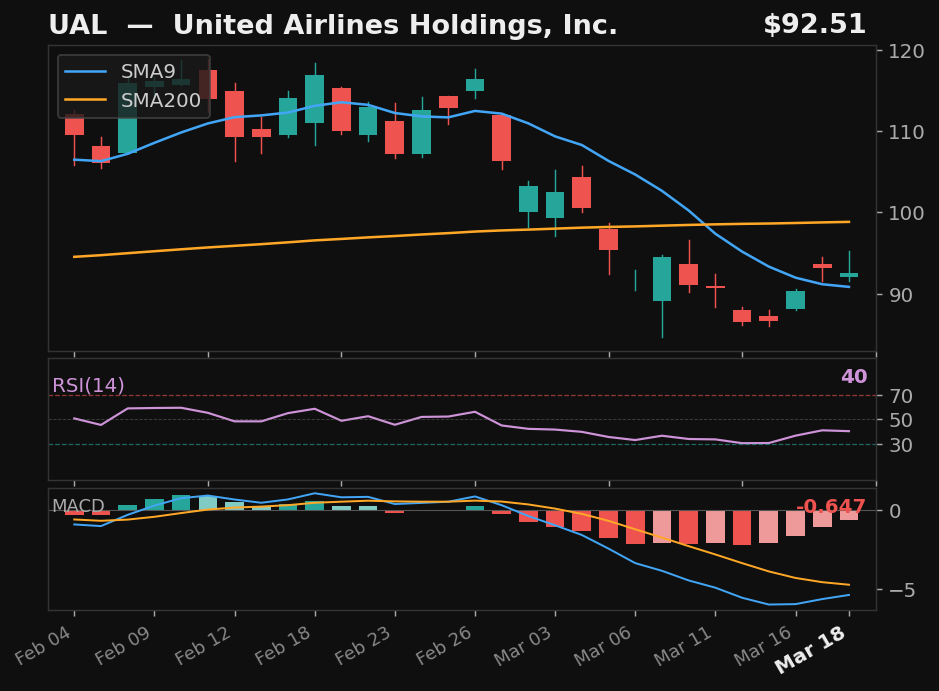
UAL
United Airlines Holdings, Inc.
NASDAQ
- 25.7% pullback — full candle body above SMA9
- MACD histogram rising while still negative — early recovery signal
- 6.4% below SMA200 — extended from trend
Emp Score56.3Body Above✓
Returns
StockMktDiff
1D+1.8%-0.2%+2.0%
2D-2.8%-1.9%-0.8%
3D+1.6%-0.9%+2.5%
5D+0.5%-0.7%+1.2%
10D———