Thursday, March 19, 2026 · After Close
SwingTrader Setups
10 candidates
 click to enlarge
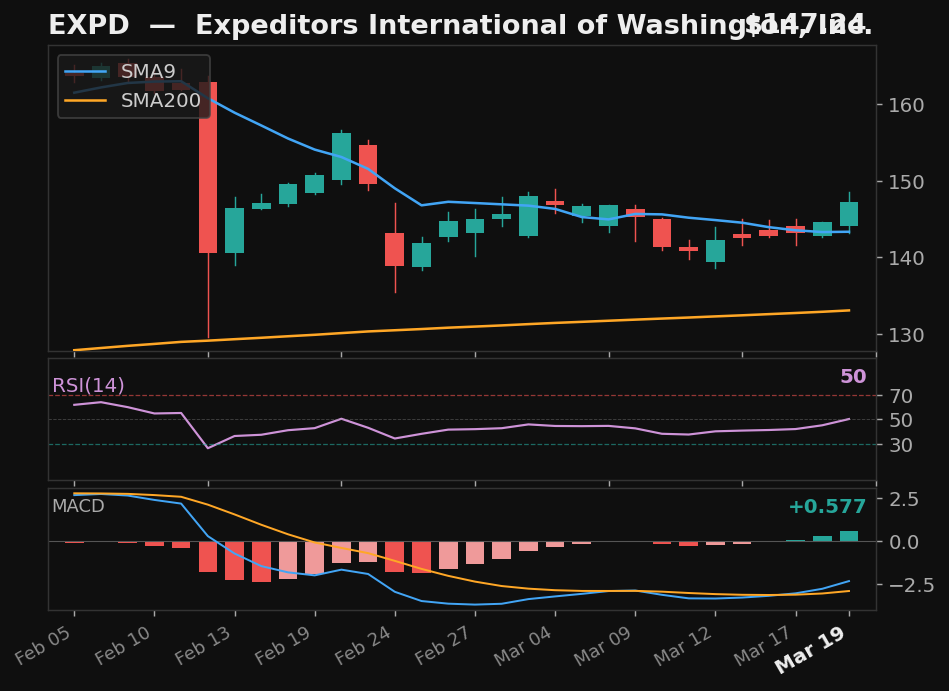
EXPD
Expeditors International of Washington, Inc.
NYSE
- 4.1% pullback to SMA9
- Crossed above SMA9 — 2 days above
- RSI at 50, rising
- MACD bullish cross 2 days ago
Base✓Strict✓Score88.0
Returns
StockMktDiff
1D-0.6%-1.7%+1.1%
2D-4.6%-0.7%-3.9%
3D-3.6%-1.0%-2.6%
5D-3.1%-2.2%-0.9%
10D———
 click to enlarge
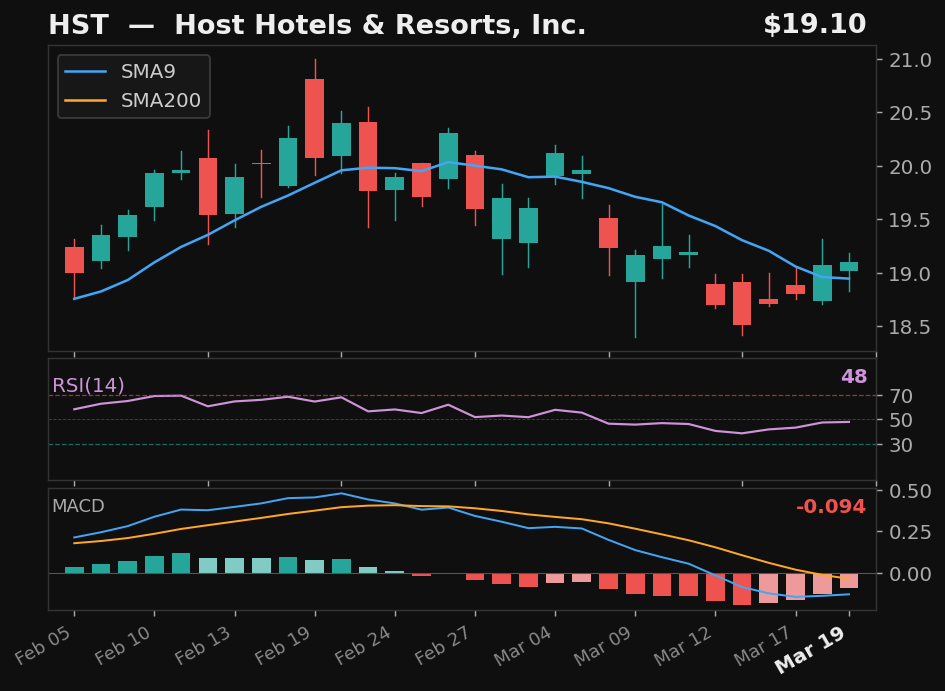
HST
Host Hotels & Resorts, Inc.
NASDAQ
- 7.3% pullback to SMA9
- Crossed above SMA9 — 2 days above
- RSI at 48, rising
- MACD histogram improving
Base✓Strict✓Score78.0
Returns
StockMktDiff
1D-2.6%-1.7%-0.9%
2D+0.2%-0.7%+0.9%
3D-0.7%-1.0%+0.3%
5D+1.7%-2.2%+3.9%
10D———
 click to enlarge
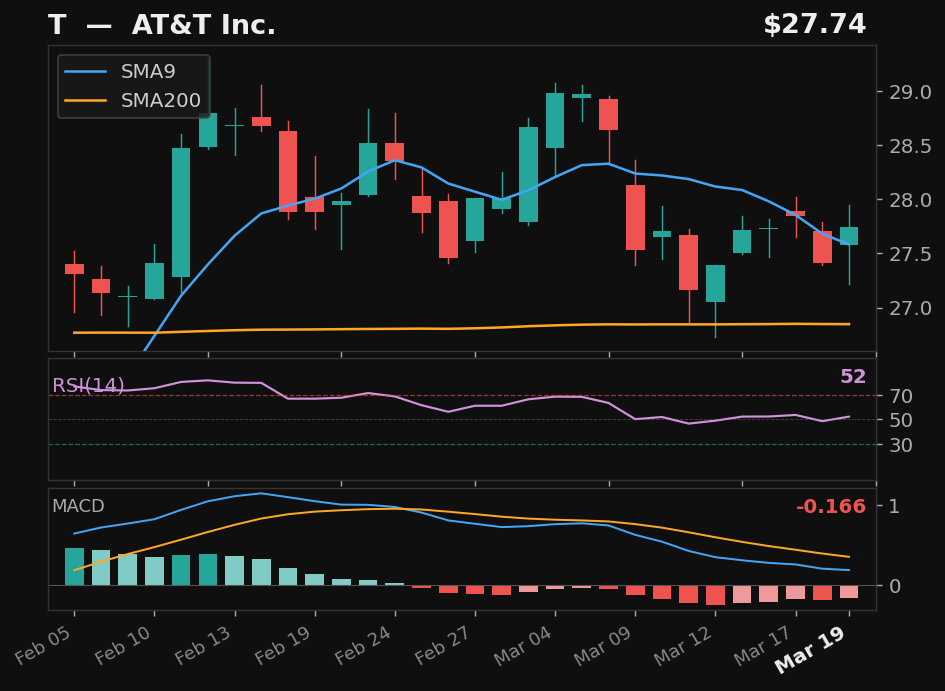
T
AT&T Inc.
NYSE
- 5.2% pullback to SMA9 over 8 days
- Crossed back above SMA9 today
- RSI at 52, rising
- MACD histogram improving
Base✓Strict✗Score71.0
Returns
StockMktDiff
1D+2.1%-1.7%+3.8%
2D+3.7%-0.7%+4.3%
3D+4.1%-1.0%+5.1%
5D+4.3%-2.2%+6.5%
10D———
 click to enlarge
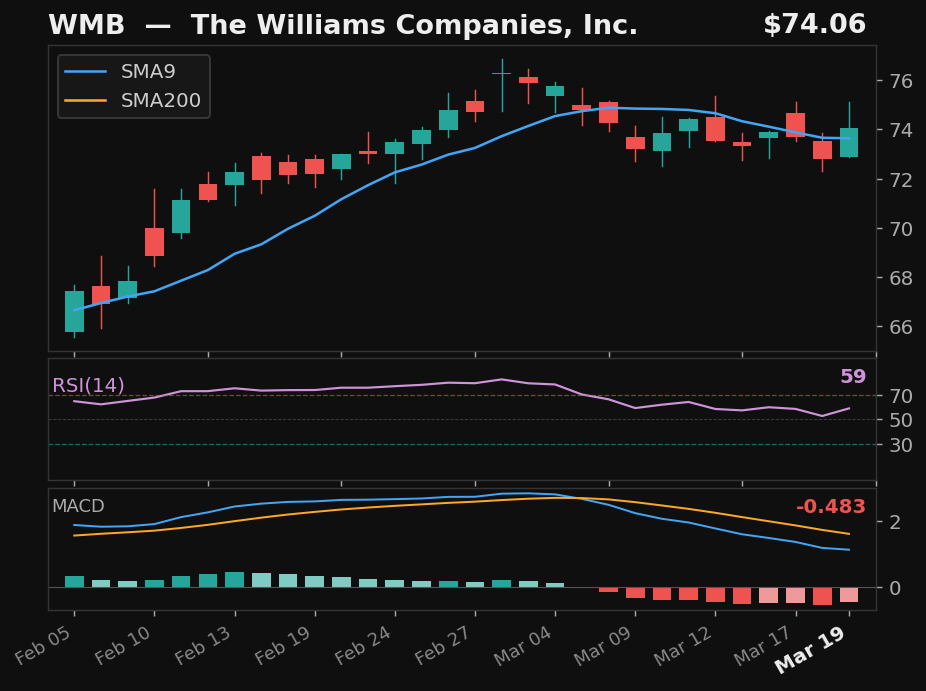
WMB
The Williams Companies, Inc.
NYSE
- 2.6% pullback to SMA9 over 9 days
- Crossed back above SMA9 today
- RSI at 59, rising
- MACD histogram improving
Base✓Strict✗Score66.0
Returns
StockMktDiff
1D-2.2%-1.7%-0.5%
2D-0.6%-0.7%+0.0%
3D+0.5%-1.0%+1.5%
5D-0.0%-2.2%+2.2%
10D———
 click to enlarge
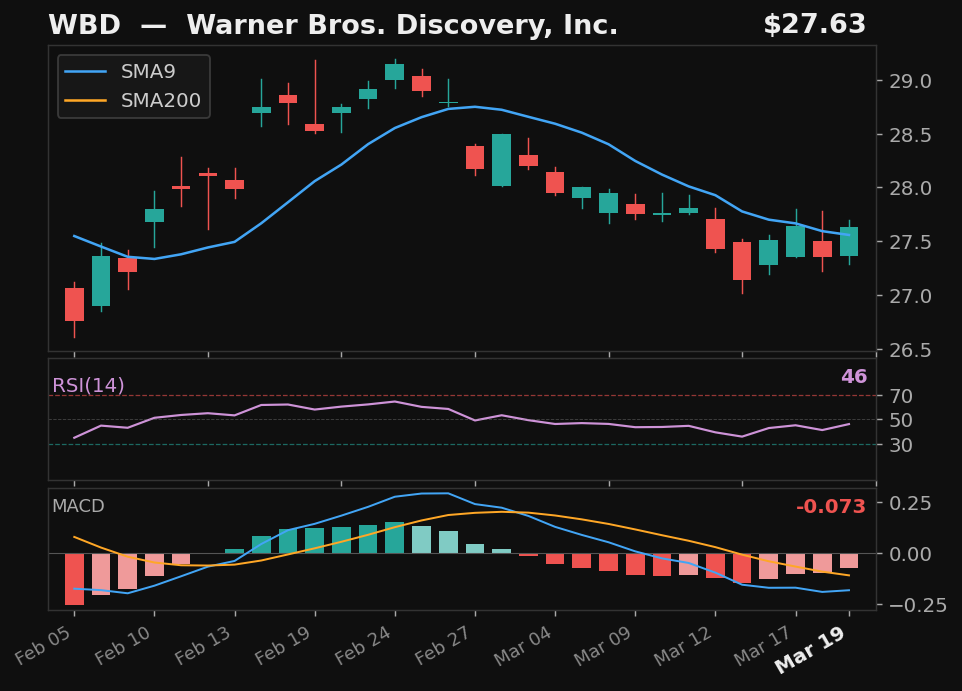
WBD
Warner Bros. Discovery, Inc.
NASDAQ
- 5.8% pullback to SMA9 over 14 days
- Crossed back above SMA9 today
- RSI at 46, rising
- MACD histogram improving
Base✓Strict✗Score64.0
Returns
StockMktDiff
1D-0.8%-1.7%+0.9%
2D-0.8%-0.7%-0.2%
3D-1.3%-1.0%-0.3%
5D-2.0%-2.2%+0.2%
10D———
 click to enlarge
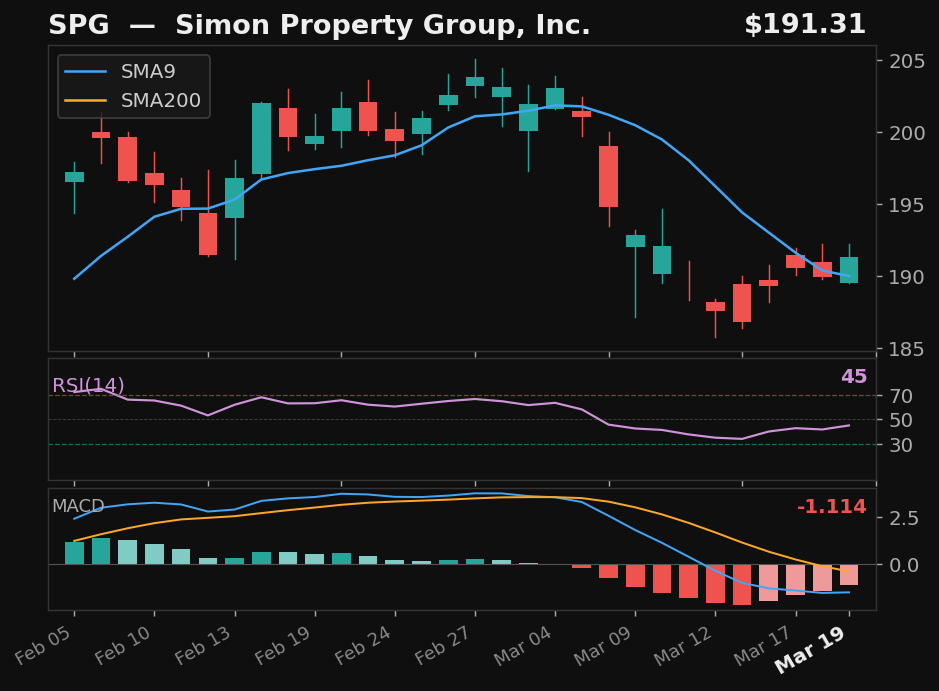
SPG
Simon Property Group, Inc.
NYSE
- 8.0% pullback to SMA9 over 10 days
- Crossed back above SMA9 today
- RSI rising from 45 — recovering momentum
- MACD histogram improving
Base✓Strict✗Score63.0
Returns
StockMktDiff
1D-3.5%-1.7%-1.8%
2D-5.1%-0.7%-4.5%
3D-6.8%-1.0%-5.8%
5D-5.0%-2.2%-2.7%
10D———
 click to enlarge
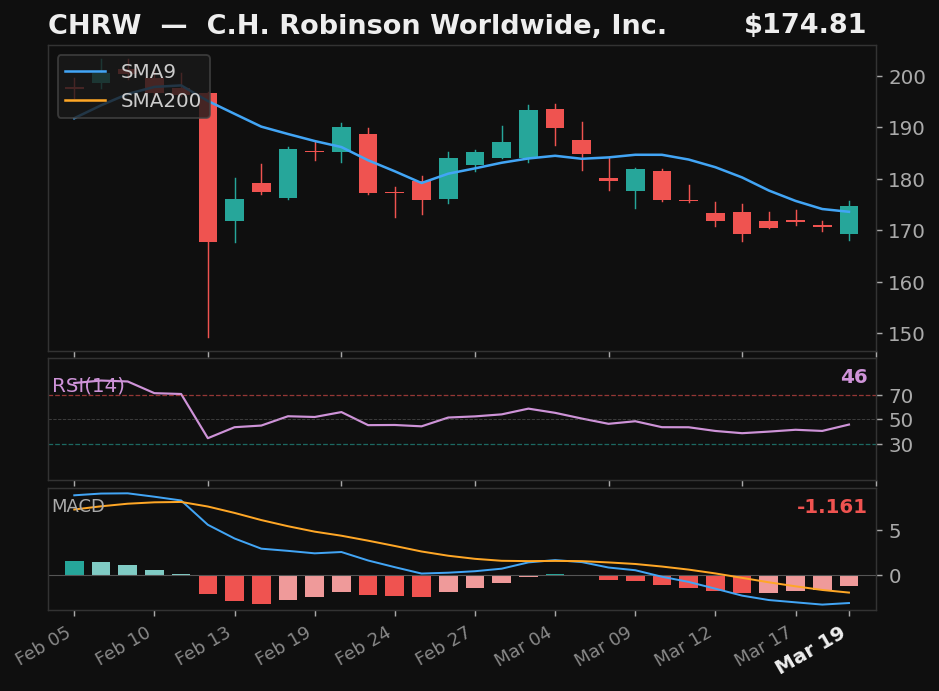
CHRW
C.H. Robinson Worldwide, Inc.
NASDAQ
- 8.3% pullback to SMA9 over 9 days
- Crossed back above SMA9 today
- RSI at 46, rising
- MACD histogram improving
Base✓Strict✗Score62.0
Returns
StockMktDiff
1D-3.4%-1.7%-1.7%
2D-4.6%-0.7%-3.9%
3D-3.2%-1.0%-2.2%
5D-4.1%-2.2%-1.9%
10D———
 click to enlarge
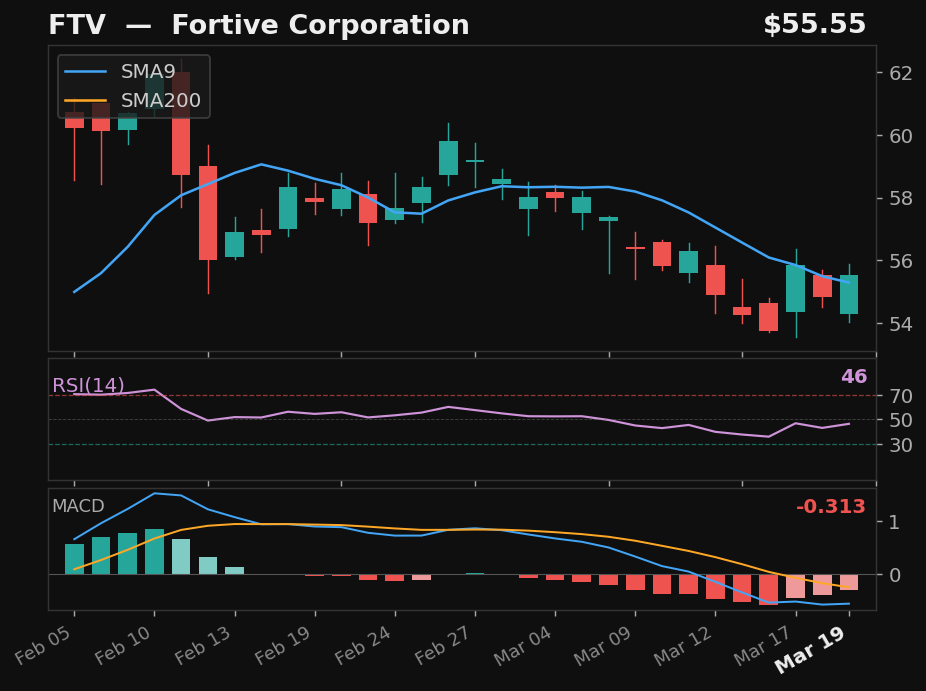
FTV
Fortive Corporation
NYSE
- 8.2% pullback to SMA9 over 12 days
- Crossed back above SMA9 today
- RSI at 46, rising
- MACD histogram improving
Base✓Strict✗Score62.0
Returns
StockMktDiff
1D-0.6%-1.7%+1.1%
2D-0.3%-0.7%+0.4%
3D-1.2%-1.0%-0.2%
5D-1.3%-2.2%+0.9%
10D———
 click to enlarge
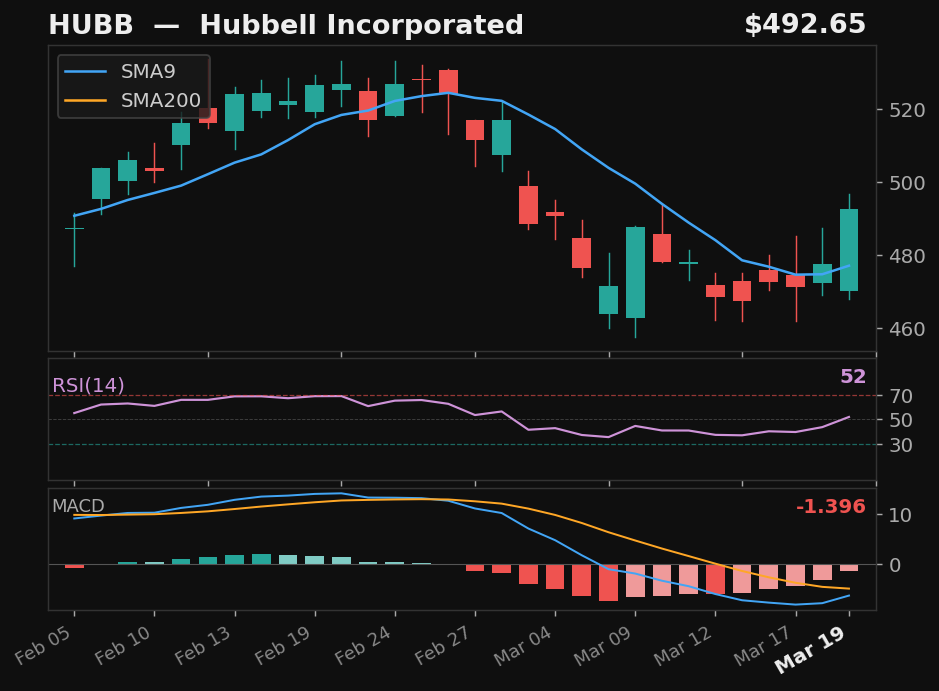
HUBB
Hubbell Incorporated
NYSE
- 11.5% pullback to SMA9
- Crossed above SMA9 — 2 days above
- RSI at 52, rising
- MACD histogram improving
Base✓Strict✗Score60.0
Returns
StockMktDiff
1D-3.4%-1.7%-1.7%
2D-0.7%-0.7%-0.1%
3D+2.6%-1.0%+3.6%
5D-2.2%-2.2%+0.0%
10D———
 click to enlarge
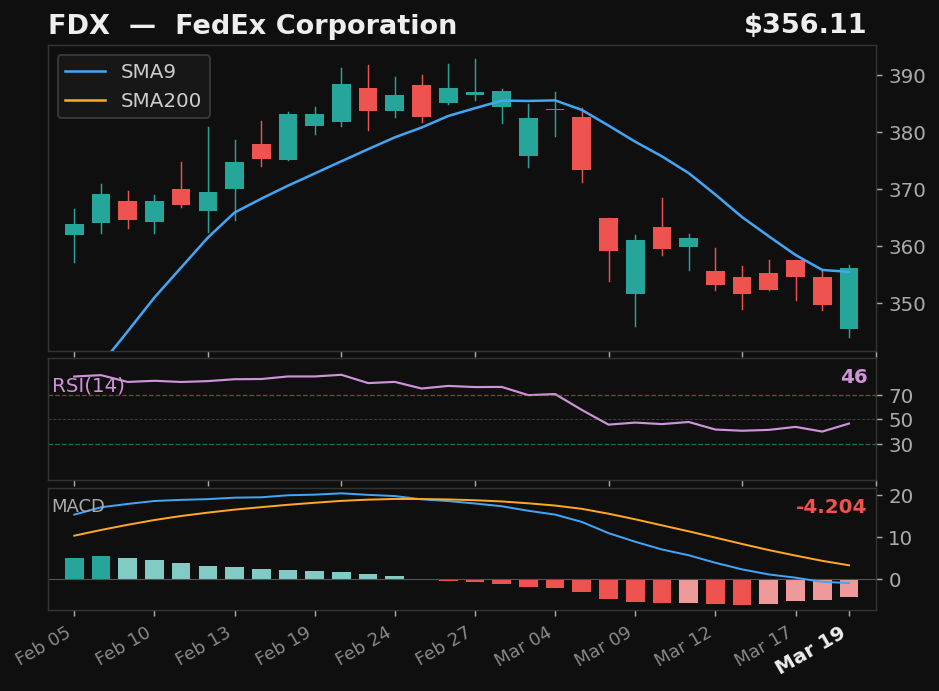
FDX
FedEx Corporation
NYSE
- 9.7% pullback to SMA9 over 12 days
- Crossed back above SMA9 today
- RSI at 46, rising
- MACD histogram improving
Base✓Strict✗Score58.0
Returns
StockMktDiff
1D+0.8%-1.7%+2.5%
2D-0.1%-0.7%+0.6%
3D+1.1%-1.0%+2.1%
5D-1.8%-2.2%+0.4%
10D———
Alternative Setups
3 candidates · ranked by Empirical Score
 click to enlarge
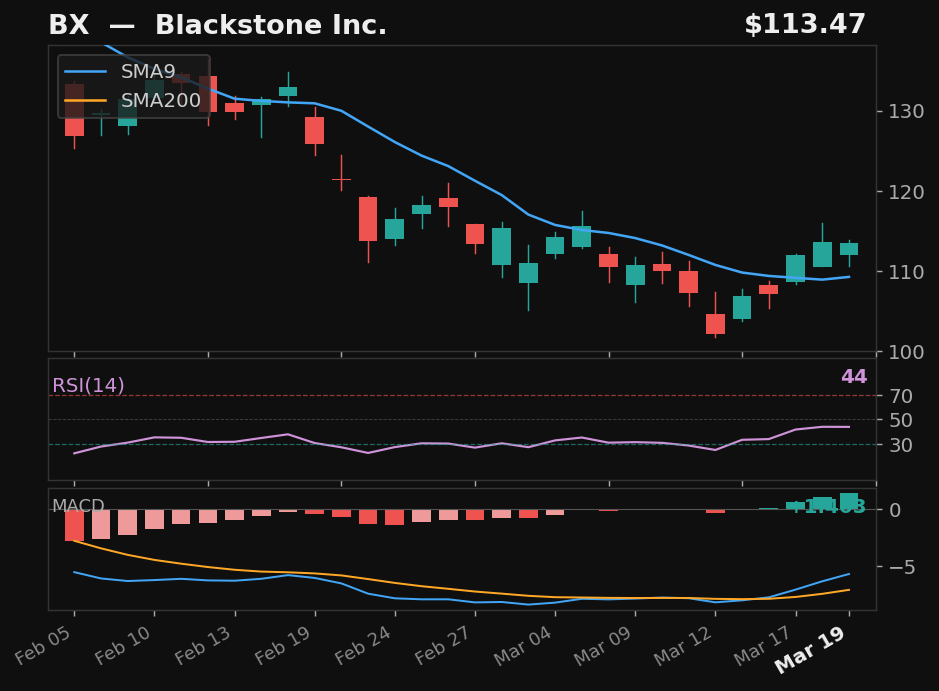
BX
Blackstone Inc.
NYSE
- 23.2% pullback — full candle body above SMA9
- 25.4% below SMA200 — extended from trend
Emp Score54.0Body Above✓
Returns
StockMktDiff
1D-2.7%-1.7%-1.0%
2D-3.6%-0.7%-3.0%
3D-4.8%-1.0%-3.8%
5D-3.4%-2.2%-1.2%
10D———
 click to enlarge
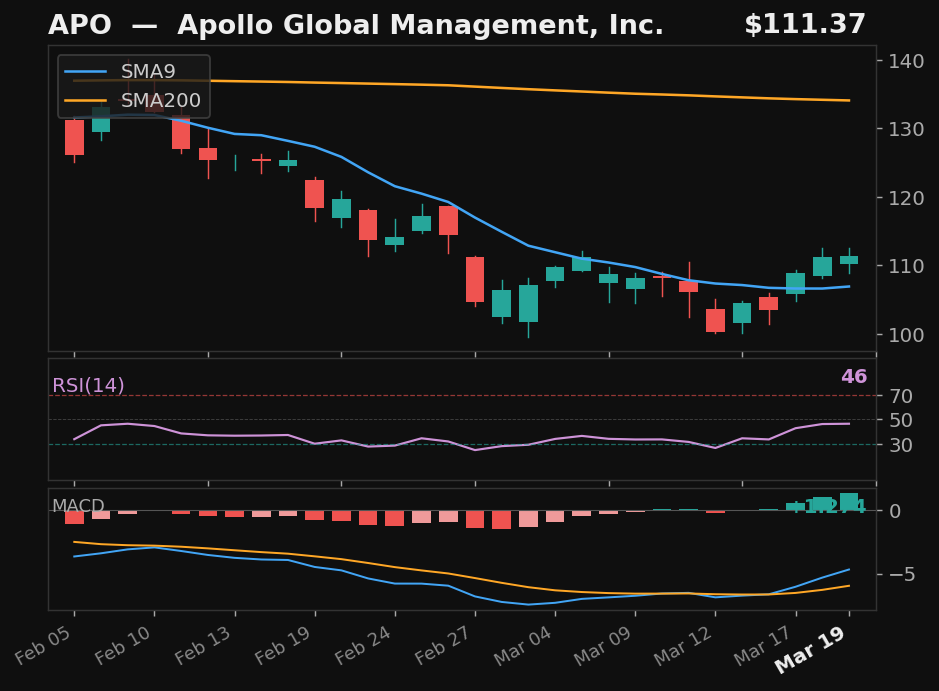
APO
Apollo Global Management, Inc.
NYSE
- 24.3% pullback — full candle body above SMA9
- RSI rising from 46
- 16.9% below SMA200 — extended from trend
Emp Score53.6Body Above✓
Returns
StockMktDiff
1D+0.6%-1.7%+2.3%
2D-0.8%-0.7%-0.2%
3D-0.1%-1.0%+0.9%
5D-1.2%-2.2%+1.0%
10D———
 click to enlarge
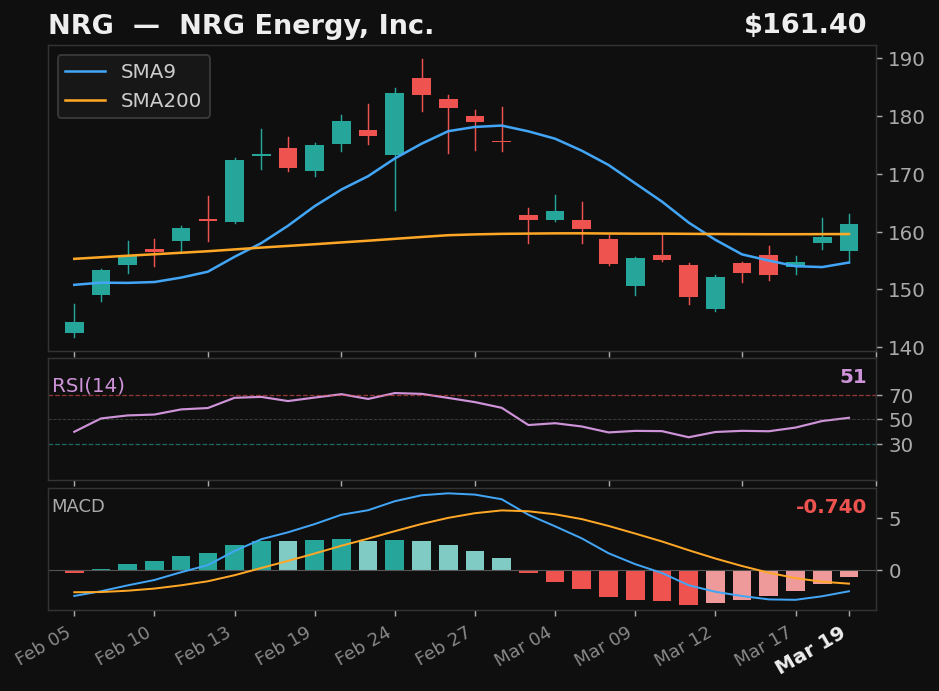
NRG
NRG Energy, Inc.
NYSE
- 16.9% pullback — full candle body above SMA9
- RSI at 51, rising above 50
- MACD histogram rising while still negative — early recovery signal
Emp Score40.2Body Above✓
Returns
StockMktDiff
1D-9.7%-1.7%-8.0%
2D-6.0%-0.7%-5.3%
3D-6.4%-1.0%-5.4%
5D-9.5%-2.2%-7.2%
10D———