Friday, March 20, 2026 · After Close
★ Highlights
1 in both pools
 click to enlarge
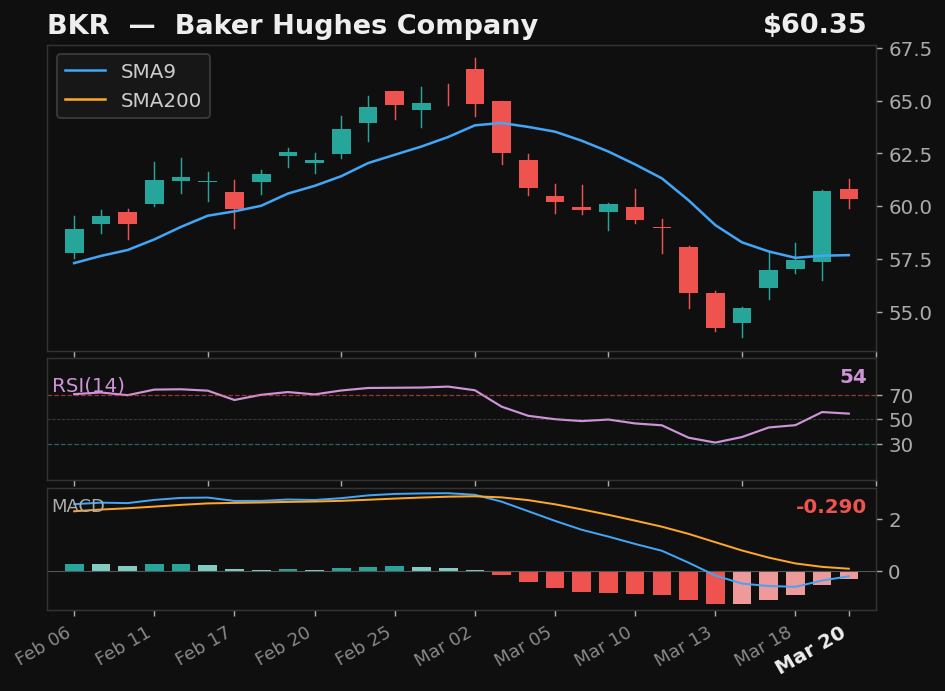
BKR
Baker Hughes Company
NASDAQ
- 16.3% pullback to SMA9
- Crossed above SMA9 — 2 days above
- MACD histogram improving
- Long-term uptrend intact
Base✓Strict✗Score49.0
Returns
StockMktDiff
1D+3.6%+1.1%+2.6%
2D+5.2%+0.7%+4.5%
3D+3.8%+1.3%+2.5%
5D+4.8%-2.2%+7.0%
10D———
SwingTrader Setups
7 candidates
 click to enlarge
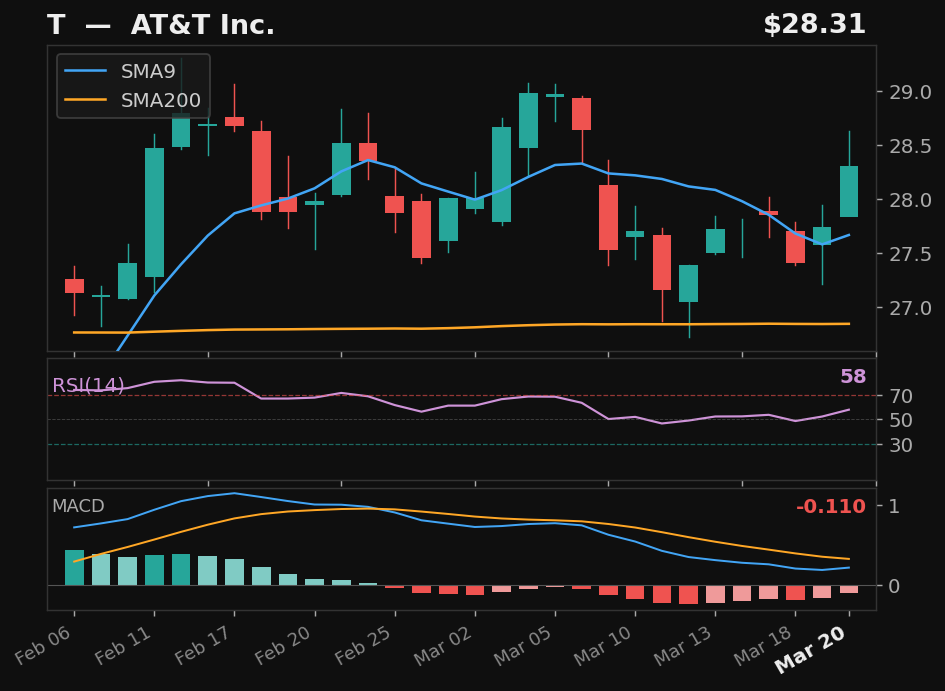
T
AT&T Inc.
NYSE
- 5.2% pullback to SMA9
- Crossed above SMA9 — 2 days above
- RSI at 58, rising
- MACD histogram improving
Base✓Strict✓Score82.0
Returns
StockMktDiff
1D+1.6%+1.1%+0.5%
2D+2.0%+0.7%+1.3%
3D+1.8%+1.3%+0.5%
5D+2.8%-2.2%+5.0%
10D———
 click to enlarge
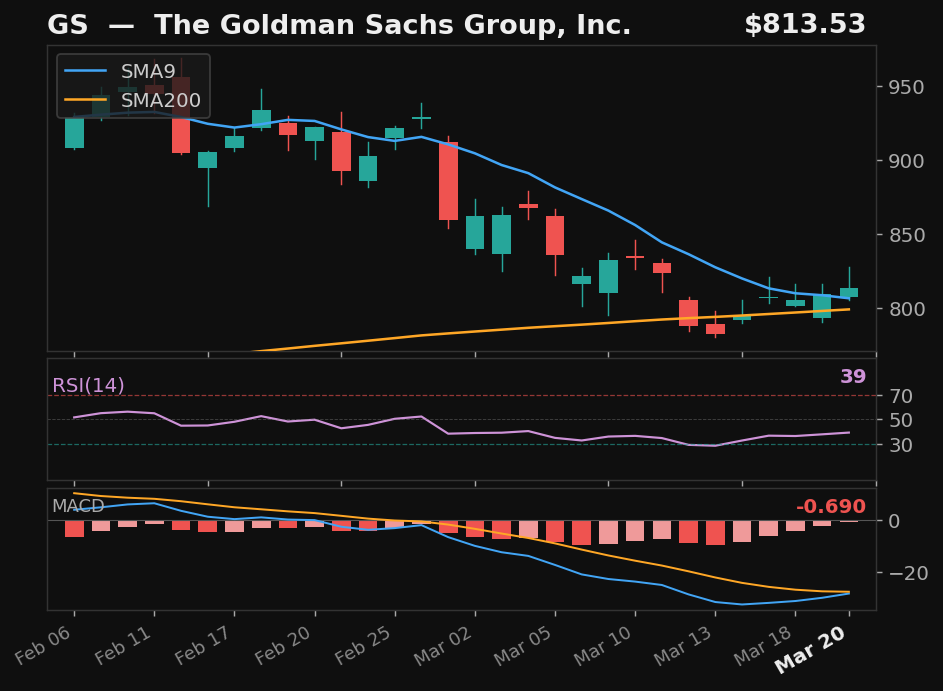
GS
The Goldman Sachs Group, Inc.
NYSE
- 15.8% pullback to SMA9
- Crossed above SMA9 — 2 days above
- RSI rising from 39 — recovering momentum
- MACD histogram improving
Base✓Strict✓Score70.0
Returns
StockMktDiff
1D+2.2%+1.1%+1.1%
2D+2.7%+0.7%+2.0%
3D+3.5%+1.3%+2.2%
5D-1.3%-2.2%+0.9%
10D———
 click to enlarge
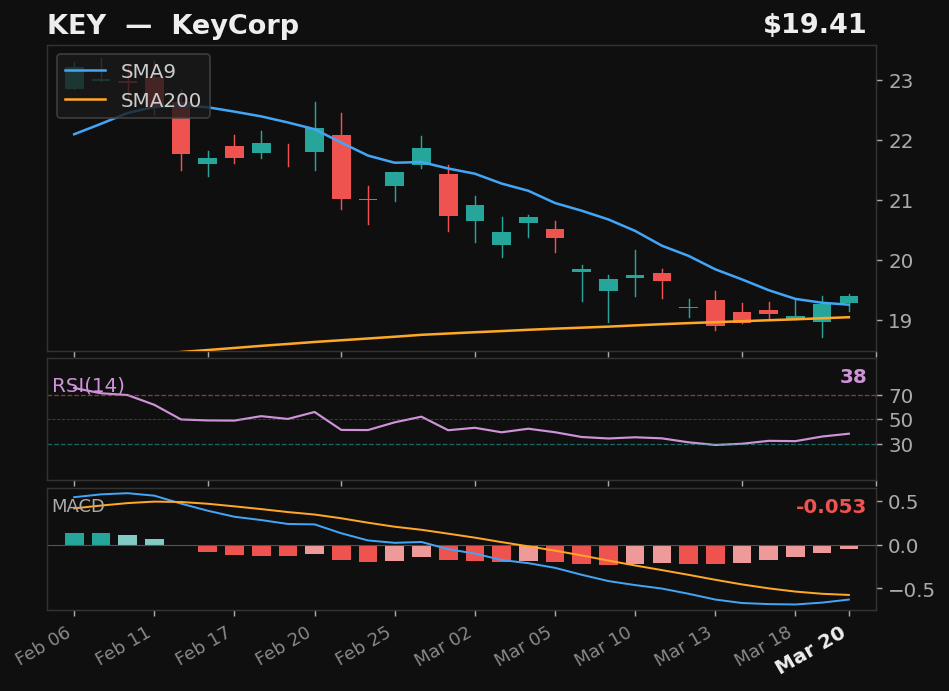
KEY
KeyCorp
NYSE
- 17.6% pullback to SMA9 over 15 days
- Crossed back above SMA9 today
- RSI rising from 38 — recovering momentum
- MACD histogram improving
Base✓Strict✓Score68.0
Returns
StockMktDiff
1D+1.2%+1.1%+0.2%
2D+2.1%+0.7%+1.4%
3D+3.0%+1.3%+1.8%
5D+0.2%-2.2%+2.4%
10D———
 click to enlarge
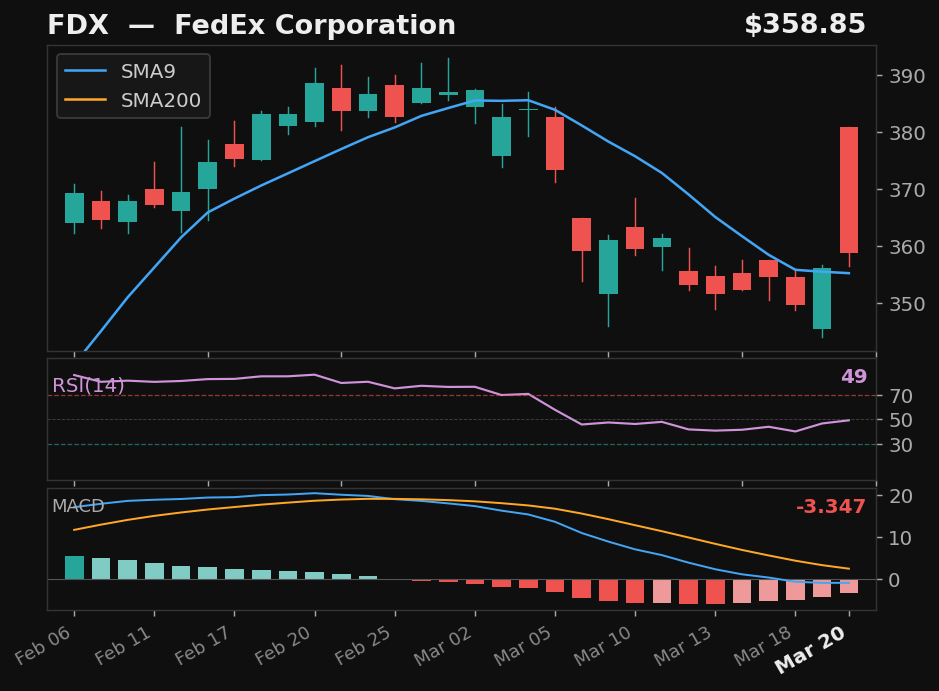
FDX
FedEx Corporation
NYSE
- 9.7% pullback to SMA9
- Crossed above SMA9 — 2 days above
- RSI at 49, rising
- MACD histogram improving
Base✓Strict✗Score57.0
Returns
StockMktDiff
1D-0.9%+1.1%-1.9%
2D+0.3%+0.7%-0.4%
3D-0.4%+1.3%-1.6%
5D-4.1%-2.2%-1.9%
10D———
 click to enlarge
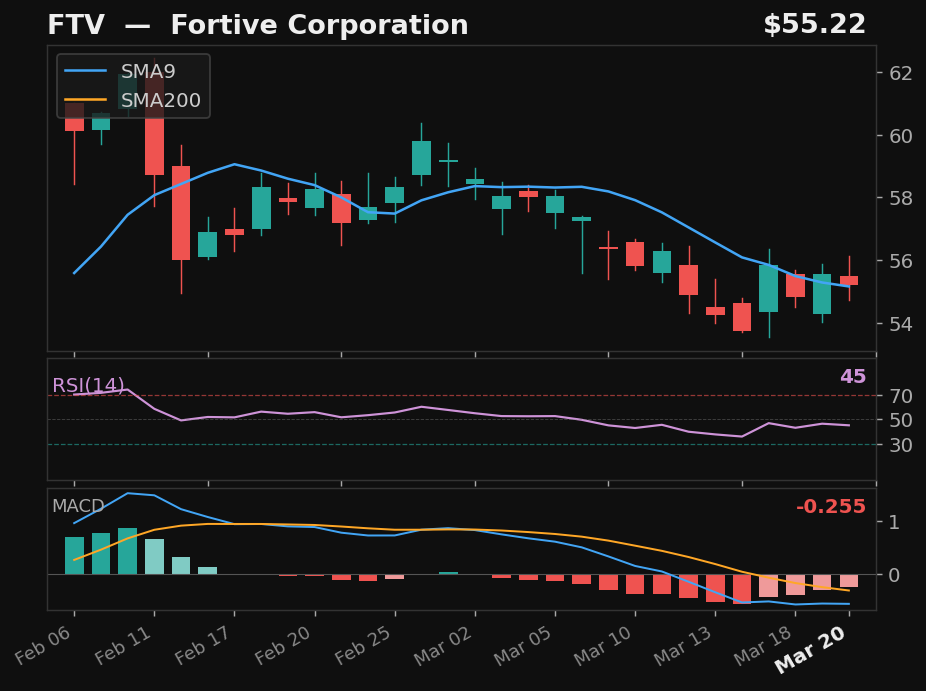
FTV
Fortive Corporation
NYSE
- 8.2% pullback to SMA9
- Crossed above SMA9 — 2 days above
- MACD histogram improving
Base✓Strict✗Score55.0
Returns
StockMktDiff
1D+0.3%+1.1%-0.7%
2D-0.6%+0.7%-1.3%
3D-0.8%+1.3%-2.1%
5D-2.4%-2.2%-0.1%
10D———
click to enlarge
BKR
Baker Hughes Company
NASDAQ
- 16.3% pullback to SMA9
- Crossed above SMA9 — 2 days above
- MACD histogram improving
- Long-term uptrend intact
Base✓Strict✗Score49.0
Returns
StockMktDiff
1D+3.6%+1.1%+2.6%
2D+5.2%+0.7%+4.5%
3D+3.8%+1.3%+2.5%
5D+4.8%-2.2%+7.0%
10D———
 click to enlarge
SLB
SLB N.V.
NYSE
- 13.2% pullback to SMA9
- Crossed above SMA9 — 2 days above
- MACD histogram improving
- Long-term uptrend intact
Base✓Strict✗Score47.0
Returns
StockMktDiff
1D+5.6%+1.1%+4.6%
2D+8.3%+0.7%+7.6%
3D+11.3%+1.3%+10.0%
5D+14.7%-2.2%+17.0%
10D———
Alternative Setups
3 candidates · ranked by Empirical Score
click to enlarge
BKR
Baker Hughes Company
NASDAQ
- 16.3% pullback — full candle body above SMA9
- MACD histogram rising while still negative — early recovery signal
- 25.2% above SMA200 — extended from trend
Emp Score46.2Body Above✓
Returns
StockMktDiff
1D+3.6%+1.1%+2.6%
2D+5.2%+0.7%+4.5%
3D+3.8%+1.3%+2.5%
5D+4.8%-2.2%+7.0%
10D———
 click to enlarge
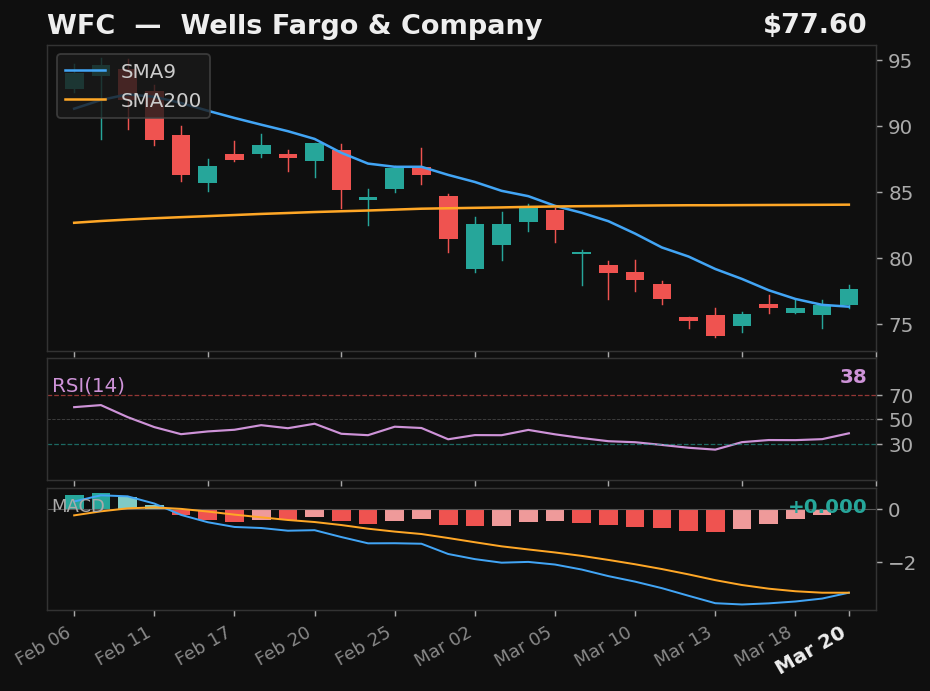
WFC
Wells Fargo & Company
NYSE
- 21.7% pullback over 27 days — full candle above SMA9
- RSI rising from 38
- 7.6% below SMA200 — extended from trend
Emp Score45.6Body Above✓
Returns
StockMktDiff
1D+0.9%+1.1%-0.2%
2D+2.6%+0.7%+1.9%
3D+3.4%+1.3%+2.2%
5D-0.5%-2.2%+1.7%
10D———
 click to enlarge
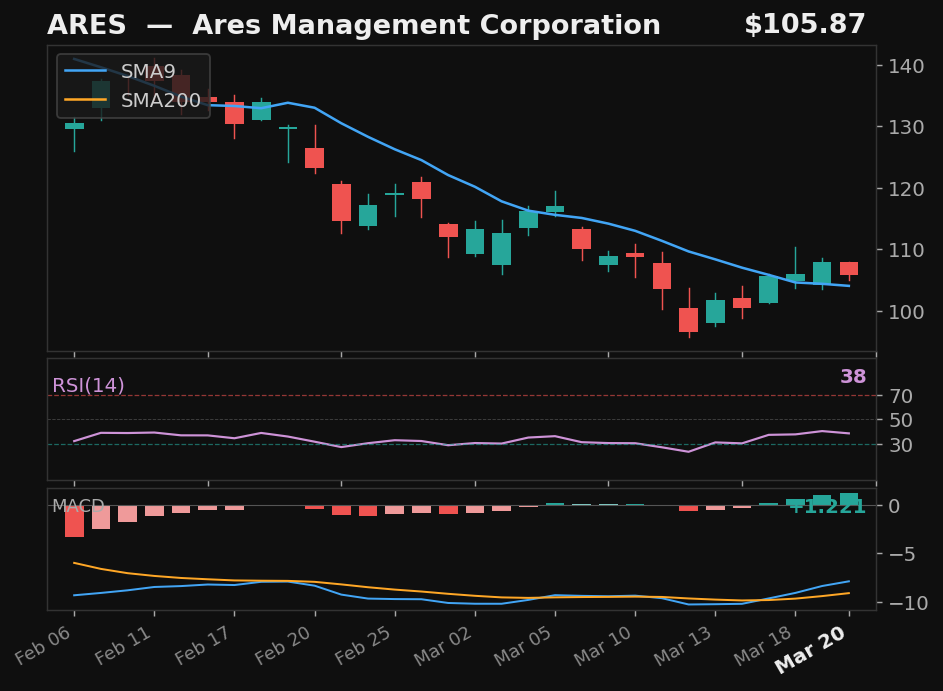
ARES
Ares Management Corporation
NYSE
- 17.6% pullback — full candle body above SMA9
- 33.6% below SMA200 — extended from trend
Emp Score45.2Body Above✓
Returns
StockMktDiff
1D+1.2%+1.1%+0.1%
2D+0.2%+0.7%-0.6%
3D+0.6%+1.3%-0.7%
5D+0.4%-2.2%+2.6%
10D———