Monday, March 23, 2026 · After Close
SwingTrader Setups
10 candidates
 click to enlarge
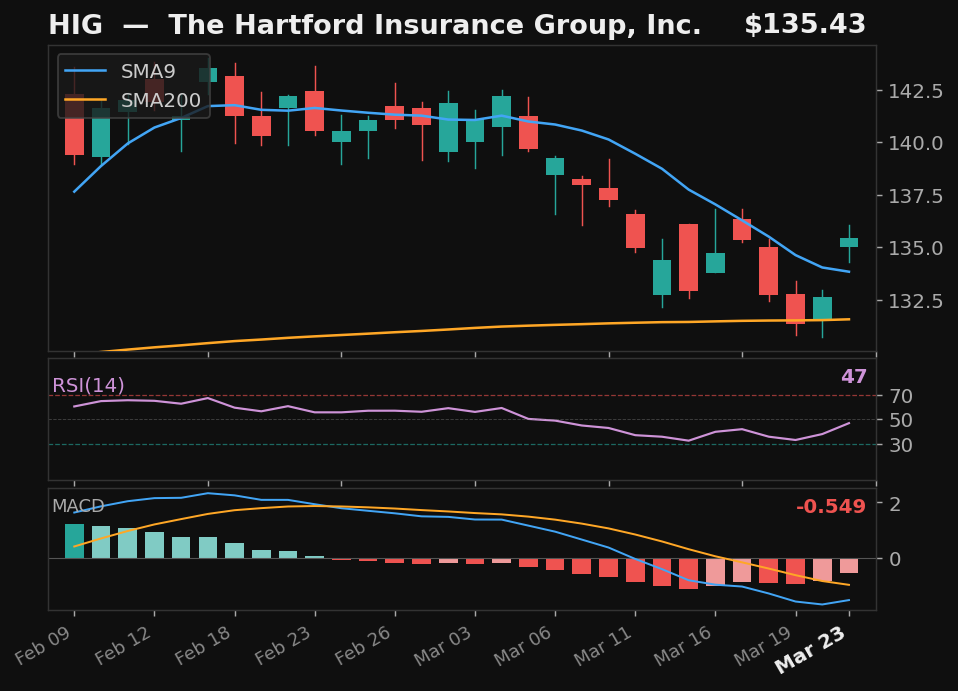
HIG
The Hartford Insurance Group, Inc.
NYSE
- 7.6% pullback to SMA9 over 12 days
- Crossed back above SMA9 today
- RSI at 47, rising
- MACD histogram improving
Base✓Strict✓Score78.0
Returns
StockMktDiff
1D-0.0%-0.3%+0.3%
2D-1.0%+0.2%-1.2%
3D-0.4%-1.6%+1.2%
5D———
10D———
 click to enlarge
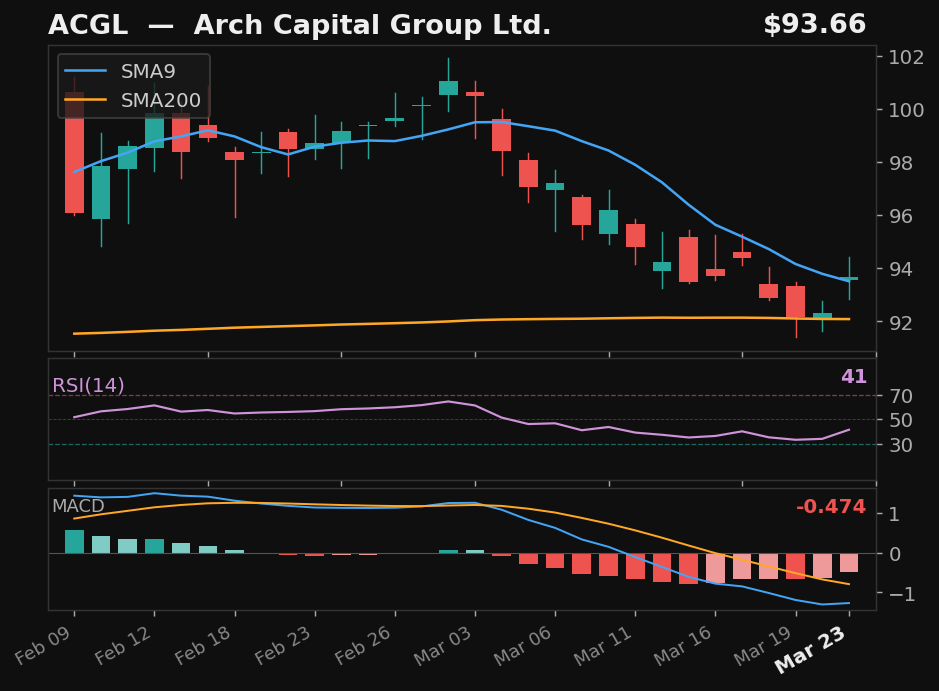
ACGL
Arch Capital Group Ltd.
NASDAQ
- 8.3% pullback to SMA9 over 13 days
- Crossed back above SMA9 today
- RSI rising from 41 — recovering momentum
- MACD histogram improving
Base✓Strict✓Score74.0
Returns
StockMktDiff
1D-0.1%-0.3%+0.3%
2D-0.4%+0.2%-0.6%
3D+0.5%-1.6%+2.1%
5D———
10D———
 click to enlarge
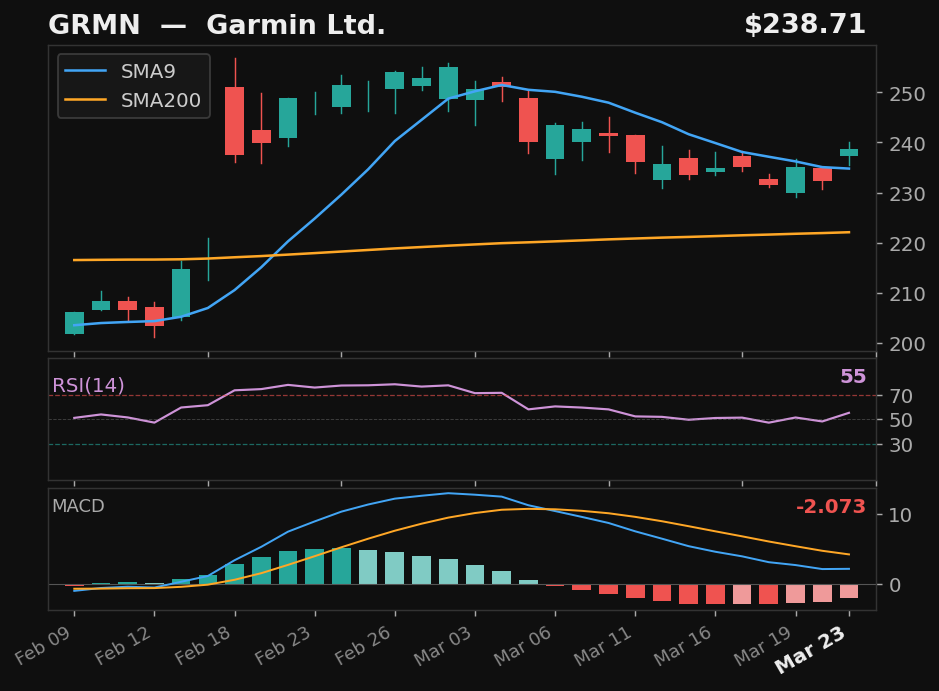
GRMN
Garmin Ltd.
NYSE
- 9.2% pullback to SMA9 over 13 days
- Crossed back above SMA9 today
- RSI at 55, rising
- MACD histogram improving
Base✓Strict✓Score73.0
Returns
StockMktDiff
1D+1.0%-0.3%+1.3%
2D+2.5%+0.2%+2.3%
3D-1.1%-1.6%+0.5%
5D———
10D———
 click to enlarge
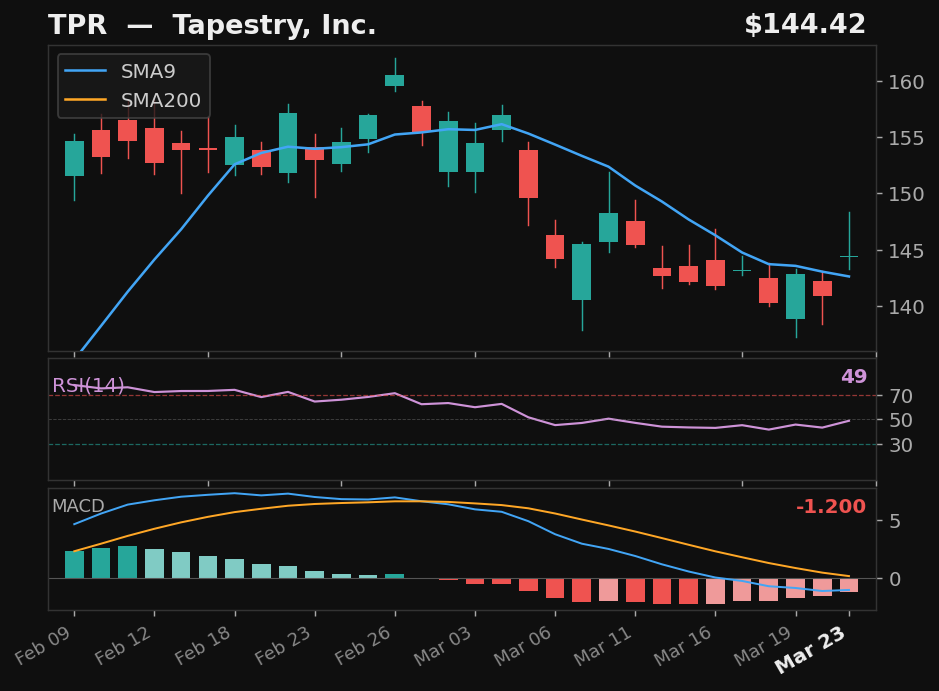
TPR
Tapestry, Inc.
NYSE
- 10.6% pullback to SMA9 over 12 days
- Crossed back above SMA9 today
- RSI at 49, rising
- MACD histogram improving
Base✓Strict✓Score73.0
Returns
StockMktDiff
1D-0.3%-0.3%+0.1%
2D+1.2%+0.2%+1.0%
3D-2.1%-1.6%-0.5%
5D———
10D———
 click to enlarge
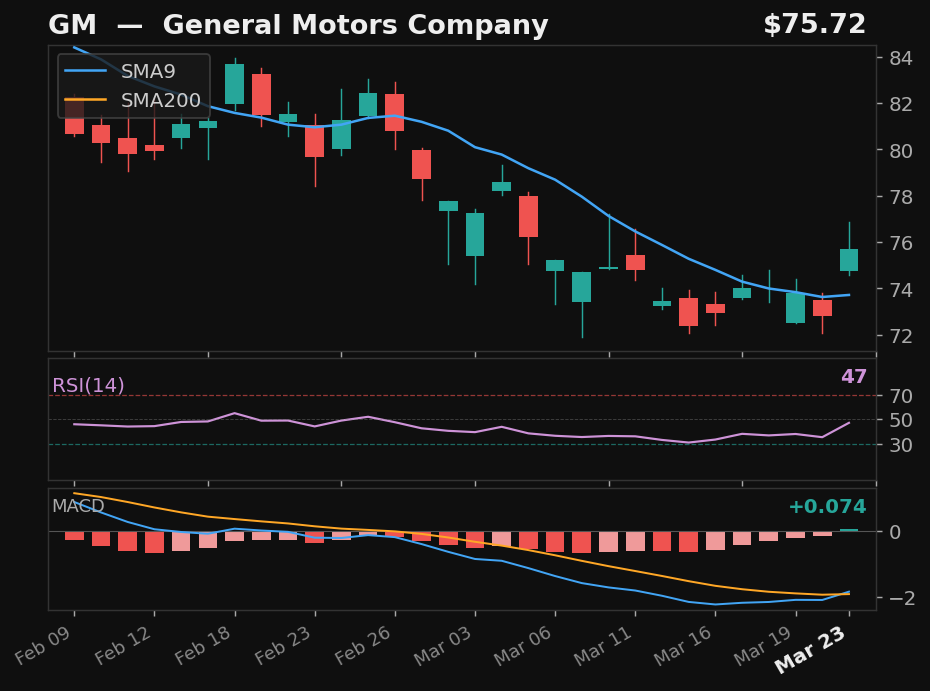
GM
General Motors Company
NYSE
- 12.2% pullback to SMA9 over 17 days
- Crossed back above SMA9 today
- RSI at 47, rising
- MACD histogram improving
Base✓Strict✓Score71.0
Returns
StockMktDiff
1D+1.1%-0.3%+1.5%
2D+1.2%+0.2%+1.0%
3D-0.2%-1.6%+1.4%
5D———
10D———
 click to enlarge
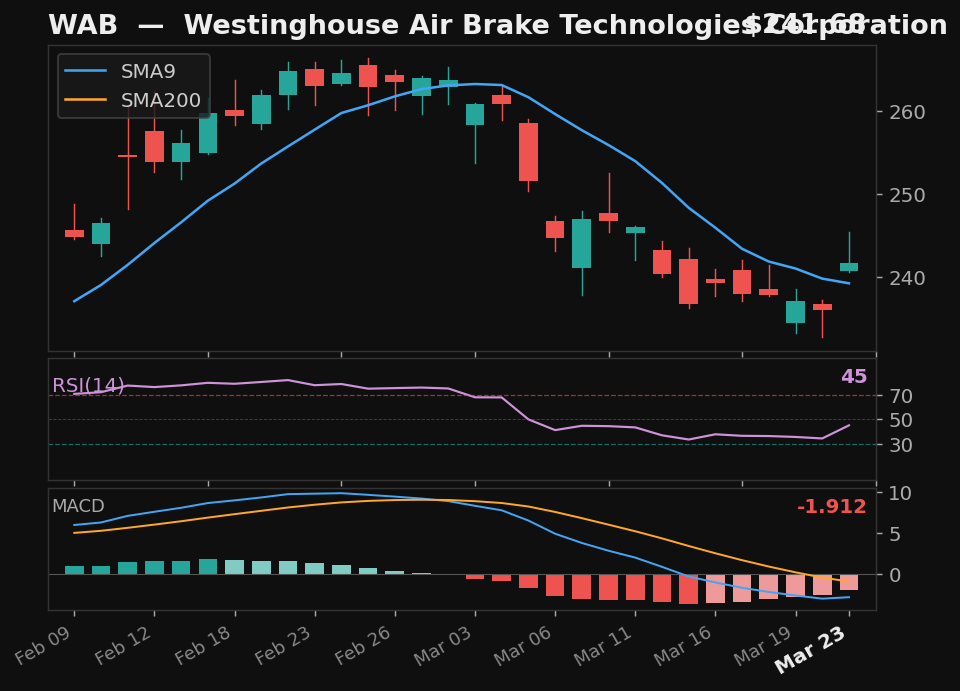
WAB
Westinghouse Air Brake Technologies Corporation
NYSE
- 10.6% pullback to SMA9 over 14 days
- Crossed back above SMA9 today
- RSI rising from 45 — recovering momentum
- MACD histogram improving
Base✓Strict✓Score71.0
Returns
StockMktDiff
1D+1.6%-0.3%+2.0%
2D+2.7%+0.2%+2.5%
3D+1.6%-1.6%+3.2%
5D———
10D———
 click to enlarge
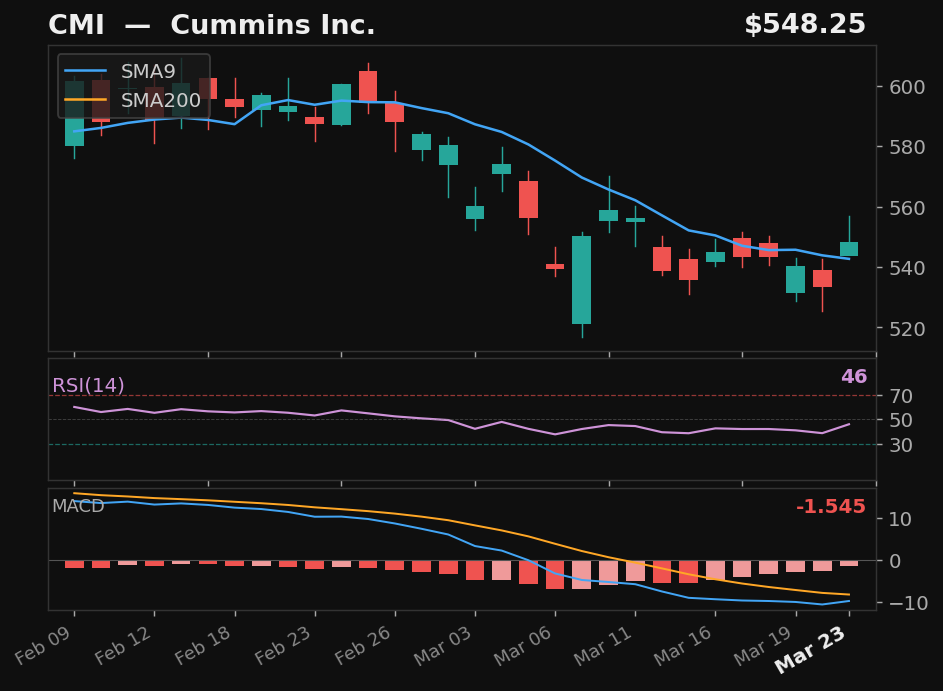
CMI
Cummins Inc.
NYSE
- 11.1% pullback to SMA9 over 18 days
- Crossed back above SMA9 today
- RSI at 46, rising
- MACD histogram improving
Base✓Strict✓Score70.0
Returns
StockMktDiff
1D+1.2%-0.3%+1.5%
2D+0.9%+0.2%+0.7%
3D-3.3%-1.6%-1.8%
5D———
10D———
 click to enlarge
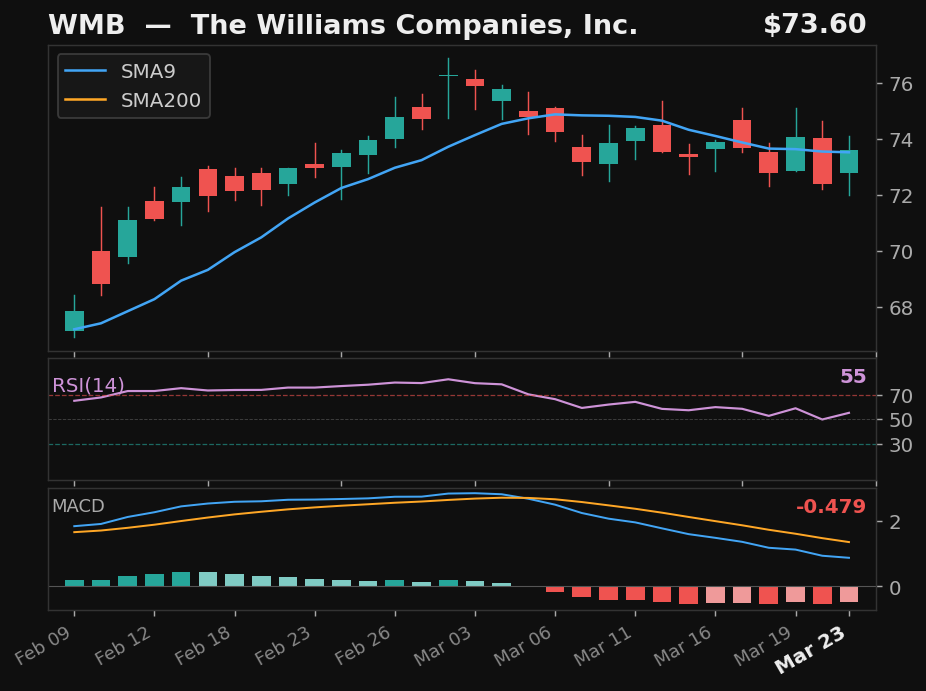
WMB
The Williams Companies, Inc.
NYSE
- 3.2% pullback to SMA9 — 1 day
- Crossed back above SMA9 today
- RSI at 55, rising
- MACD histogram improving
Base✓Strict✗Score74.0
Returns
StockMktDiff
1D+1.2%-0.3%+1.5%
2D+0.3%+0.2%+0.1%
3D+0.6%-1.6%+2.2%
5D———
10D———
 click to enlarge
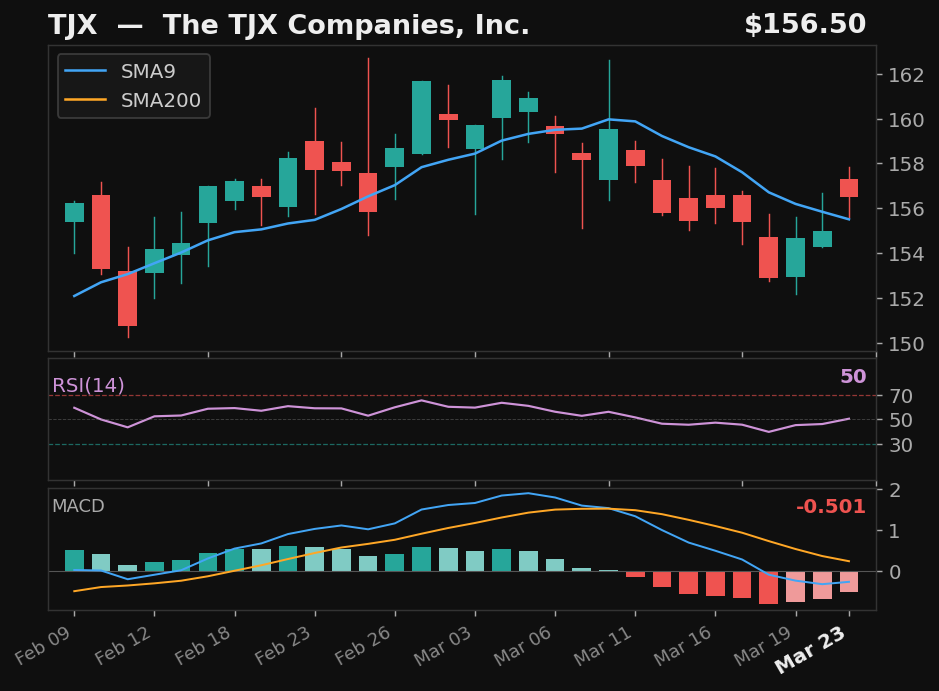
TJX
The TJX Companies, Inc.
NYSE
- 5.0% pullback to SMA9 over 11 days
- Crossed back above SMA9 today
- RSI at 50, rising
- MACD histogram improving
Base✓Strict✗Score71.0
Returns
StockMktDiff
1D+1.2%-0.3%+1.5%
2D+2.1%+0.2%+1.9%
3D+0.7%-1.6%+2.3%
5D———
10D———
 click to enlarge
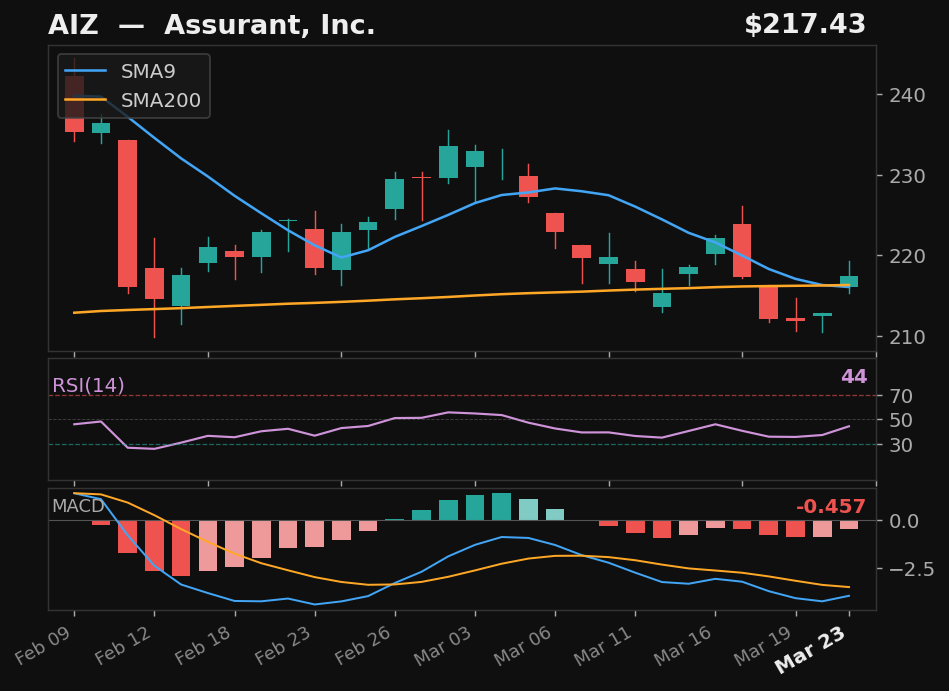
AIZ
Assurant, Inc.
NYSE
- 8.7% pullback to SMA9 over 4 days
- Crossed back above SMA9 today
- RSI rising from 44 — recovering momentum
- MACD histogram improving
Base✓Strict✗Score70.0
Returns
StockMktDiff
1D+0.0%-0.3%+0.4%
2D-0.2%+0.2%-0.4%
3D-0.0%-1.6%+1.6%
5D———
10D———
Alternative Setups
3 candidates · ranked by Empirical Score
 click to enlarge
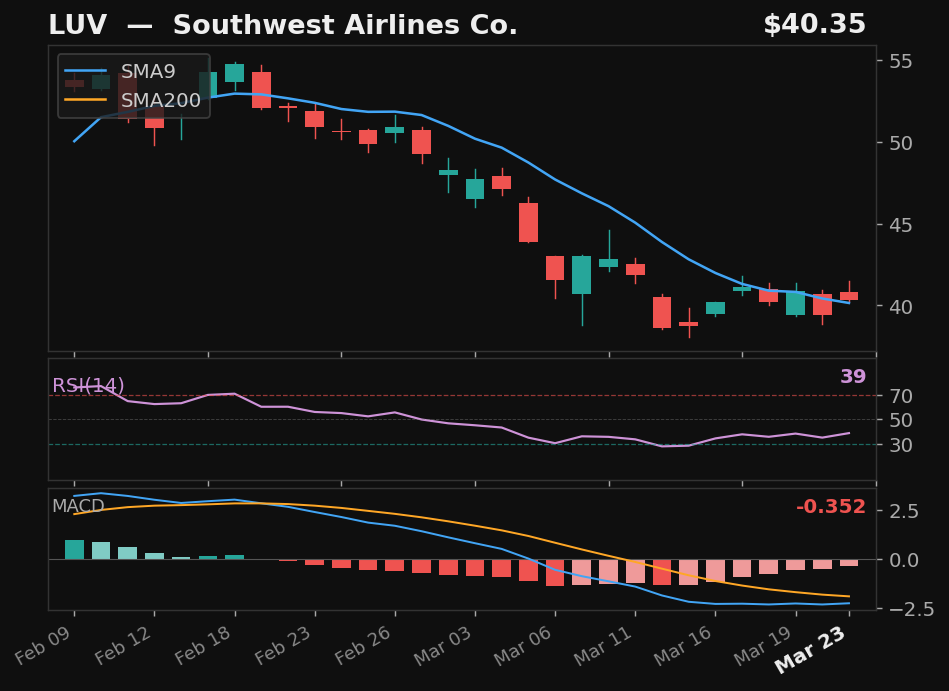
LUV
Southwest Airlines Co.
NYSE
- 29.5% pullback — full candle body above SMA9
- RSI rising from 39
- MACD histogram rising while still negative — early recovery signal
- 9.0% above SMA200 — extended from trend
Emp Score64.8Body Above✓
Returns
StockMktDiff
1D-1.3%-0.3%-1.0%
2D-0.4%+0.2%-0.6%
3D-2.0%-1.6%-0.5%
5D———
10D———
 click to enlarge
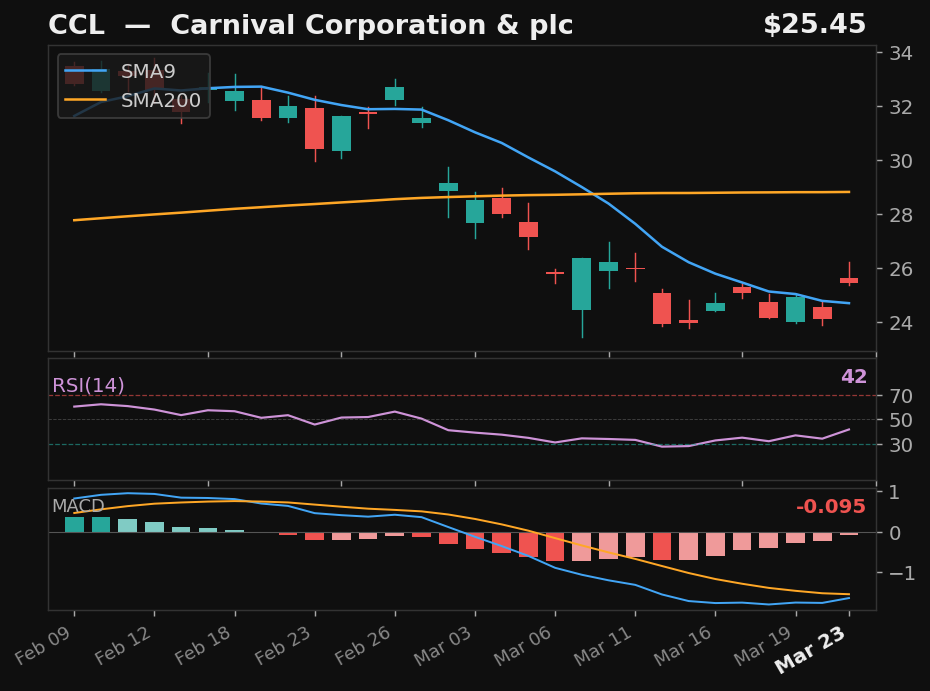
CCL
Carnival Corporation & plc
NYSE
- 26.9% pullback over 16 days — full candle above SMA9
- RSI rising from 42
- MACD histogram rising while still negative — early recovery signal
- 11.7% below SMA200 — extended from trend
Emp Score60.2Body Above✓
Returns
StockMktDiff
1D+0.1%-0.3%+0.4%
2D+1.1%+0.2%+0.9%
3D-0.7%-1.6%+0.9%
5D———
10D———
 click to enlarge
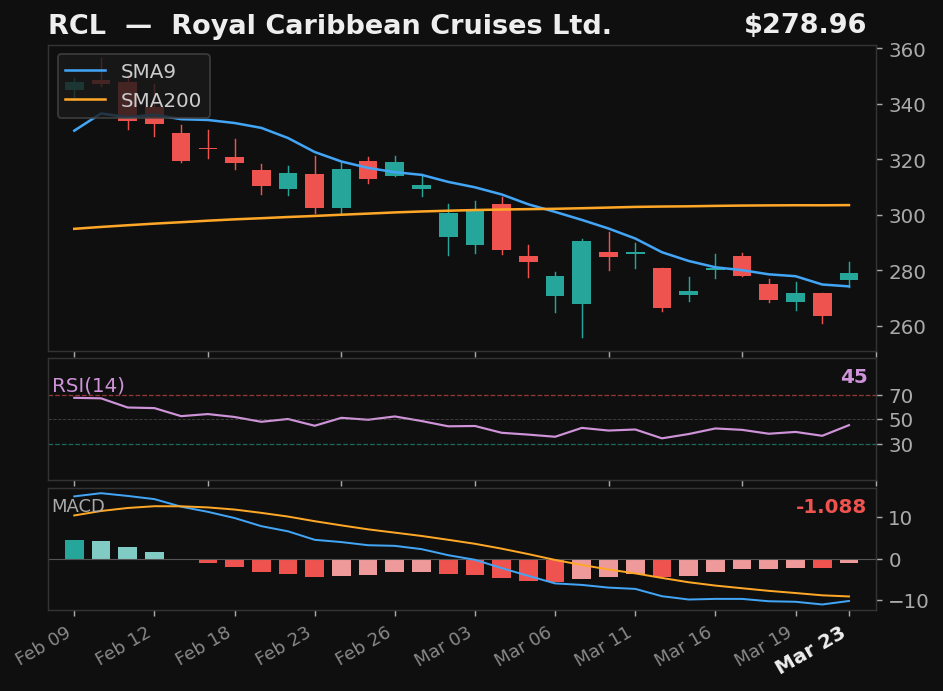
RCL
Royal Caribbean Cruises Ltd.
NYSE
- 24.1% pullback over 16 days — full candle above SMA9
- RSI rising from 45
- MACD histogram rising while still negative — early recovery signal
- 8.1% below SMA200 — extended from trend
Emp Score53.6Body Above✓
Returns
StockMktDiff
1D-2.0%-0.3%-1.7%
2D+0.0%+0.2%-0.2%
3D-1.8%-1.6%-0.2%
5D———
10D———