Tuesday, March 24, 2026 · After Close
SwingTrader Setups
10 candidates
 click to enlarge
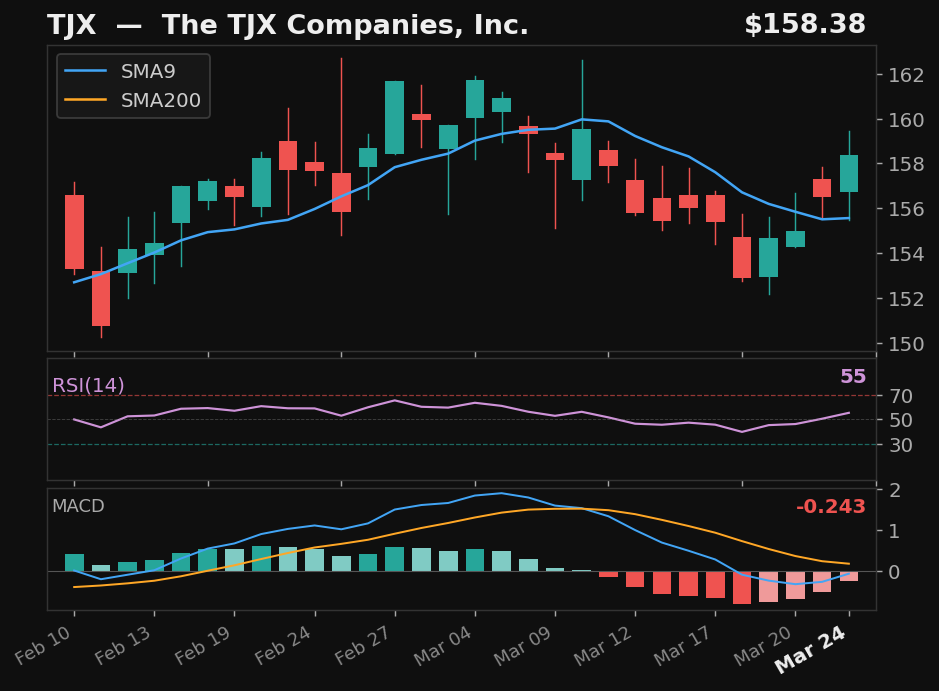
TJX
The TJX Companies, Inc.
NYSE
- 5.0% pullback to SMA9
- Crossed above SMA9 — 2 days above
- RSI at 55, rising
- MACD histogram improving
Base✓Strict✓Score84.0
Returns
StockMktDiff
1D+0.9%+0.6%+0.3%
2D-0.5%-1.2%+0.7%
3D-2.1%-2.9%+0.9%
5D———
10D———
 click to enlarge
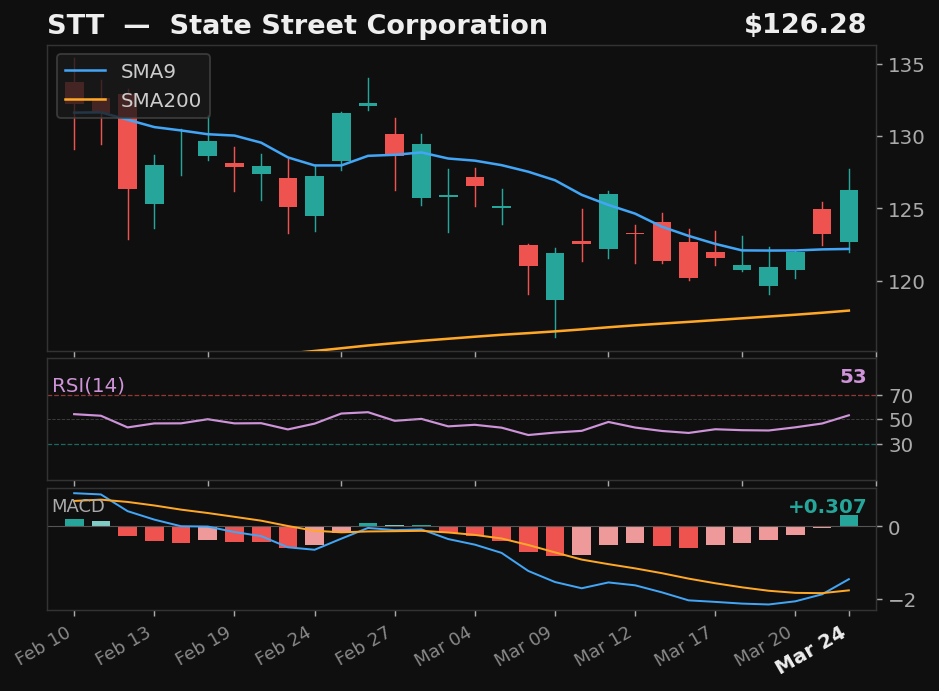
STT
State Street Corporation
NYSE
- 9.1% pullback to SMA9
- Crossed above SMA9 — 2 days above
- RSI at 53, rising
- MACD histogram improving
Base✓Strict✓Score80.0
Returns
StockMktDiff
1D+0.5%+0.6%-0.1%
2D-0.5%-1.2%+0.7%
3D-3.0%-2.9%-0.1%
5D———
10D———
 click to enlarge
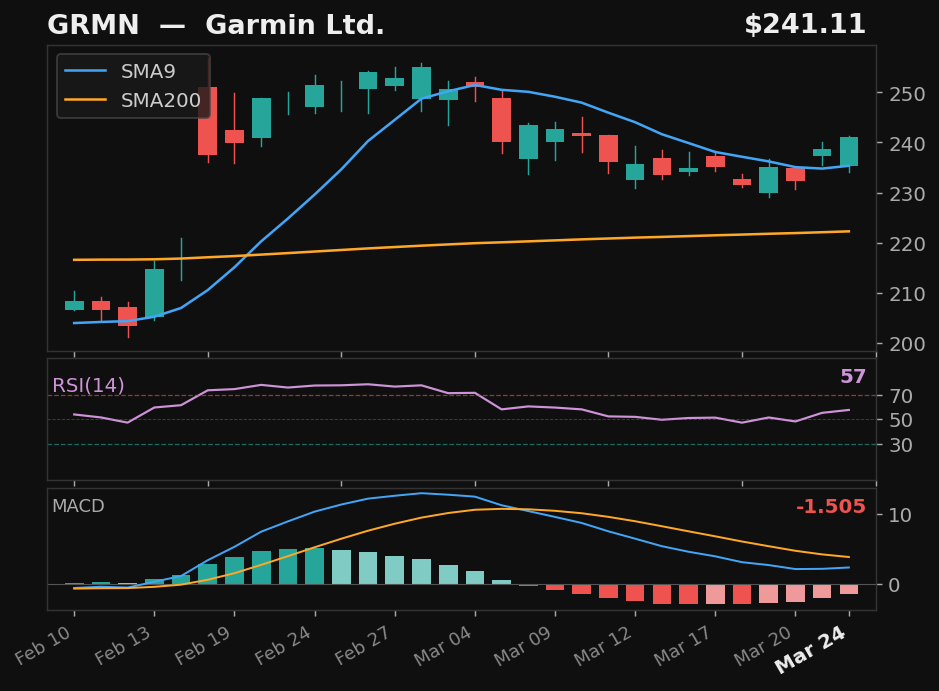
GRMN
Garmin Ltd.
NYSE
- 9.2% pullback to SMA9
- Crossed above SMA9 — 2 days above
- RSI at 57, rising
- MACD histogram improving
Base✓Strict✓Score75.0
Returns
StockMktDiff
1D+1.5%+0.6%+1.0%
2D-2.1%-1.2%-0.9%
3D-4.5%-2.9%-1.6%
5D———
10D———
 click to enlarge
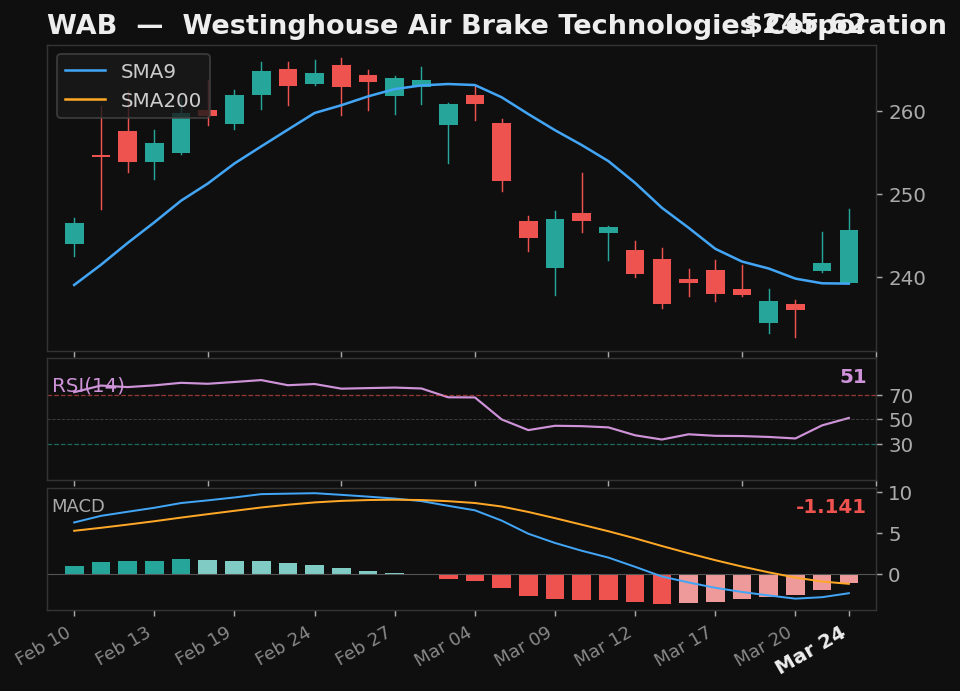
WAB
Westinghouse Air Brake Technologies Corporation
NYSE
- 10.6% pullback to SMA9
- Crossed above SMA9 — 2 days above
- RSI at 51, rising
- MACD histogram improving
Base✓Strict✓Score75.0
Returns
StockMktDiff
1D+1.1%+0.6%+0.5%
2D-0.0%-1.2%+1.2%
3D-1.8%-2.9%+1.1%
5D———
10D———
 click to enlarge
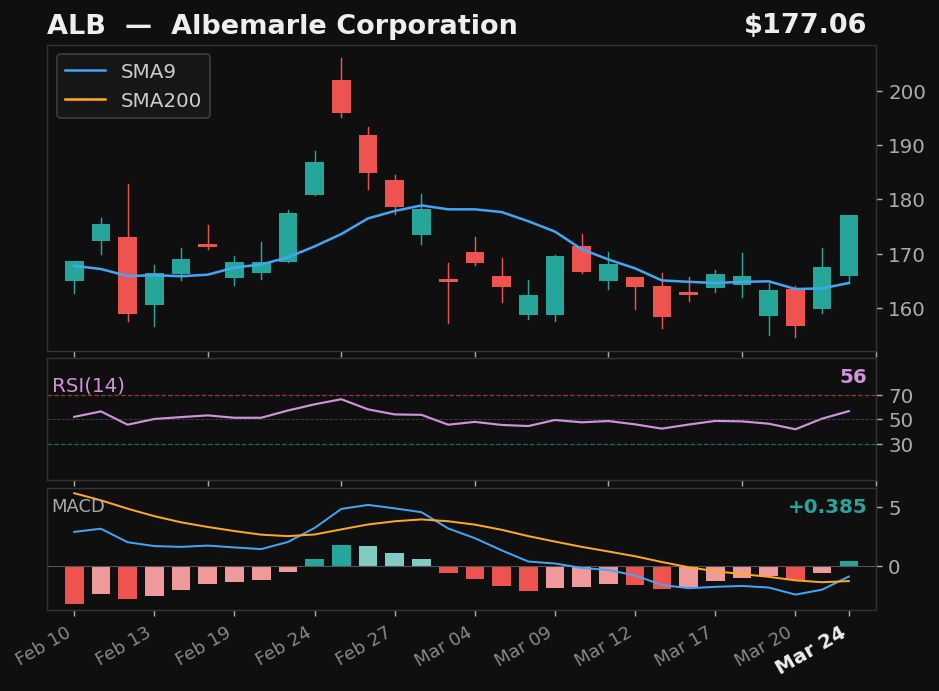
ALB
Albemarle Corporation
NYSE
- 12.3% pullback to SMA9
- Crossed above SMA9 — 2 days above
- RSI at 56, rising
- MACD histogram improving
Base✓Strict✓Score74.0
Returns
StockMktDiff
1D+2.4%+0.6%+1.9%
2D-1.4%-1.2%-0.2%
3D+1.3%-2.9%+4.3%
5D———
10D———
 click to enlarge
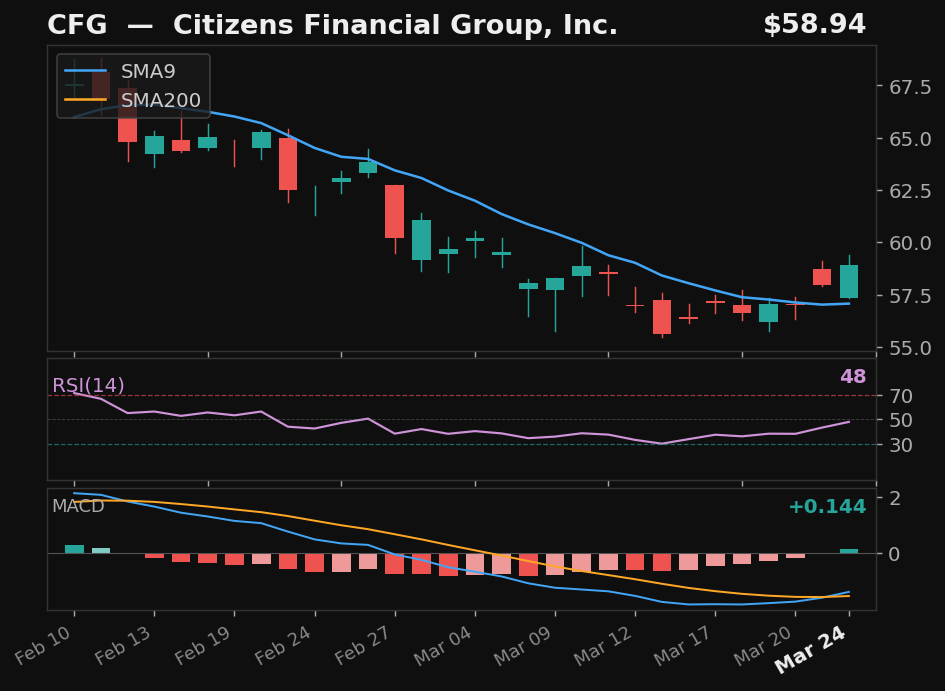
CFG
Citizens Financial Group, Inc.
NYSE
- 16.8% pullback to SMA9
- Crossed above SMA9 — 2 days above
- RSI at 48, rising
- MACD histogram improving
Base✓Strict✓Score74.0
Returns
StockMktDiff
1D+0.8%+0.6%+0.3%
2D-0.6%-1.2%+0.6%
3D-2.0%-2.9%+1.0%
5D———
10D———
 click to enlarge
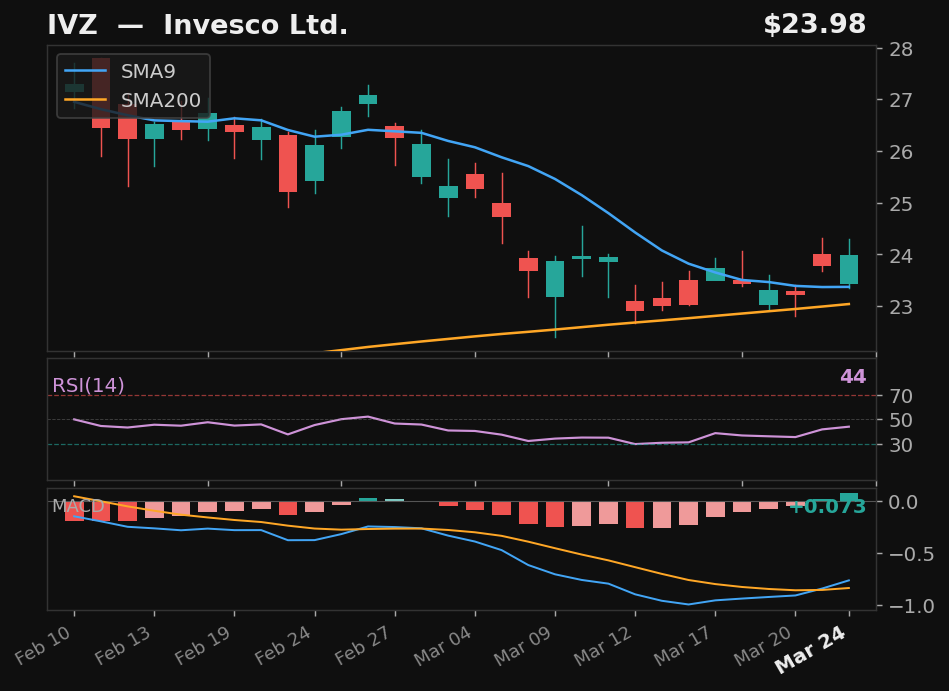
IVZ
Invesco Ltd.
NYSE
- 15.5% pullback to SMA9
- Crossed above SMA9 — 2 days above
- RSI rising from 44 — recovering momentum
- MACD bullish cross 1 day ago
Base✓Strict✓Score74.0
Returns
StockMktDiff
1D+1.6%+0.6%+1.0%
2D+0.5%-1.2%+1.7%
3D-3.3%-2.9%-0.3%
5D———
10D———
 click to enlarge
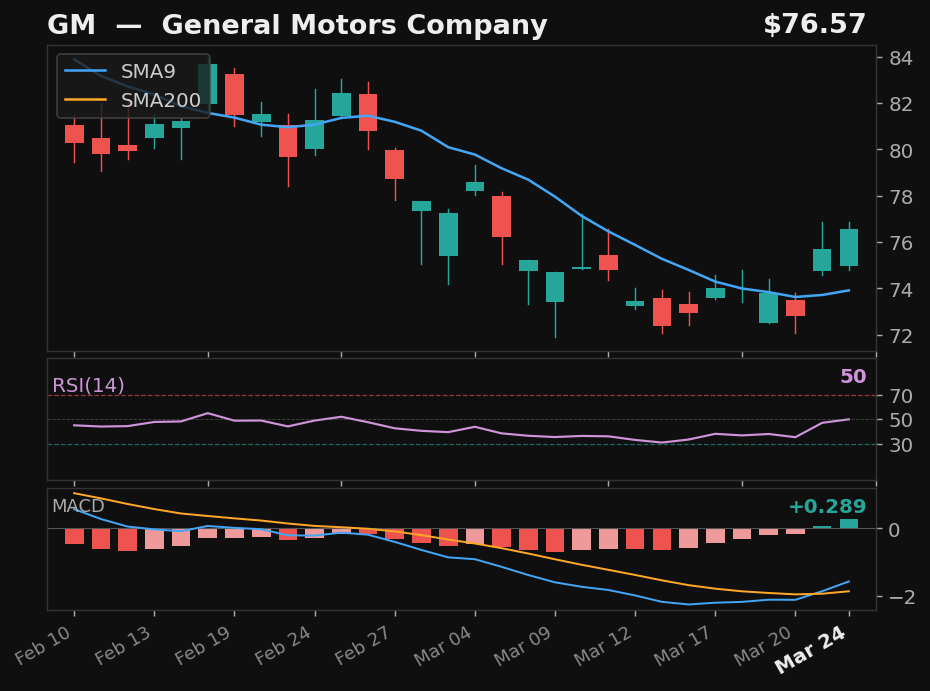
GM
General Motors Company
NYSE
- 12.2% pullback to SMA9
- Crossed above SMA9 — 2 days above
- RSI at 50, rising
- MACD bullish cross 1 day ago
Base✓Strict✓Score73.0
Returns
StockMktDiff
1D+0.1%+0.6%-0.5%
2D-1.3%-1.2%-0.0%
3D-4.7%-2.9%-1.8%
5D———
10D———
 click to enlarge
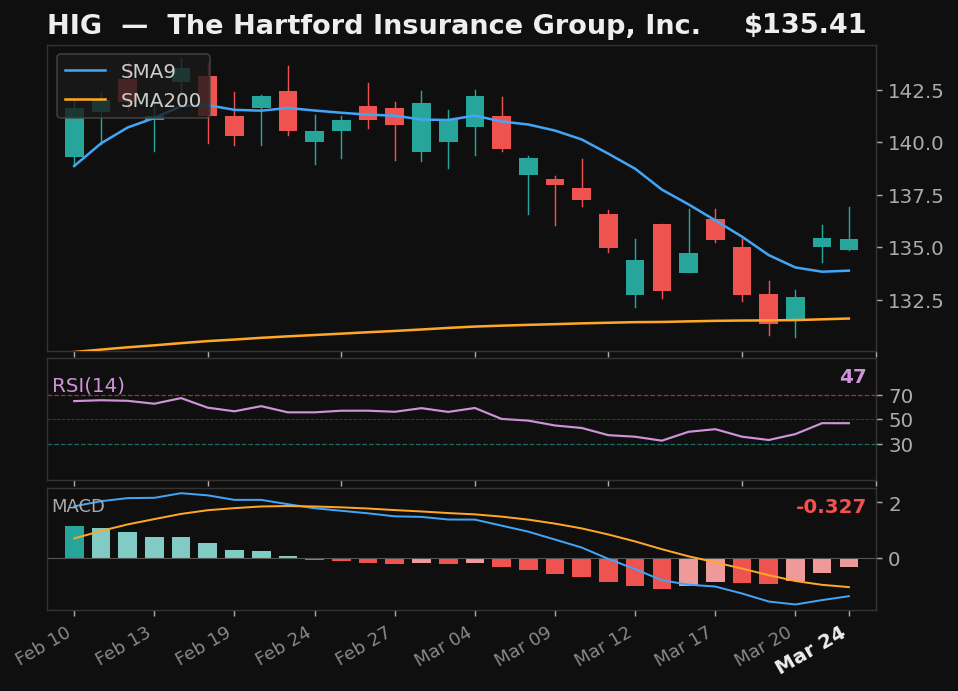
HIG
The Hartford Insurance Group, Inc.
NYSE
- 7.6% pullback to SMA9
- Crossed above SMA9 — 2 days above
- MACD histogram improving
Base✓Strict✓Score71.0
Returns
StockMktDiff
1D-1.0%+0.6%-1.5%
2D-0.4%-1.2%+0.9%
3D-2.3%-2.9%+0.6%
5D———
10D———
 click to enlarge
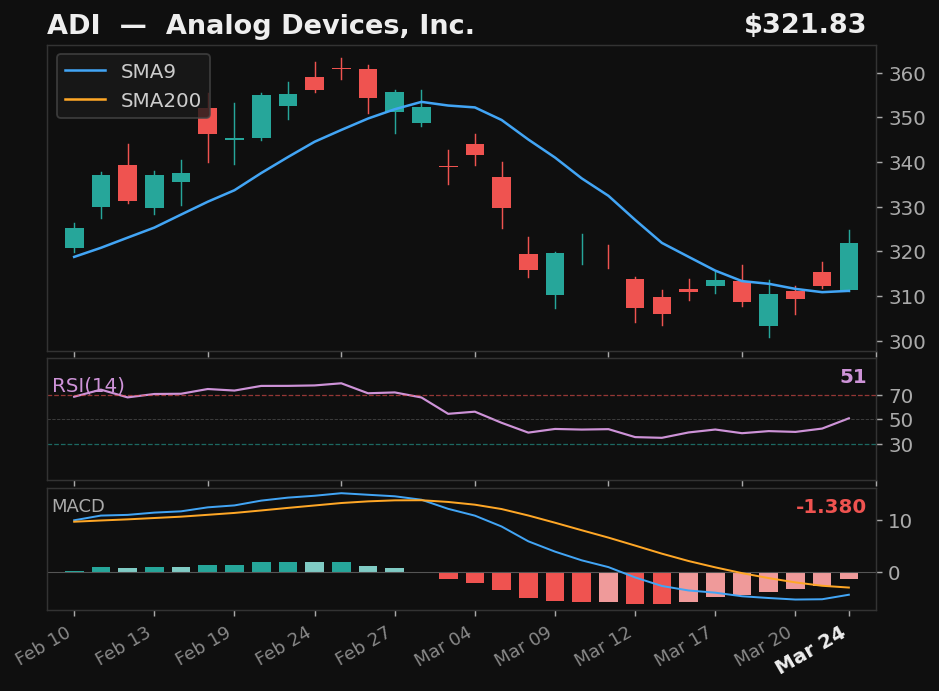
ADI
Analog Devices, Inc.
NASDAQ
- 14.0% pullback to SMA9
- Crossed above SMA9 — 2 days above
- RSI at 51, rising
- MACD histogram improving
Base✓Strict✓Score70.0
Returns
StockMktDiff
1D+0.1%+0.6%-0.5%
2D-2.6%-1.2%-1.4%
3D-4.5%-2.9%-1.5%
5D———
10D———
Alternative Setups
3 candidates · ranked by Empirical Score
 click to enlarge
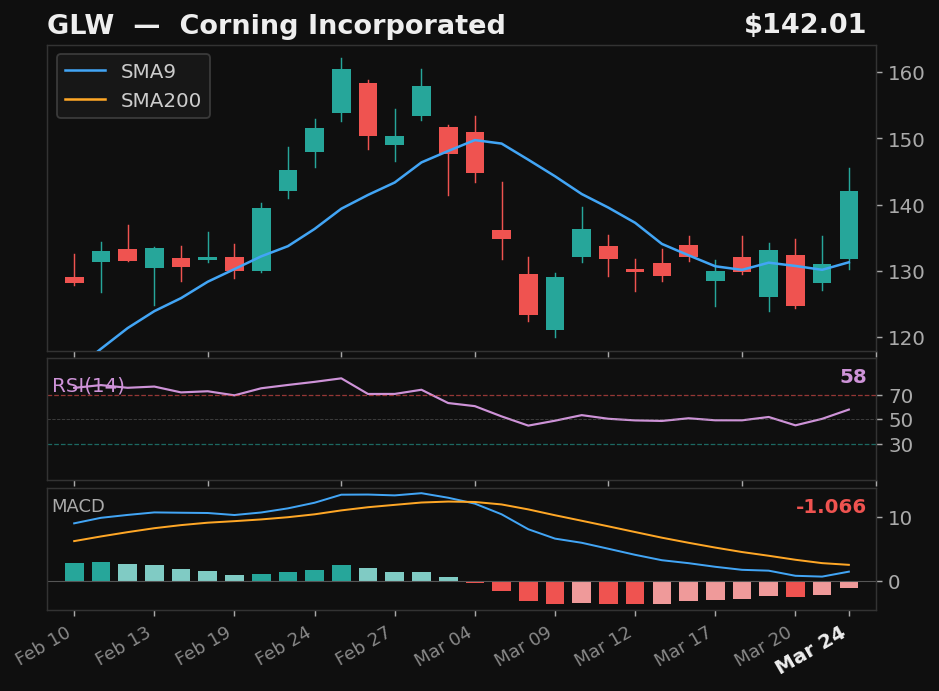
GLW
Corning Incorporated
NYSE
- 21.9% pullback — full candle body above SMA9
- RSI at 58 — confirmed recovery momentum
- MACD histogram rising while still negative — early recovery signal
- 65.3% above SMA200 — extended from trend
Emp Score71.4Body Above✓
Returns
StockMktDiff
1D+3.1%+0.6%+2.5%
2D-4.7%-1.2%-3.5%
3D-3.7%-2.9%-0.7%
5D———
10D———
 click to enlarge
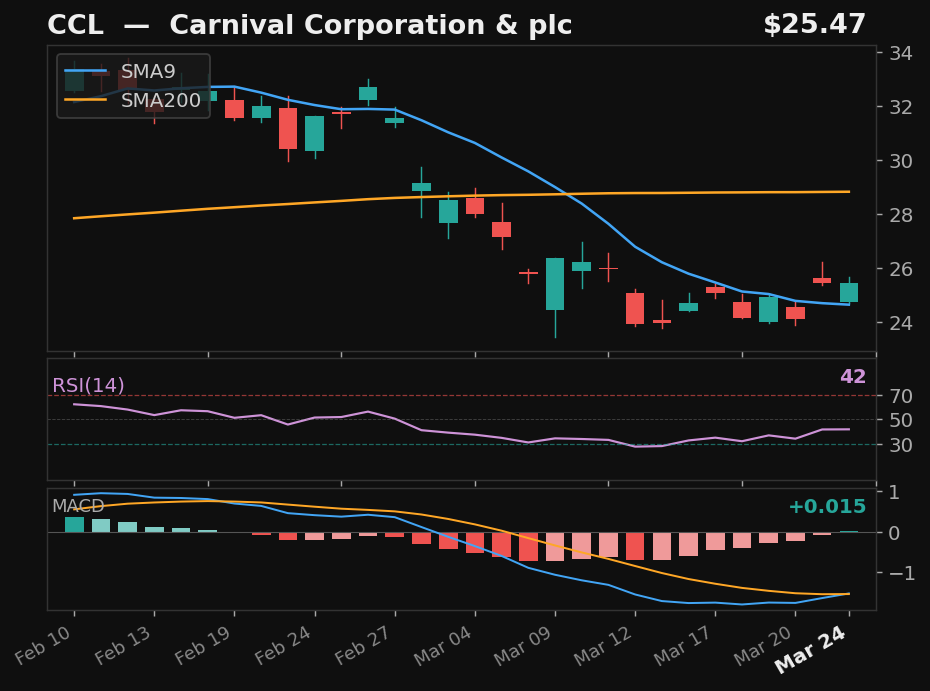
CCL
Carnival Corporation & plc
NYSE
- 26.9% pullback — full candle body above SMA9
- RSI rising from 42
- 11.6% below SMA200 — extended from trend
Emp Score57.2Body Above✓
Returns
StockMktDiff
1D+1.0%+0.6%+0.5%
2D-0.7%-1.2%+0.5%
3D-5.0%-2.9%-2.1%
5D———
10D———
 click to enlarge
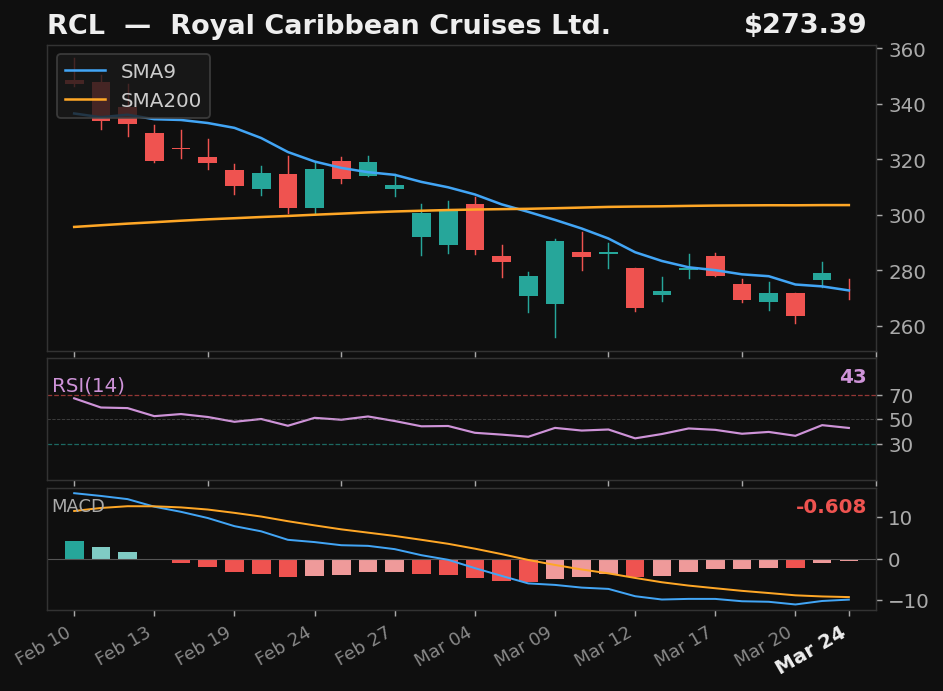
RCL
Royal Caribbean Cruises Ltd.
NYSE
- 24.1% pullback — full candle body above SMA9
- MACD histogram rising while still negative — early recovery signal
- 9.9% below SMA200 — extended from trend
Emp Score54.1Body Above✓
Returns
StockMktDiff
1D+2.1%+0.6%+1.5%
2D+0.2%-1.2%+1.5%
3D-4.2%-2.9%-1.3%
5D———
10D———