Wednesday, March 25, 2026 · After Close
SwingTrader Setups
10 candidates
 click to enlarge
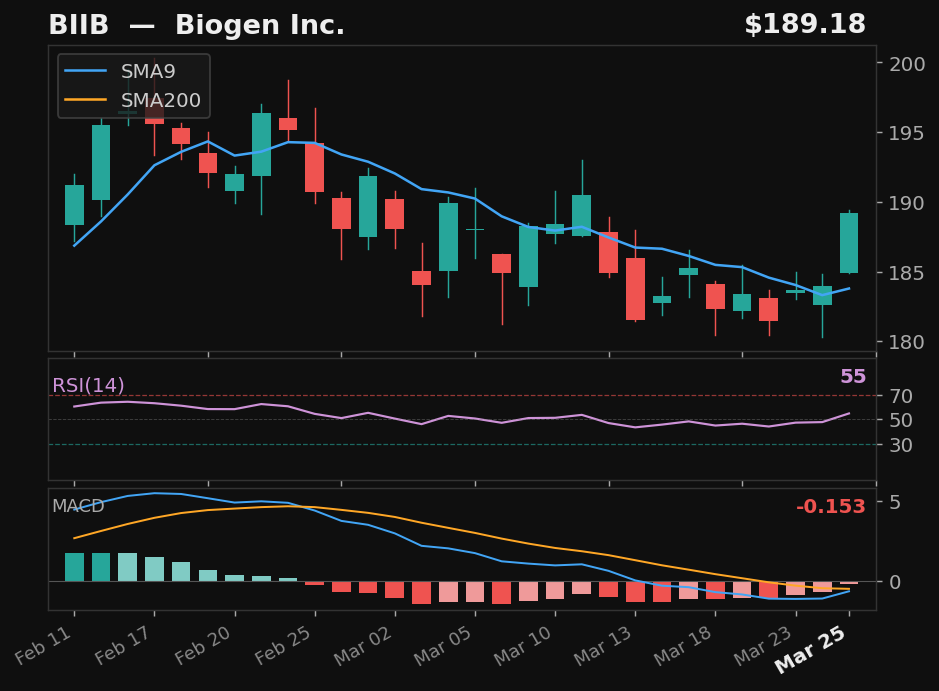
BIIB
Biogen Inc.
NASDAQ
- 7.0% pullback to SMA9
- Crossed above SMA9 — 2 days above
- RSI at 55, rising
- MACD histogram improving
Base✓Strict✓Score79.0
Returns
StockMktDiff
1D+1.0%-1.8%+2.8%
2D-2.8%-3.5%+0.6%
3D———
5D———
10D———
 click to enlarge
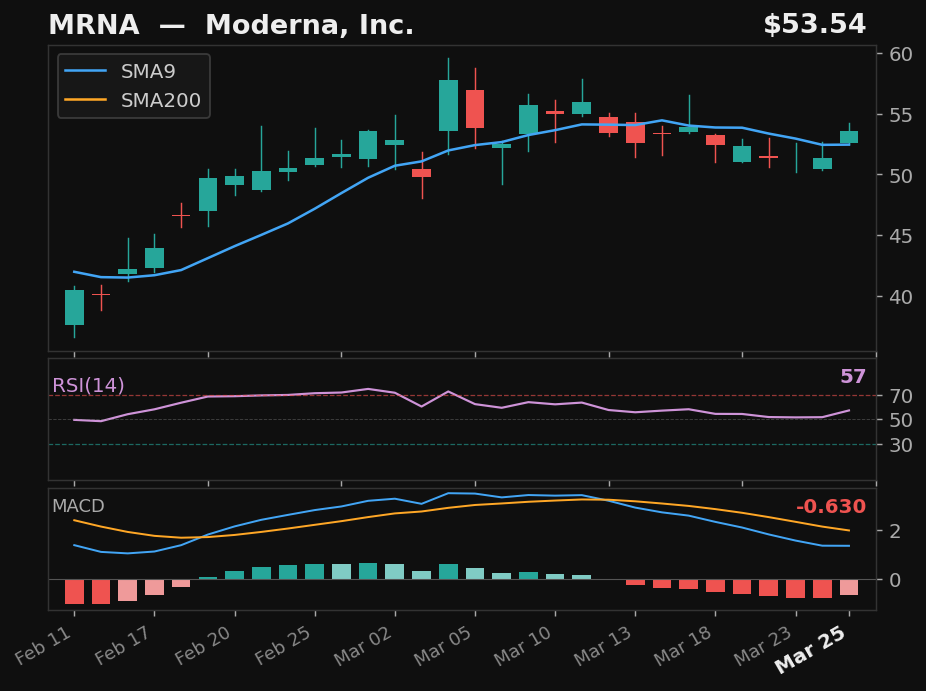
MRNA
Moderna, Inc.
NASDAQ
- 8.4% pullback to SMA9 over 9 days
- Crossed back above SMA9 today
- RSI at 57, rising
- MACD histogram improving
Base✓Strict✓Score79.0
Returns
StockMktDiff
1D+0.1%-1.8%+1.8%
2D-7.4%-3.5%-4.0%
3D———
5D———
10D———
 click to enlarge
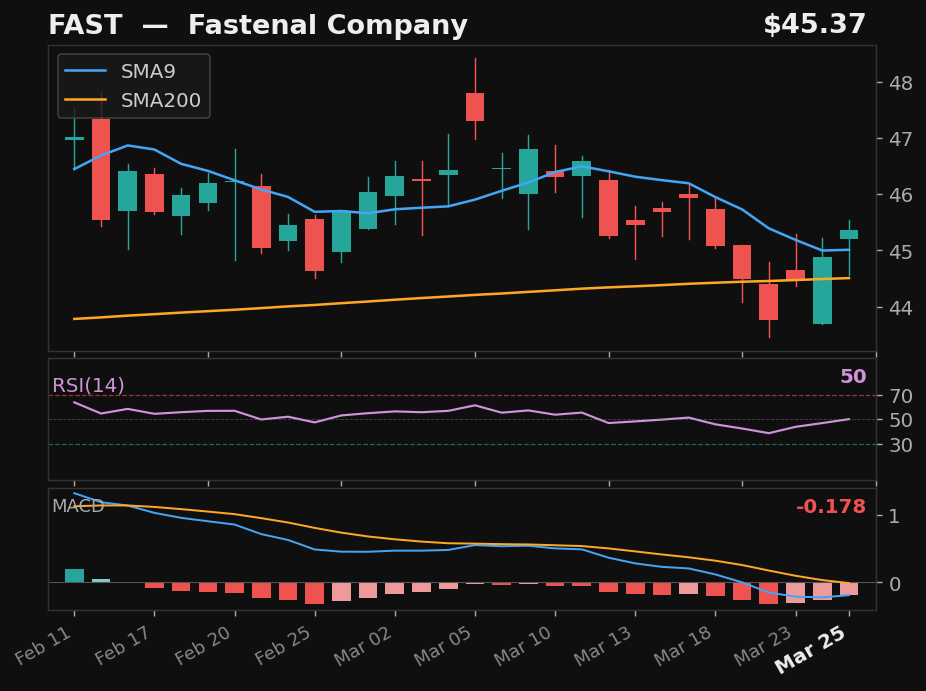
FAST
Fastenal Company
NASDAQ
- 6.5% pullback to SMA9 over 9 days
- Crossed back above SMA9 today
- RSI at 50, rising
- MACD histogram improving
Base✓Strict✓Score78.0
Returns
StockMktDiff
1D-0.6%-1.8%+1.2%
2D-0.9%-3.5%+2.5%
3D———
5D———
10D———
 click to enlarge
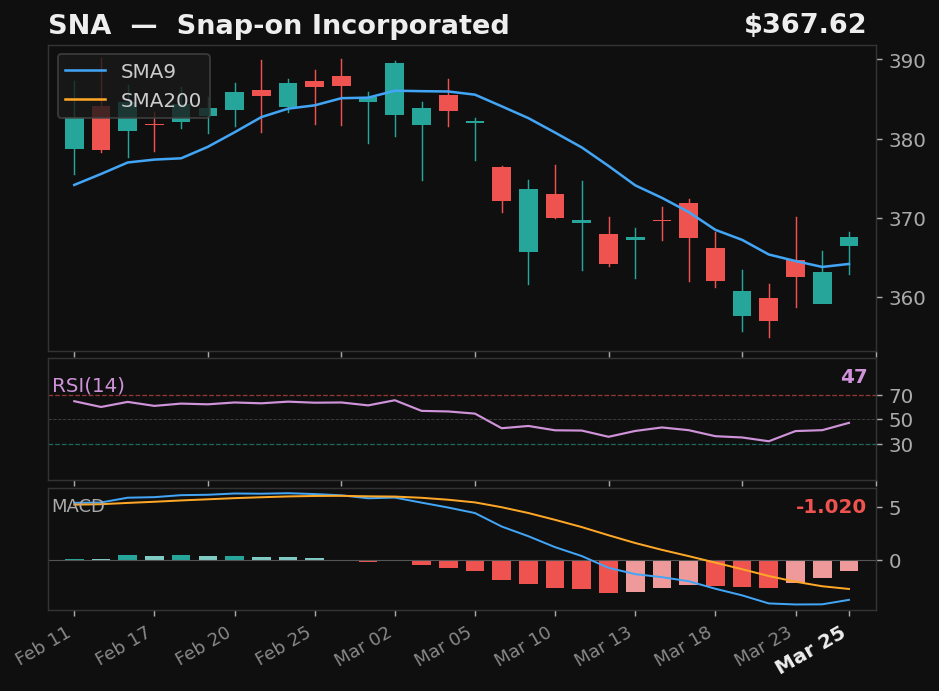
SNA
Snap-on Incorporated
NYSE
- 8.4% pullback to SMA9 over 16 days
- Crossed back above SMA9 today
- RSI at 47, rising
- MACD histogram improving
Base✓Strict✓Score75.0
Returns
StockMktDiff
1D-1.5%-1.8%+0.3%
2D-2.3%-3.5%+1.1%
3D———
5D———
10D———
 click to enlarge
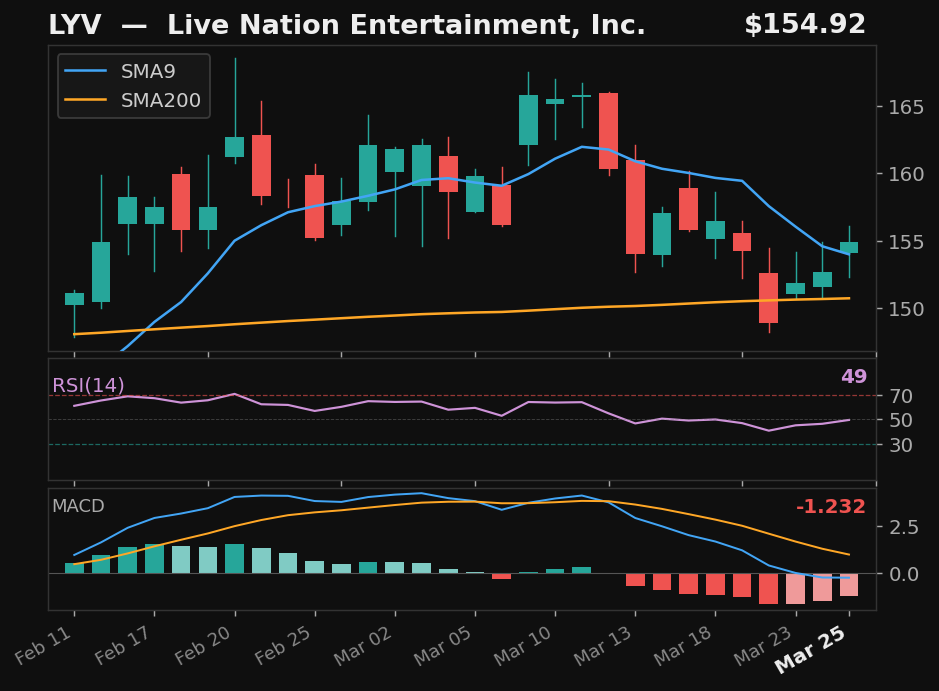
LYV
Live Nation Entertainment, Inc.
NYSE
- 10.2% pullback to SMA9 over 9 days
- Crossed back above SMA9 today
- RSI at 49, rising
- MACD histogram improving
Base✓Strict✓Score74.0
Returns
StockMktDiff
1D-3.1%-1.8%-1.4%
2D-5.9%-3.5%-2.5%
3D———
5D———
10D———
 click to enlarge
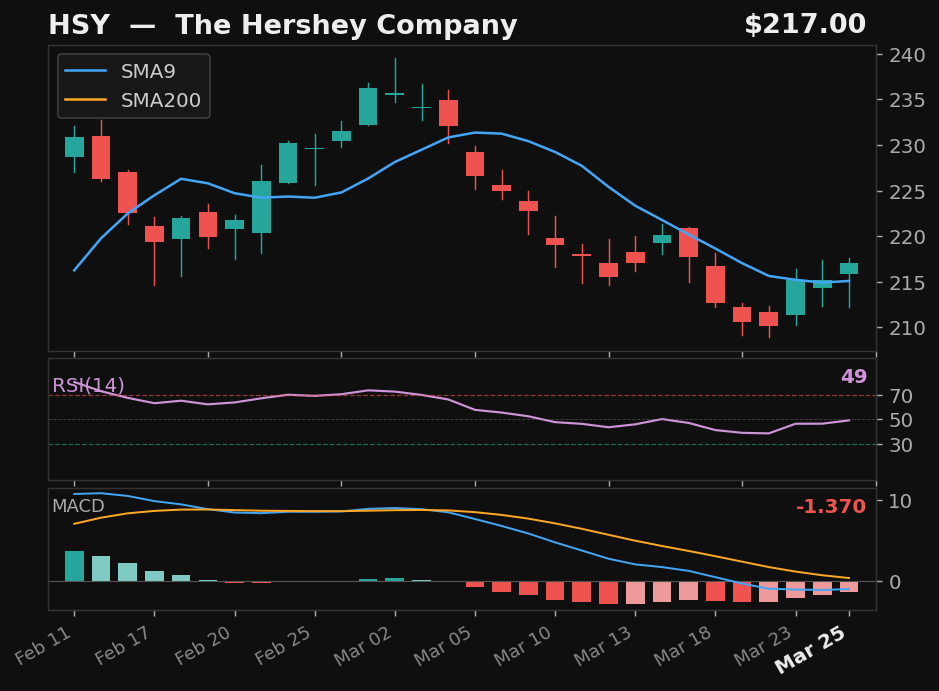
HSY
The Hershey Company
NYSE
- 9.4% pullback to SMA9
- Crossed above SMA9 — 2 days above
- RSI at 49, rising
- MACD histogram improving
Base✓Strict✓Score73.0
Returns
StockMktDiff
1D-3.0%-1.8%-1.2%
2D-1.5%-3.5%+2.0%
3D———
5D———
10D———
 click to enlarge
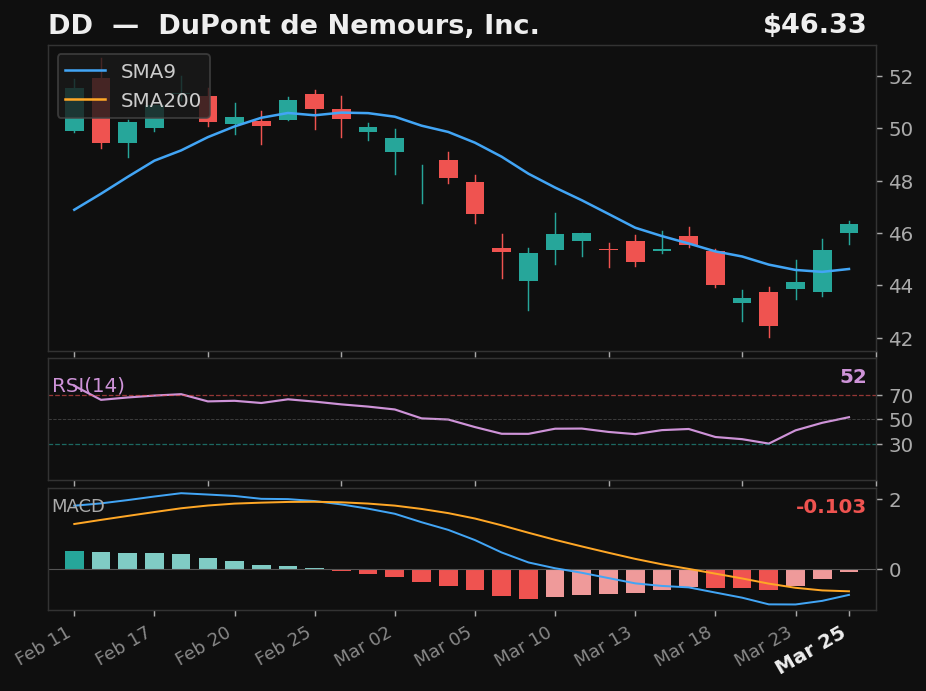
DD
DuPont de Nemours, Inc.
NYSE
- 16.4% pullback to SMA9
- Crossed above SMA9 — 2 days above
- RSI at 52, rising
- MACD histogram improving
Base✓Strict✓Score70.0
Returns
StockMktDiff
1D-0.7%-1.8%+1.1%
2D-2.3%-3.5%+1.2%
3D———
5D———
10D———
 click to enlarge
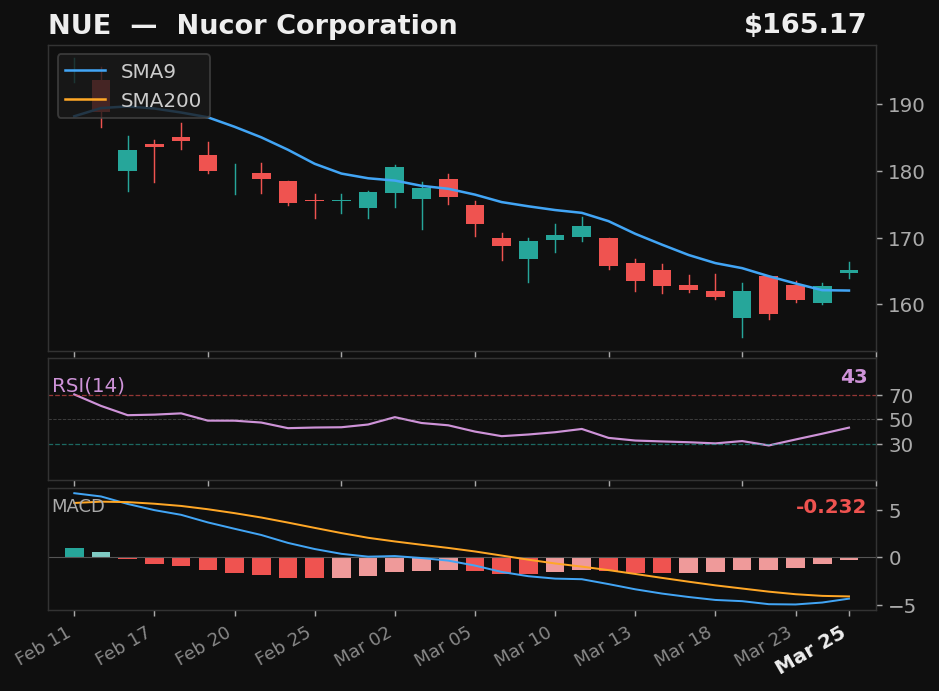
NUE
Nucor Corporation
NYSE
- 18.4% pullback to SMA9
- Crossed above SMA9 — 2 days above
- RSI rising from 43 — recovering momentum
- MACD histogram improving
Base✓Strict✓Score70.0
Returns
StockMktDiff
1D+0.5%-1.8%+2.3%
2D-1.1%-3.5%+2.4%
3D———
5D———
10D———
 click to enlarge
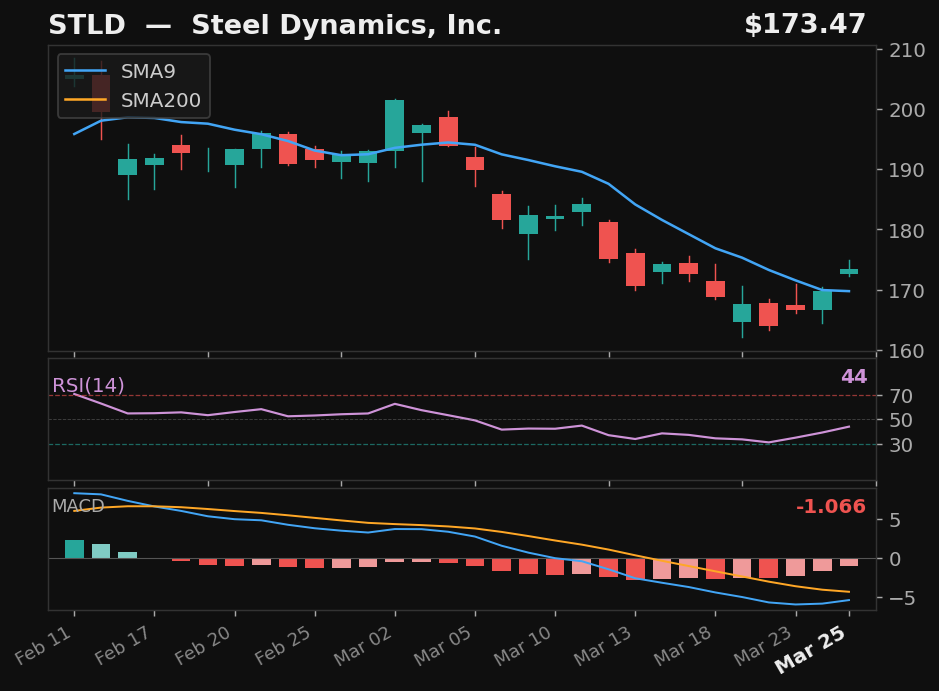
STLD
Steel Dynamics, Inc.
NASDAQ
- 17.0% pullback to SMA9 over 15 days
- Crossed back above SMA9 today
- RSI rising from 44 — recovering momentum
- MACD histogram improving
Base✓Strict✓Score67.0
Returns
StockMktDiff
1D+0.5%-1.8%+2.3%
2D-1.4%-3.5%+2.0%
3D———
5D———
10D———
 click to enlarge
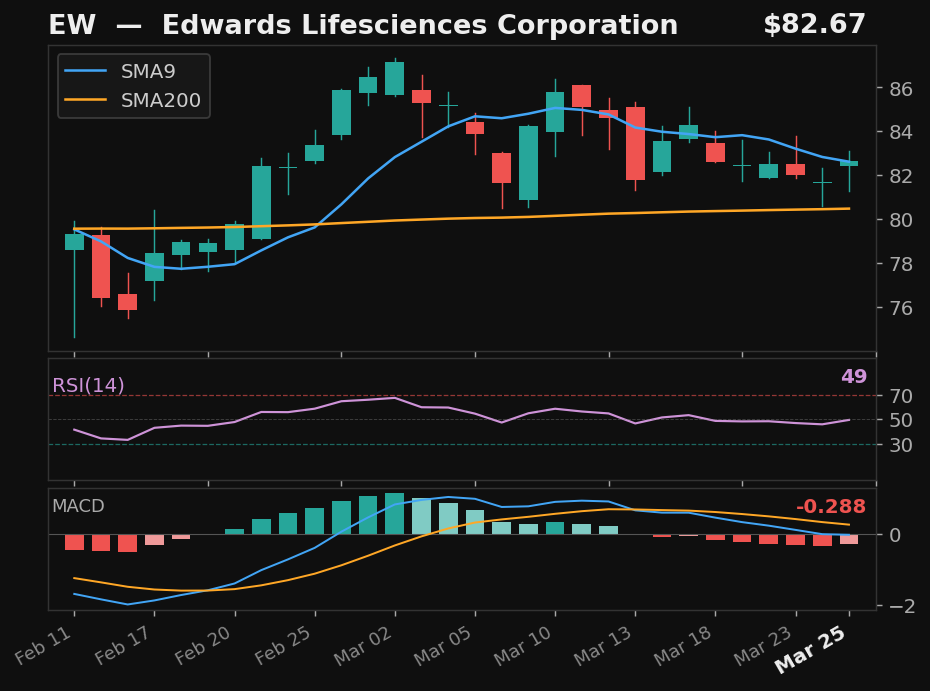
EW
Edwards Lifesciences Corporation
NYSE
- 4.0% pullback to SMA9 over 5 days
- Crossed back above SMA9 today
- RSI at 49, rising
- MACD histogram improving
Base✓Strict✗Score75.0
Returns
StockMktDiff
1D-0.7%-1.8%+1.1%
2D-4.0%-3.5%-0.6%
3D———
5D———
10D———
Alternative Setups
3 candidates · ranked by Empirical Score
 click to enlarge
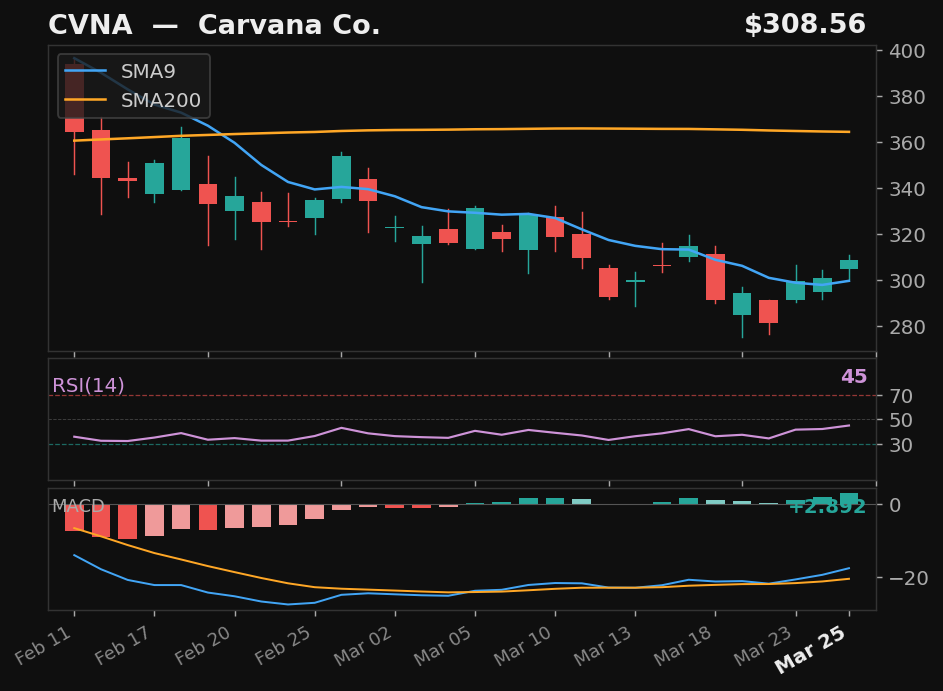
CVNA
Carvana Co.
NYSE
- 41.1% pullback — full candle body above SMA9
- RSI rising from 45
- 15.3% below SMA200 — extended from trend
Emp Score86.8Body Above✓
Returns
StockMktDiff
1D-2.3%-1.8%-0.5%
2D-2.1%-3.5%+1.3%
3D———
5D———
10D———
 click to enlarge
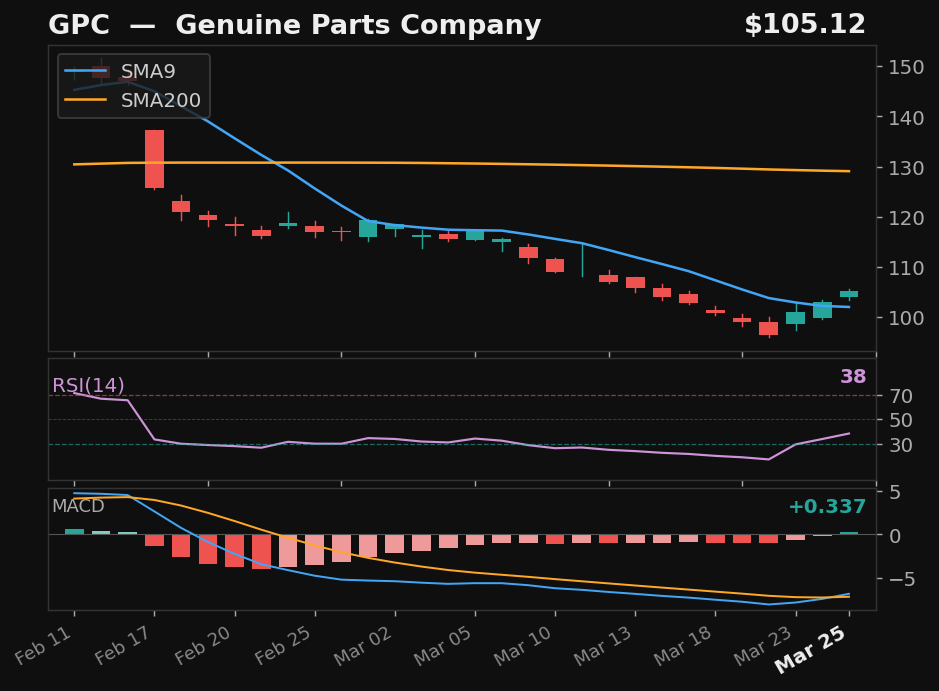
GPC
Genuine Parts Company
NYSE
- 34.5% pullback — full candle body above SMA9
- RSI rising from 38
- 18.6% below SMA200 — extended from trend
Emp Score74.6Body Above✓
Returns
StockMktDiff
1D+0.2%-1.8%+1.9%
2D-0.1%-3.5%+3.4%
3D———
5D———
10D———
 click to enlarge
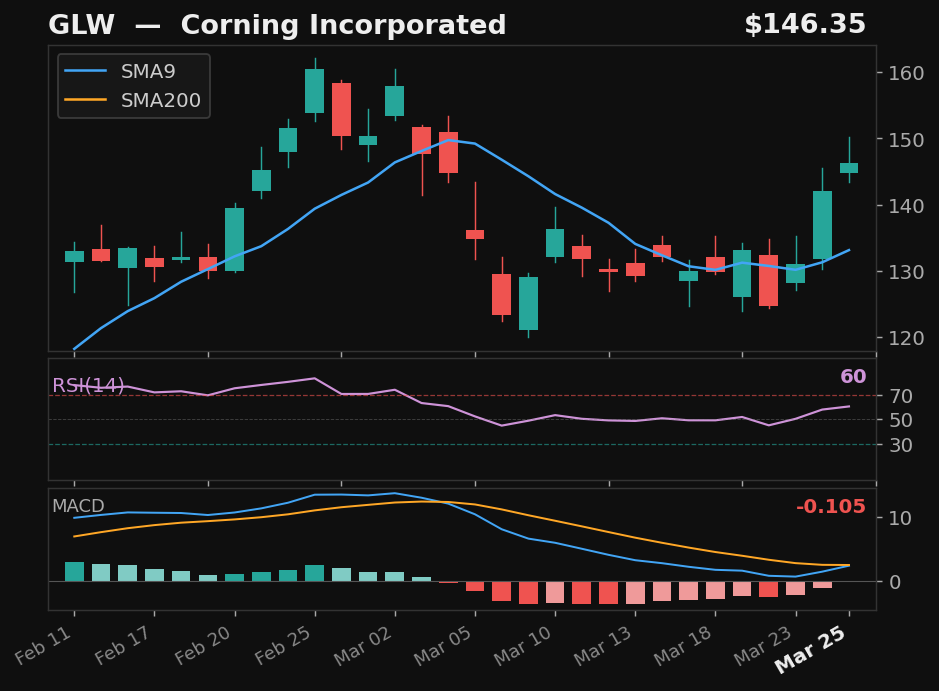
GLW
Corning Incorporated
NYSE
- 21.9% pullback — full candle body above SMA9
- RSI at 60 — confirmed recovery momentum
- MACD histogram rising while still negative — early recovery signal
- 69.4% above SMA200 — extended from trend
Emp Score72.6Body Above✓
Returns
StockMktDiff
1D-7.5%-1.8%-5.8%
2D-6.5%-3.5%-3.1%
3D———
5D———
10D———